Full Length Research Article
PRELIMINARY ASSESSMENT AND SPATIAL DISTRIBUTION OF SELECTED WATER QUALITY
PARAMETERS AT KALMADU TANK IN VAVUNIYA DISTRICT OF SRI LANKA
*Akther, M. S. R., Mohideen, A. R. H., Tharani, G., Samith Indika Maddumage, M. R. and
Naveendrakumar, G.
Department of Bio-Science, Faculty of Applied Science, Vavuniya Campus of the University of Jaffna, Sri Lanka
ARTICLE INFO ABSTRACT
This research on Kalmadu tank aims to analyze the horizontal and vertical profiles of selected water quality parameters. Twenty randomly selected sampling points on surface and corresponding vertical depths of 30 cm and 60 cm were measured for temperature, pH, TDS, EC and ORP using intended electronic probes. The measured values were statistically analyzed with t-test, paired t-test and Pearson correlation. Kriging interpolation technique was used to visualize the spatial distribution. Results revealed non-compliance of TDS and EC with existing permissible limits for irrigable water. Except the temperature with pH, all the other measured parameters resulted positive correlation and TDS trend resembled the spatial pattern of EC. The mean values of pH at 30 cm & 60 cm depth significantly differed with surface, similarly surface ORP varied from 30 cm depth. There are no significant vertical wise changes observed in the other tested parameters. Significant spatial variations were observed in the selected parameters from the kriging map. Reflection and shading of existing plants, microbial organic degradation, anthropogenic water usage, and small water current movements may be some of the influencing factors for this variation. This study suggests to policy makers and relevant management authority, to pay more attention to irrigation tanks in terms of maintaining irrigable water. In-depth investigation is imperative to identify the reason behind the changes in the tank water quality and would also yield further information to initiate appropriate strategies for the management of this tank.
Copyright © 2015 Akther et al. This is an open access article distributed under the Creative Commons Attribution License, which permits unrestricted use, distribution, and reproduction in any medium, provided the original work is properly cited.
INTRODUCTION
With an estimated three hectare of water for every square kilometer of the island, Sri Lanka is richly endowed with fresh water resources (Murray and Little, 2000). Among the freshwater ecosystem, irrigation tanks play a vital role serving to store and regulate the flow of water for agricultural use (Anuradha & Ambujam, 2012). The number of small natural and man-made lakes, ponds and reservoirs are probably in the millions. Although these small water bodies do not make a significant contribution to the global surface area, offering the same range of important services to nearby urban and rural populations as large lakes. The scientific understanding of these water bodies is being used in prescribing restoration methods. Unfortunately these are more susceptible to pollution than large lakes where ponds have been profoundly altered and have lost much of their value (William, 2000).
*Corresponding author: Akther, M. S. R.
Department of Bio-Science, Faculty of Applied Science, Vavuniya Campus of the University of Jaffna, Sri Lanka. Email: [email protected]
In Sri Lanka, there are 24,199 minor tanks while major tanks are nearly 542. Total command area under these tanks is 685,625 ha and represents 41.8% total land area of Sri Lanka (National Environmental Action Plan, 1988-2001). There are one major, 21 medium and 674 minor irrigation tanks including 26 anicuts in Vavuniya district. The water resources mainly depend on rainfall since there are no perennial rivers (Statistical hand book of Vavuniya district, 2014). This district has 3% of the minor tanks out of the total available tanks of same category in Sri Lanka. A significant feature that can be commonly observed in this district was that most of the tanks were connected in a cascade system. This system ensures the water availability in tanks throughout the year and helps recharging the groundwater. Being an agricultural district, more than 30,000 farm families are engaged in agriculture related activities, are dependent on this ecosystem for their economic livelihood (Somasiri, 1991). Most of the agriculture ventures primarily dependent on adequate water supply of irrigable quality.
ISSN: 2230-9926
International Journal of Development Research
Vol. 5, Issue, 06, pp. 4570-4576, June, 2015
DEVELOPMENT RESEARCH
Article History: Received 14st March, 2015
Received in revised form 02nd April, 2015
Accepted 01st May, 2015 Published online 28th June, 2015
Keywords:
Irrigation tank, Kriging interpolation, Spatial map, t-test,
Figure 1: Geographical location of study tank (showing sampling points) in Sri Lanka/Vavuniya district
So it is important to protect this ecologically valuable resource in order to sustain the benefits without exploiting the resource. The quality of water used for irrigation is extremely important for the success of agriculture. Thus assessment of water quality parameters is inevitable. Especially in Vavuniya district, studies on irrigation tank quality and management are in infant level. Hence, the investigation focuses the tank water quality; management should be addressed to the policy makers and relevant authorities to make more attention on this regard.
Objectives of this research are (1) to assess the status of measured water quality parameters with existing irrigation standards (2) to analyze the correlation within the parameters (3) to study the vertical and horizontal distribution of measured water quality parameters and (4) to generate spatial distribution maps.
MATERIALS AND METHODS
Geographical location
The Vavuniya district, located in the northern part of Sri Lanka, covers an area about 1967 km2, which is 10% of the land area of the entire North-East Province and 3% of the island. The district is categorized under the dry zone areas of Sri Lanka. The mean temperature of this district is 28°C with an annual rainfall of 1400 mm. The climatological conditions are suitable for cultivation. Due to its strategic geographic location, Vavuniya receives rainfall in a bi-modal pattern, obtained during October to late January (maha season) and from late April to late May (yala season). Geo-morphologically, it is a flat plain having undulated topography with broad valleys and small rock ridges forming cascade based agriculture (Samarakoon, 2004).
Study tank
Kalmadutank (Figure 1) lies between 8°50’20.32-42.74” latitude and 80°23’11.09-44.09” longitude. According to the Department of Irrigation of Sri Lanka, this tank comes under the medium tank category with an irrigable area of 161.87 ha. Water capacity and full supply depth are 127.9 ha∙m and 3 m respectively.
Approximately 107 farm families are dependent on this tank and which is significantly more comparing with other medium tanks in the district (e.g. Vavuniya tank, Pampaimadu tank, etc). In hydrological point of view, this is an important tank,
because considerable water level exists throughout the year while most of the tanks dry out especially during dry season. There are hardly any evidence of pollution input source found in the adjacent area, therefore it is assumed that this tank is free of heavy pollution.
Sampling
Altogether 20 sampling points were randomly selected approximately proportionate to the tank shape from Kalmadu tank using Google Earth Pro before the field investigation (Figure 2). The sampling activity was conducted during September of 2014 which is the dry season of this district. The maximum tank water level measured was 1 m.
Water sampler
In addition to the surface, samples were collected at vertical depths of 30cm and 60 cm from the surface. Sampling equipment was devised for the water sampling at Kalmadu is shown in Figure 3.
A water sampler was designed in a manner to lock the water at required depth. The high density PVC bottles were used for collecting water, while steel attachment serves as a handle.
Feeding stream
Figure 2: Kalmadu tank description and sample locations in drought season Landing site
Depth≈60 cm Tank bund Sluice gate
Mixing region
× - Sample points
- Virtual boundary (approx.) indicate the
deep & shallow regions of tank
Depth>60 cm
Figure 3: Simple water sampler used at Kalmadu tank to sample at different depths (a) actual photograph (b) line diagram
(a) (b)
Nylon rope
Metal base Tube seal Metal stopper
Handle
Nylon rope
Iron weight Metal clamp PVC tube
End-cap Kalmadu tank
N
Sri Lanka
Vavuniya district
[image:2.595.44.283.560.705.2]The equipment was marked with graduated scale in order to ensure that the sample was collected at a set depth. The functions of the each parts of the water sampler is briefly described below.
PVC tube : Collect and holds the sample water
Tube end-cap : Used to seal the tube bottom
Metal base : It holds the PVC tube
Metal clamps : Helps to holds the PVC tube vertically Tube cap or seal : Prevent the water penetration when
submerged
Iron ball/weight : Helps to seal the PVC tube when there is no force on rope
Nylon rope : Used to connect to pull the tube cap and iron ball
Upper metal stopper : Limits the further movement of tube cap
Handle : Stiffly support the sampler portion and contains scale which helps to lower to the desired depth.
Water quality parameter measurements
Selected water quality parameters were determined considering the tank is free of heavy pollutants. Therefore temperature, pH, TDS (Total Dissolved Solids), EC (Electrical Conductivity) and ORP (Oxidation Redox Potential) were selected as preliminary water quality parameters, and measured from each location (on the spot) using intended laboratory grade portable electronic probes.
Test for compliance
The measured data was compared with national permissible limits for irrigable water to deduce the status of the tank water quality. Measured values at various depths (i.e. Surface, 30 cm, and 60 cm depths individually) and pooled (combined) data were tested with national standard. The Student’s t-test was performed to compare with national standards.
Paired t-test
Samples obtained from surface and various depths were considered as three groups and their mean values were tested for statistical significance using paired t-test. The compared pairs were surface vs. 30 cm, surface vs. 60 cm and 30 cm vs. 60 cm.
Correlation
A pair-wise correlation analysis was performed for the pooled data to understand the changes in one variable with others. The same technique was used to find out the depth wise changes within each variable. For the statistical analysis, platforms like Minitab 16, SPSS 16 and Ms Excel were exploited, and all the statistical analysis were tested at 5% significance level (α=0.05).
Spatial distribution analysis and mapping
The sample points were mapped digitally using intended shape files (Grid No.1625 in Sri Lanka) using ArcGIS 10.2. Among the existing interpolation techniques such as Kriging, Inverse
Distance Weighting (IDW), Spline, Natural neighbor etc., to visualize the spatial distribution of parameters, kriging interpolation technique was exploited. Different techniques may be fit for various situations as no method is uniquely optimal. For water quality analysis, the kriging interpolation provides best results than the other well-known techniques (Maghami, et al., 2011; Murphy, et al., 2010). Kriging can be defined as a weighted, moving-average estimation technique based on geostatistics that uses the spatial correlation of point measurements to estimate value at adjacent, unmeasured points. Further, it is a technique where a set of weights assigned to samples and locations of the samples relative to each other, and to the point or block being estimated (Ranjith Premalal De Silva & Gunasena, 2006).
RESULTS AND DISCUSSION
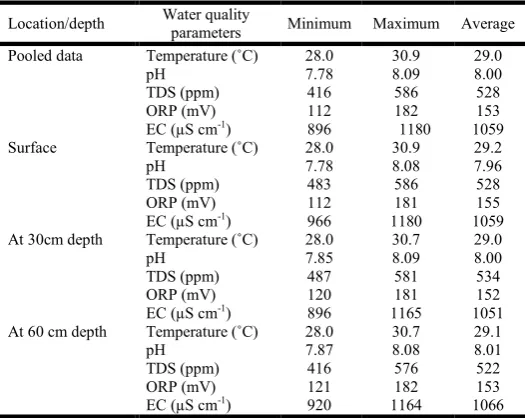
[image:3.595.302.565.330.539.2]Statistical summary of the measured parameters were tabulated and shown as pooled, surface, 30cm and 60cm water depth (Table 1).
Table 1. Min, Max and Average values of water quality parameters at different location/depth in Kalmadu tank
Location/depth Water quality
parameters Minimum Maximum Average Pooled data Temperature (˚C) 28.0 30.9 29.0
pH 7.78 8.09 8.00
TDS (ppm) 416 586 528
ORP (mV) 112 182 153
EC (µS cm-1) 896 1180 1059
Surface Temperature (˚C) 28.0 30.9 29.2
pH 7.78 8.08 7.96
TDS (ppm) 483 586 528
ORP (mV) 112 181 155
EC (µS cm-1) 966 1180 1059
At 30cm depth Temperature (˚C) 28.0 30.7 29.0
pH 7.85 8.09 8.00
TDS (ppm) 487 581 534
ORP (mV) 120 181 152
EC (µS cm-1) 896 1165 1051
At 60 cm depth Temperature (˚C) 28.0 30.7 29.1
pH 7.87 8.08 8.01
TDS (ppm) 416 576 522
ORP (mV) 121 182 153
EC (µS cm-1) 920 1164 1066
EC and TDS
EC is the measure of ions present in water as the conductivity increases with the number of ions. It is also effectively a surrogate for total dissolved solids (TDS) and is important for irrigation because it is a measure of the salinity of the water (Metcalf & Eddy, 2003). Salinity level of irrigation water should always be considered as an important parameter because it affects crop, soil as well as water quality.
Table 2. t-test results for EC and TDS with existing water quality standards
Location Water quality parameters
Maximum Permissible
limits*
Average p value
Pooled EC (µS cm-1) 700 1059 0.000
TDS (ppm) 500 528 0.000
Surface EC (µS cm-1) 700 1059 0.000
TDS (ppm) 500 528 0.002
30 cm depth EC (µS cm-1) 700 1051 0.000
TDS (ppm) 500 534 0.000
60 cm depth EC (µS cm-1) 700 1066 0.000
TDS (ppm) 500 522 0.084
*existing standards obtained from CEA (Central Environmental Authority), 2001
Temperature
Temperature affects chemical reactions and reaction rates within the waste water, thereby influencing its suitability for beneficial use such as irrigation (Metcalf & Eddy, 2003). In Kalmadu tank, the temperature ranged from 28.0 to 30.9˚C.
pH
The suitable pH range for the existence of most biological life is quite narrow and critical (Metcalf & Eddy, 2003). The resulted pH range was 7.78-8.09 and lies within the values of Sri Lankan guideline for irrigation water (CEA, 2001).
ORP
The acquired ORP range was 112 to 182 mV. Measurement of ORP is a very straight forward measurement of the sanitizing power of irrigation water (Newman, 2004). Thus it can be assumed that the value of ORP could not significantly affect the irrigation quality.
Pair-wise correlation
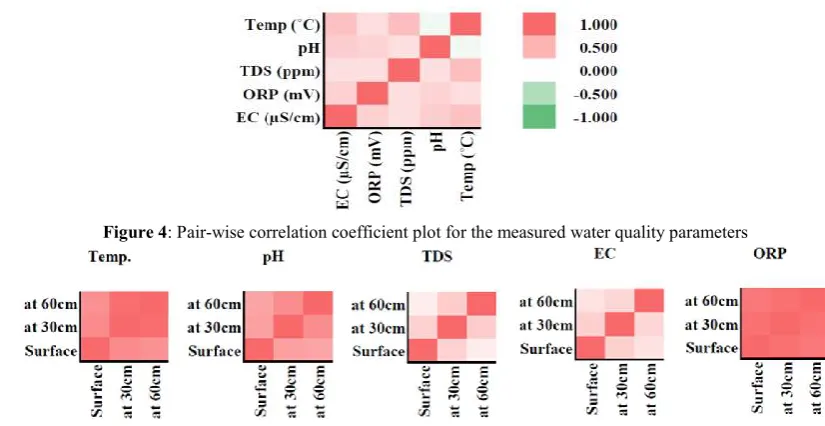
A correlation analysis was performed as a preliminary descriptive technique to understand the systematic changes in the value of one variable accompanied by systematic changes in the other (Wijesekara, et al., 2014). Figure 4 shows the graphical representation of pair-wise Pearson correlation between the measured parameters.
It was found that except Temperature with pH, all the other measured parameters have positive correlation in between them. At the same time the matrix implies a negative correlation between temperature and pH. From Figure 5, it is possible to presume there are changes in individual water quality parameters along the depth. Also the relationship was found to be positive ranging from 0.12 to 0.98 (Pearson correlation coefficient (r)). Especially it was found TDS and EC were same in terms of trend, but both values decreasing with depth. EC is an indirect measure of TDS in water bodies and usually the conversion factor ranges between 0.48 and 0.86 depending on the unique mixture of materials dissolved in the water medium (Niekerk, et al., 2014). The conversion factor was calculated by dividing the TDS (mg L-1) by EC (µS cm-1) and it was found to be 0.50 for the Kalmadu tank. This value lies within the ranges mentioned in various literatures for fresh water (Ali, et al., 2012; Atekwana, et al., 2004; Niekerk, et al., 2014).
Depth-wise changes
[image:4.595.309.553.383.465.2]In order to find out the significant changes along the vertical depth of tank water statistically, a paired t-test was performed since three samples were tested at a single point (i.e. Surface, 30 cm and 60 cm depths).
Table 3. Summarized p-values of paired t-test to compare means at different depths
Water quality parameters
p-values of paired t-test at different depths
Surface vs. 30 cm Surface vs. 60 cm 30 cm vs. 60 cm
Temp. 0.134 0.251 0.331
pH 0.009 0.006 0.583
TDS (ppm) 0.573 0.519 0.231
ORP (mV) 0.041 0.326 0.422
EC (µS cm-1) 0.611 0.602 0.294
p-values in bold indicate the significant difference at α=0.05
[image:4.595.82.495.562.775.2]Results (Table3) clearly indicate there were differences only in the mean values of pH at 30 cm & 60 cm depth comparing with the surface samples. While, surface ORP samples showed significant difference with 30 cm depth and it is obviously clear that there is no significant vertical wise changes in the other tested parameters.
Figure 4: Pair-wise correlation coefficient plot for the measured water quality parameters
Spatial analysis
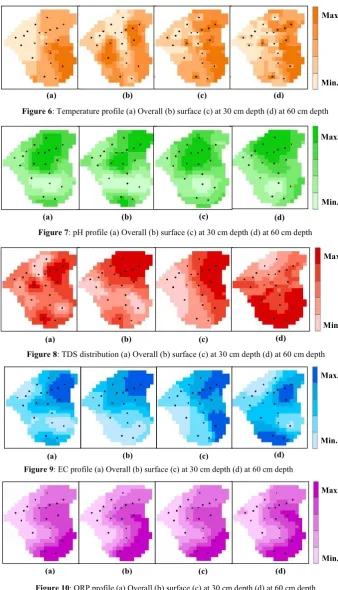
Along all the depths, relatively lower temperature was observed near the landing site. The same trend is prominent with considered depths (Figure 6). The observed temperature profile may be due to the reflection and shade of floating and submerged aquatic plants exist at Kalmadu tank. Adjacent to the mixing region on the surface (just after the feeding stream), the observed pH was relatively low when comparing with other regions. Same pattern was observed throughout the measured depths too (Figure 7).
[image:5.595.124.463.182.773.2]This may be due to the microbial organic degradation process (which releases acidic chemicals) and presence of aquatic plants. Adjacent to the tank bund, relatively higher TDS was observed near the surface (Figure 8). It may be due to the anthropogenic usage of water. In addition to this 60cm depth samples were detected with higher TDS values in mixing region (Figure 8(d)). It could be due to the small currents movements towards the tank from feeding stream which may have disturbed the bottom of the tank.
Figure 6: Temperature profile (a) Overall (b) surface (c) at 30 cm depth (d) at 60 cm depth
(a) (b)
Max.
Min.
(d) (c)
Min. Max.
(a) (b) (c) (d)
Figure 7: pH profile (a) Overall (b) surface (c) at 30 cm depth (d) at 60 cm depth
Max.
Min.
(a) (b) (c) (d)
Figure 8: TDS distribution (a) Overall (b) surface (c) at 30 cm depth (d) at 60 cm depth
Figure 9: EC profile (a) Overall (b) surface (c) at 30 cm depth (d) at 60 cm depth
Max.
Min.
(c) (d)
(a) (b)
Max.
Min.
(a) (b) (c) (d)
[image:5.595.125.468.188.280.2]Depth wise changes of EC values nearly resembles the TDS profile (Figure 9), i.e. higher EC values were observed near the tank bund for surface samples and near the mixing region for 60 cm samples (Figure 9(d)). In the mixing region where the shallow water exists, ORP was observed to be high than the other regions (Figure 10). It may be due to the higher DO (Dissolved Oxygen) level thus increase aerobic microbial organic degradation (Drever, 1982). It also should be noted, the regions in which ORP was high, it is possible to observe the acidic pH.
Conclusion and Recommendations
Since agriculture is the foremost source of livelihood of the study area, the assessment of water quality parameters and proper maintenance of tanks in terms of irrigation is essential. Based on the analysis carried out in the Kalmadu tank, TDS and EC statistically does not comply with the national and international standards among the other water quality parameters except to TDS measurements at 60 cm depth. Correlation analysis reveals, all the other measured parameters show positive correlation except the temperature with pH. In addition to this, in all individual parameters along the depth, revealed a positive relationship ranged from 0.12 to 0.98.TDS and EC followed the same trend, but both values decreased with depth, the conversion factor being 0.50 for Kalmadu tank. Measured values of individual parameters with the depth revealed that, only the mean values of pH at 30 cm and 60 cm depth with the surface samples statistically differ. While there are no significant vertical wise changes in the other tested parameters, surface ORP samples showed significant difference with 30 cm depth.
From the kriging interpolation technique the spatial distribution pattern of the measured parameters were visualized. The temperature profile showed relatively lower temperature near the landing site because of the reflection and shading of existing plants at Kalmadu tank. Just after the feeding stream, the observed pH was relatively low due to the microbial organic degradation process and presence of aquatic plants. Adjacent to the tank bund, relatively higher TDS was observed near the surface may be due to the anthropogenic usage of water. Especially in mixing region, 60 cm depth samples were detected with higher TDS values due to the small water current movements. Depth wise changes of EC values nearly resemble the TDS profile. In the mixing region where the shallow water exists, ORP was observed to be high. It may be due to the higher DO which increases aerobic microbial organic degradation. This investigation suggests policy makers and relevant management authority, to pay more attention to irrigation tanks in terms of maintaining irrigable water. Documentation and mapping using ArcGIS would be helpful for planning to provide effective and efficient management. This assessment may provide some understanding about status and behavior of tank water quality for future researchers. Further an in-depth investigation is necessary to identify the reason for the changes in the tank water quality could provide more information to initiate appropriate strategies for tank management.
Acknowledgement
We indeed, take this opportunity to convey our gratitude to Mr. S. Senthooran (Govt. Surveyor, Anuradhapura, Sri Lanka)
for providing guidance on spatial related mappings and we would like to thank Dr. Benjamin Jeevanan Benedict (Medical Intern, Colombo, Sri Lanka) for many helpful discussions about paper writing.
REFERENCES
Ali, N. S., Mo, K. and Kim, M., 2012. A case study on the relationship between conductivity and dissolved solids to evaluate the potential for reuse of reclaimed industrial wastewater. KSCE Journal of Civil Engineering, 16(5), pp. 708-71.
Anuradha, B. and Ambujam, N., 2012. Impact of tank rehabilitation on improved efficiency of storage structures.
International Journal of Research and Applications
(IJERA), 2(4), pp. 1941-1943.
Atekwana, E. A., Atekwana, E. A. and Roweb, R. S., 2004. The relationship of total dissolved solids measurements to bulk electrical conductivity in an aquifer contaminated with hydrocarbon. Journal of Applied Geophysics, Volume 56, p. 281– 294.
Ayers, R. and Westcot, D., 1994. Water quality for agriculture. Rome: Food and Agriculture Organization of the United Nations.
CEA, 2001. Proposed Ambient Water Quality Standards for Inland Waters Sri Lanka, Central Environmenal Authority, Colombo, Sri Lanka.
Statistical hand book of Vavuniya district., 2014. Vavuniya District Secretariat, Sri Lanka.
Drever, J., 1982. The geochemistry of of natural waters, surface and ground water environments. Englewood Cliffs New Jersey: Prentice-Hall.
Maghami, Y., Ghazavi, R., Vali, A. A. and Sharafi, S., 2011. Evaluation of spatial interpolation methods for water quality zoning using GIS Case study, Abadeh Township.
Geography and Environmental Planning Journal, 42(2),
pp. 35-36.
Metcalf & Eddy, 2003. Wastewater Engineering: Treatment, Disposal, and Reuse. 4 ed. New york: McGraw-Hill. Murphy, R. R., Curriero, F. C. and Bal, W. P., 2010.
Comparison of Spatial Interpolation Methods for Water Quality Evaluation in the Chesapeake Bay. Journal of
Environmental Engineering, 136(2), pp. 160-171.
Murray F. and Little D., 2000. Aquaculture in Small-Scale Farmer Managed Irrigation Systems in North West Province, Sri Lanka and Potential for Aquaculture. DFID aquaculture Research Program.
National Environmental Action Plan, 1988-2001. Ministry of Forestry and Environment, Sri Lanka.
Newman, S. E., 2004. Disinfecting Irrigation Water for Disease Management. California, Society of American Florists.
Niekerk, H. V., Silberbauer, M. and Maluleke, M., 2014. Geographical differences in the relationship between total dissolved solids and electrical conductivity in South African rivers. Water SA, 40(1), pp. 133-137.
Ranjith Premalal De Silva and Gunasena, C., 2006. Spatial Statistics: Theory and Applications. 2nd ed.:Geo-informatics Society of Sri Lanka.
Lanka: Unpublished MSc report in Engineering geology and hydrogeology, PGIS, University of Peradeniya. Somasiri, S., 1991. Irrigation potential of minor tanks and their
agricultural stability. Trop. Agric., Volume 147, pp. 41-57. Wijesekara, S. S., Mayakaduwa, S. S., Siriwardana, A. R.,
Silva, N. d., Basnayake, B. F., Kawamoto, K., & Vithanage, M., 2014. Fate and transport of pollutants through a municipal solid waste landfill leachate in Sri Lanka. Environ Earth Sci., Volume 72, p. 1707–1719.
William, M. L., 2000. Basis for the protection and management of tropical lakes. Lakes Reservoirs: Research
and Management, Volume 5, pp. 35-48.