Tompson, William (2007) Healthcare reform in Russia:
problems and
prospects. Working Paper. Organisation for Economic Co-operation and
Development, Paris, France.
Downloaded from:
Usage Guidelines:
Please refer to usage guidelines at or alternatively
Birkbeck ePrints: an open access repository of the
research output of Birkbeck College
http://eprints.bbk.ac.uk
Tompson, William (2007) Healthcare reform in
Russia: problems and prospects.
Economics
Department Working Paper No 538. ECO/WKP
(2006)66, Organisation for Economic Co-operation
and Development
This is an exact copy of a working paper published on the OECD website at
http://www.olis.oecd.org/olis/2006doc.nsf/linkto/eco-wkp(2006)66
All articles available through Birkbeck ePrints are protected by intellectual
property law, including copyright law. Any use made of the contents should
comply with the relevant law. Copyright © OECD, 2006.
Citation for this version:
Tompson, William (2007) Healthcare reform in Russia: problems and
prospects.
London: Birkbeck ePrints.
Available at:
http://eprints.bbk.ac.uk/archive/00000504
Citation for the publisher’s version:
Tompson, William (2007) Healthcare reform in Russia: problems and
prospects.
Economics Department Working Paper No. 538. ECO/WKP
(2006)66. Economics Department, Organisation for Economic Co-operation
and Development
http://eprints.bbk.ac.uk
Organisation de Coopération et de Développement Economiques
Organisation for Economic Co-operation and Development 15-Jan-2007
___________________________________________________________________________________________
English text only
ECONOMICS DEPARTMENT
HEALTHCARE REFORM IN RUSSIA: PROBLEMS AND PROSPECTS
ECONOMICS DEPARTMENT WORKING PAPERS No. 538
By
William Tompson
All Economics Department Working Papers are available through OECD's website at www.oecd.org/eco/working_papers
JT03220416
ECO/WKP(2006)66
Un
cl
assi
fi
ed
E
n
gl
ish
ABSTRACT/RÉSUMÉ
Healthcare Reform in Russia: Problems and Prospects
This paper examines the prospects for reform of Russia’s healthcare system. It begins by exploring a number of fundamental imbalances that characterise the current half-reformed system of healthcare provision before going on to assess the government’s plans for going ahead with healthcare reform over the medium term. The challenges it faces include strengthening primary care provision and reducing the current over-reliance on tertiary care; restructuring the incentives facing healthcare providers; and completing the reform of the system of mandatory medical insurance.
This paper relates to the OECD Economic Survey of the Russian Federation 2006
(www.oecd.org/eco/surveys/russia).
JEL classification: I11, I12, I18
Keywords: Russia; healthcare; health insurance; competition; primary care; hospitalisation; pharmaceuticals; single payer;
*****************
La reforme du système de santé en Russie: problèmes et perspectives
La présente étude analyse les perspectives de réforme du système de santé en Russie. Il commence par explorer un certain nombre de déséquilibres fondamentaux qui caractérisent le système actuel, en état de semi-réforme, avant de passer en revue les projets du gouvernement à moyen terme. Les principaux enjeux sont de renforcer les soins primaires et réduire le recours excessif aux soins tertiaires, de réexaminer les incitations auxquelles font face les prestataires de soins et de mener à son terme la réforme de l'assurance-maladie obligatoire.
Ce Document de travail se rapporte à l'Étude économique de l'OCDE de la Fédération de Russie 2006
(www.oecd.org/eco/etudes/russie).
Classification JEL: I11, I12, I18
Mots clés: Russie; système de santé; assurance-maladie; compétition; soins primaires; hospitalisation; produits pharmaceutiques; payeur unique;
Copyright OECD, 2006
TABLE OF CONTENTS
ABSTRACT/RÉSUMÉ ... 2
The context of healthcare reform ... 5
Healthcare reform must be addressed in the larger context of Russia’s health and mortality crisis ... 5
The Russian healthcare system today is the product of an unfinished reform... 9
The need for healthcare reform ... 13
The semi-reformed state of the healthcare system aggravates its underlying structural imbalances... 13
Healthcare providers and insurers face perverse micro-level incentives... 18
The direction of healthcare reform... 21
The government has recently been stepping up its healthcare reform efforts ... 21
The government has recently confirmed its healthcare reform priorities for the period to 2010 ... 23
What can be done to balance commitments and resources?... 23
How can a restructuring of provision be engineered? ... 25
What will it take to complete the transition to competitive insurance-based medicine?... 26
Is there scope for regional diversity of approach?... 30
How can the problem of micro-level incentives be resolved?... 31
Conclusion... 32
BIBLIOGRAPHY... 34
ANNEX 5.A1 The Guaranteed Package Programme... 37
Tables 5.1. Selected health and demographic indicators ... 6
5.2. Structure of healthcare provision by level of government, 2004 ... 13
5.3. Indicators of resource use in the health care sector, 2004... 16
5.4. Priority National Project... 22
Figures 1.9. Life expectancy and healthy life expectancy at different ages... 6
5.1. Health care spending ... 8
5.2. Financing public healthcare in the Russian Federation 2005... 11
5.3. Public and private health expenditure ... 14
5.4. Methods of paying for outpatient care through regional OMS funds, 2004... 20
5.5. Methods of paying for inpatient care through regional OMS funds, 2004... 21
Healthcare Reform in Russia: Problems and Prospects
by
William Tompson1
1. Since 1991, the centrepiece of healthcare reform in the Russian Federation has been the transition from an integrated, hierarchical model of healthcare provision to a more decentralised, contested and insurance-based system of public healthcare. That transition is still unfinished. The initial steps were taken in 1991–93, but little was done in the decade that followed to complete the process, and it is this that accounts for many of the problems facing Russia’s healthcare system. The recent reinvigoration of healthcare policy is thus a welcome development, for it is critical that Russia act decisively and systematically to complete the healthcare reforms begun over a decade ago. This paper examines the problems associated with the half-reformed state of Russia’s public healthcare system before considering the steps that must be taken to bring the reform to completion. It begins by placing healthcare reform in its larger policy and institutional context, before proceeding to outline the structural imbalances and incentive problems that affect the system, largely as a result of the incomplete reforms of the early 1990s. This is followed by an analysis of the steps that need to be taken to address these problems.
The context of healthcare reform
Healthcare reform must be addressed in the larger context of Russia’s health and mortality crisis
2. Russia continues to struggle with a health and mortality crisis. The deterioration in basic indicators of health and human welfare that began in the Soviet period and accelerated after the Soviet collapse has yet to be overcome. Recent economic growth seems to have had little impact on key indicators of human welfare (Table 1). Life expectancy at birth has failed to recover, having fallen sharply (mainly for men) in the 1990s. Mortality rates have fallen only slightly and remain at levels unseen for decades. The share of deaths induced by infectious diseases, which are traditionally related to living standards, is also high for a country at Russia’s level of development, and the incidence of tuberculosis and other “poverty-related illnesses” remains high, although viral hepatitis infection rates have fallen. This is not to suggest that there has been no improvement in recent years: while life expectancy overall has not yet risen much from the lows of the 1990s, there has been a significant rise in the average life expectancy of persons diagnosed with chronic illnesses over the last five years. This suggests that the economic recovery and rising healthcare expenditure are having a positive impact on healthcare provision. Nevertheless, the overall picture remains extremely grim.
1. The author works in the Country Studies Branch of the OECD Economics Department. This paper draws
on material originally prepared for the OECD Economic Survey of the Russian Federation, which was
Table 1. Selected health and demographic indicators
1990 1995 2000 2001 2002 2003 2004
Life expectancy at birth (years) 69.2 64.5 65.4 65.2 65.0 64.9 65.2
• Men 63.7 58.1 59.1 58.9 58.7 58.6 58.9
• Women 74.3 71.6 72.3 72.2 71.9 71.9 72.3
Death rate (/1000) 11.2 15.0 15.3 15.6 16.2 16.4 16.0
Death from circulatory diseases
(/100 000) 137.1 225.0 205.0 211.2 227.9 246.7 249.6
Death from respiratory diseases
(/100 000) 18.9 38.7 35.4 35.5 39.2 42.2 40.8
Death from diseases of the
digestive tract (/100 000) 15.4 35.7 31.8 35.3 40.0 45.9 49.0
Death from infectious and parasitic
disease (/100 000) 11.5 25.0 31.2 30.5 32.0 32.8 33.0
Deaths from alcohol poisoning
(/100 000) 15.6 41.6 34.0 36.4 39.5 40.5 38.5
Suicides (/100 000) 33.9 56.4 49.8 50.2 47.9 44.5 42.4
Murders (/100 000) 21.4 44.4 38.0 39.0 40.2 37.9 35.6
Tuberculosis cases (/100 000) 34.2 57.8 89.8 87.8 85.5 82.7 83.3
Hepatitis cases (/100 000) 226.7 166.8 163.3 181.4 123.2 97.7 99.1
Note: Data on death rates by cause of death are for the working-age population only.
Source: Federal Service for State Statistics.
3. One of Russia’s biggest problems is that it is not only average life expectancy that is exceptionally low for a country at its level of development – healthy life expectancy is very low as well (Figure 1). Russians above the age of 40 are far less likely to be healthy than citizens of Western or Central Europe, and the gap is particularly large for Russian women: their average life expectancy at any given age is higher than that of Russian men, but they also tend to spend much more of their lives in ill health.2
Figure 1. Life expectancy and healthy life expectancy at different ages
The Russian Federation (RF) and Western Europe (WE), 2002
A. Men Age 60 Age 40 Age 20 0 20 40 60 80
RF WE RF WE RF WE
Li fe ex pec ta nc y (y ears rem ai ni
ng) Healthy Unhealthy
B. Women Age 60 Age 40 Age 20 0 20 40 60 80
RF WE RF WE RF WE
Li fe ex pec ta nc y (y ears rem ai ni
ng) Healthy Unhealthy
[image:8.595.69.496.503.722.2]
Source: Andreev et al. (2003).
4. Poor health and high levels of preventable, premature death entail enormous human and economic costs. They also pose a threat to economic development as a result of both their long-term impact on secular trends in labour supply and their more immediate economic costs, which include productivity losses, reductions in household income and early exit from the labour force. Moreover, the impact of the health crisis is socially regressive: both the likelihood of chronic illness and the probability that illness leads to early retirement are negatively correlated with income.3 This points to the need for a broad-based effort to tackle Russia’s health and mortality crisis, a central part of which must involve a reform of the healthcare system itself.
5. Few would argue that the roots of this crisis are entirely, or even primarily, to be found in the state of the healthcare system. Indeed, some studies find little evidence of a link between health and mortality outcomes and access to healthcare in Russia.4 High levels of mortality and morbidity reflect
many other factors, including environmental degradation, unhealthy diets and high levels of tobacco and alcohol consumption (particularly among men), high levels of traffic-related fatalities and a sharp rise in murders and suicides.5 Nevertheless, the evidence suggests that access to quality medical care has declined for much of the population since 1990 and that this aggravates Russia’s health problems. Thus, while this paper focuses on the reform of the healthcare system itself – i.e. on the delivery of medical services to the population – it should be emphasised that reform of the healthcare system will be insufficient to tackle Russia’s health and mortality crisis. Healthcare reform must be undertaken as part of a broader programme of health reform, involving a range of policies that extend far beyond the bounds of healthcare delivery, encompassing such issues as: reform of the public health system,6 greater emphasis on health education
and promotion, increased efforts to combat the spread of HIV/AIDS,7 more effective environmental
protection, and steps to reduce Russia’s exceptionally high road-death rates.8 While these problems are
beyond the scope of this paper, it is important to recognise that the success of healthcare reform will depend to a significant extent on the success of other measures aimed at improving health and mortality outcomes, particularly those aimed at changing lifestyles.
6. At present, Russia spends a lower share of GDP on healthcare than most OECD countries (Figure 2), although its health expenditure-to-GDP ratio is fairly typical for a middle-income country.9 In contrast
to many OECD countries, cost-control problems are not (yet) at the centre of the reform debate. Indeed, Russia probably needs to spend more on healthcare than it currently does, and the major long-term drivers
3. On Russia, see World Bank (2005a); Suhrcke (2005). With respect to the impact of epidemic diseases on
economic performance, see Bell and Gersbach (2004).
4. Brainerd and Cutler (2005).
5. For a detailed recent analysis of Russia’s mortality crisis and possible solutions, see World Bank (2005a). On the economic and human costs, see also Suhrcke (2005).
6. The public health (san-epid) system inherited from the Soviet era has decayed substantially since 1990, as a result of under-funding and fragmentation, but there is still much here on which to build in creating a modern public health system (Tragakesand Lessof, 2003).
7. HIV/AIDS is not by any means among the leading causes of high mortality at present, but Russia is now
experiencing one of the fastest-growing HIV/AIDS epidemics in the world. The long-term consequences of failing to address this issue speedily are potentially catastrophic; see UNDP (2004).
8. ECMT (2006) finds that Russia has the highest road-death rate in Europe.
9. In 2002, Russia ranked slightly below the median among CIS countries in terms of public health spending
of healthcare spending – rising incomes,10 technological change and demographic change – all point to a
significant long-term rise in healthcare expenditure. The impact of demography will be particularly important. The Russian population is ageing fast: the proportion of the population above the age of 60 is projected to rise from 17% in 2005 to 31% by 2050.11 Since healthcare spending per capita on pensioners
(women over 55 and men over 60) is typically estimated to be roughly triple the level for working-age adults and double the level for children,12 the system will come under enormous pressure as the population
ages unless the healthy life expectancy (HLE) of Russians increases. Russian women, in particular, tend to suffer much more ill health than either Russian men or western women, and the gap increases with age.13
[image:10.595.103.486.262.502.2]This is one reason why the success of reform of the healthcare system will depend on broader initiatives aimed at improving Russians’ health. Unless healthy life expectancy increases, the system risks becoming overburdened by a rapidly ageing, increasingly ill population.
Figure 2. Health care spending
As a percentage of GDP
2510
441
1496
0 2 4 6 8 10 12
Russian Federation, 2004 WHO European Region European Union, 2003
%
Public Private
Note: The figures above columns represent per capita healthcare spending, US$ PPP.
Source: WHO, Federal Service for State Statistics, OECD calculations.
7. At the same time, it is clear that Russian healthcare expenditure is poorly allocated and inefficiently administered. There is an urgent need to alter the structure of healthcare spending, while simultaneously enhancing efficiency. The authorities are committed to increasing healthcare expenditure
10. In both OECD and emerging market economies, healthcare expenditure exhibits a tendency to rise faster
than real GDP.
11. Russia’s population is greying rapidly despite low levels of life expectancy at birth (LEB): this is because the fall in LEB reflects elevated mortality rates in all decades of life; as Russians grow older, the gap between Russian and western levels of life expectancy falls.
12. These estimates are based on insurance company figures on expenditures via the system of mandatory
medical insurance. Comprehensive data on the breakdown of all public healthcare spending by age group are not available.
13. Although female LEB exceeded male LEB in Russia by 13.2 years in 2003, Andreev et al. (2003) estimate
substantially over the medium term, but rising expenditure in the absence of reform may not deliver higher quality or wider access to the population – it could simply create quasi-rents for healthcare providers.14 It is
therefore critical that increasing healthcare expenditure be accompanied by both structural reforms designed to improve the efficiency and effectiveness of the healthcare system itself and by a broader programme of health reform.
The Russian healthcare system today is the product of an unfinished reform
8. The Soviet healthcare system was centralised, integrated, hierarchically organised and wholly financed from general government revenues. Healthcare services were (in principle, at least) provided free to all citizens, and all health personnel were state employees. The system placed enormous emphasis on the control of epidemics and infectious diseases. This contributed to the development of a large and effective public health (san-epid) network, but the determination to isolate infected persons also led to over-provision of hospital beds, which contributed over time to an imbalance in the overall structure of healthcare provision. On the whole, the Soviet system tended to neglect primary care, apart from public health, and to place too much emphasis on specialist and hospital care. Low prestige and poor pay reduced the quality of entrants into the primary-care sector and also encouraged the de facto privatisation of services via moonlighting or the levying of informal charges for supposedly free services. Despite these weaknesses, this integrated “Semashko model” achieved considerable success during the Soviet period in dealing with infectious diseases such as tuberculosis, typhoid fever and typhus. However, it tended to neglect non-communicable diseases and proved ill equipped to deal with the demographic and epidemiological shifts of the post-war period, which witnessed a steady rise in chronic non-communicable diseases. Thus, during the 1960s and 1970s, the decades-long improvement in life expectancy and health indicators stalled and, in some cases, went into reverse.15 Moreover, by 1991, many of the strengths of the
Semashko model had been eroded as a result of underinvestment in general and declining resources for prevention in particular. Despite a doubling in the number of hospital beds and doctors per capita between 1950 and 1980, the quality of care was in decline by the early 1980s (Schroeder and Denton, 1982).
9. Faced with these problems, the Russian authorities opted in the early 1990s to make the transition to an insurance-based system. Their aim was to preserve the established principle of free provision – Article 41 of the 1993 constitution confirms a citizen’s right to healthcare and medical assistance free of charge – while restructuring the system to make it more efficient and more responsive to actual needs.16
The first law on medical insurance in the Russian Federation was adopted in 1991 and led to the creation of a Federal Fund for Mandatory Medical Insurance (FFOMS), as well as territorial funds in each of Russia’s constituent regions. The mandatory medical insurance (OMS) system was intended to promote both efficiency and patient choice by enabling patients to choose among competing medical insurance companies, which, in turn, would act as informed buyers of medical services.17 Thus, OMS funds would be
channelled to healthcare providers via (public or private) insurance companies which would have incentives both to work for better patient care (in order to attract clients) and to press providers for greater efficiency (to hold down costs). Healthcare providers would have to compete for the custom of insurers, who would contract with them to purchase healthcare services. The introduction of this purchaser–provider
14. Docteur and Oxley (2003) observe that the market failures typically associated with healthcare mean that
this risk is high.
15. For details, see Brainerd and Cutler (2005); also Wheatcroft (1999) and Feshbach and Friendly (1995).
16. Greater efficiency and greater flexibility in responding to changing needs were among the major reasons
for the decision to undertake a similar reform of health insurance in the Netherlands (Bertens and Bultman, 2003).
17. A number of OECD countries, including Germany, the Netherlands and Belgium, also allow competition
split was also expected to help facilitate the restructuring of care, as resources would migrate to where there was greatest demand, allowing for a reduction in excess capacity in the hospital sector and stimulating the development of primary care. Finally, it was intended that insurance contributions would supplement budget revenues and thus help to maintain adequate levels of healthcare funding. Unfortunately, none of this has worked out as planned. The resulting system is overly complex and very inefficient (Figure 3). It has little in common with the model envisaged by the reformers. This is chiefly a result of the failure to resolve problems with financing, competition and micro-level incentives.
10. Despite the intention of shifting to an insurance-based system, federal and regional budgets still administer about 60% of public healthcare expenditure. The remainder goes through the OMS system. OMS was initially financed chiefly via dedicated employers’ contributions to regional OMS funds, a system that led to considerable differences in the level of OMS income across regions and failed to generate sufficient revenues to finance the system’s commitments. After the introduction of the unified social tax (ESN) in 2001, the OMS system received ESN revenues equal to a 3.6% rate of payroll tax – 3.4% to regional OMS funds and 0.2% to the FFOMS. This left the system as a whole under-financed and left the FFOMS without significant resources to help equalise healthcare finance across regions. Inter-regional disparities could only be addressed via the various regional-support programmes operating under the federal budget. However, inter-budgetary transfers went to regional budgets, not regional OMS funds, and most regions chose not to transfer them to the OMS system. Indeed, since the transfers were not earmarked for healthcare, these funds were often directed to other purposes. When the ESN was cut in 2005, OMS income from the tax fell to the equivalent of a 2.8% payroll tax rate – 2.0% to the regional funds and 0.8% to the FFOMS. The cut in income, amounting to an estimated RUB 16.0bn in 2005,18 thus
coincided with some recentralisation of OMS resources, but its main impact was to reinforce the role of the budget in direct healthcare finance. As will be seen below, the combination of budgetary and OMS financial channels presents healthcare providers with conflicting incentives.
Figure 3. Financing public healthcare in the Russian Federation, 2005
Subsidies
Formal and informal payments Unified social
tax (2%)
Unified social tax (0.8%) Ot he r t ax es
Contributions for non-working population
Allocation of funds on per capita basis
Healthcare delivery Subsidies
Contracts for insurance of working population Di rec t budget ary f inanc ing of heal th ca re prov iders Contracts for insuring the non-working population
Payments for healthcare delivery
Federal budget Regional budget
Regional authorities
Federal OMS Fund Regional OMS
Funds Insurers Employers Health care providers Population
Source: Adapted from Shishkin (2006).
11. Nor did the OMS system emerge as an additional source of healthcare finance. Instead of supplementing budget revenues, OMS contributions largely offset the impact of reductions in budgetary spending on healthcare. Healthcare spending fell in both absolute terms and as a share of regional budgetary expenditure.19 In the circumstances, a contraction of funding in absolute terms was probably
inevitable, as all public budgets were under severe strain in the 1990s, but it is likely that the reduction in the healthcare share of budgetary expenditure reflected the authorities’ awareness that the OMS system had created a cushion for offsetting cuts in healthcare spending. Nevertheless, public health expenditure held up better than social spending in other fields during the 1990s, thanks chiefly to OMS revenues.20
12. In most regions, the OMS system is characterised by a lack of competition. Although there are more than 300 private insurers and numerous public ones in the market, real competition for patients is rare. In principle, individuals have the right to choose their insurers, but this right is difficult to exercise in
19. It fell from around 15% in 1995 to just under 12% in 2001 before recovering to 13–14% (Rosstat, 2006).
20. At its lowest point, healthcare spending was down about one-third from 1991 levels in real terms, whereas
practice even where competing insurers are present. This leaves most patients with little or no effective choice of insurer – and, in many places, no choice of healthcare provider either.21 As a rule, it is not the
individual who chooses the insurer in any case; his employer does so. Thus, where real competition among insurers exists, it is often competition for employers, not patients, and many managers are motivated by concerns other than the quality of care procured for their employees. Employers frequently opt for “pocket” insurance companies, which they control. There are also reports of corruption in the selection process, with competition taking the form of “competing” kickbacks to managers.
13. The insurance companies themselves have failed to develop as active, informed purchasers of healthcare services. Most are passive intermediaries, making money by simply channelling funds from regional OMS funds to healthcare providers, for which they are allowed to claim reimbursement of administration costs; in 2004, these costs averaged around 3.1% of the payments processed. In the event of overspending on healthcare for their clients, insurers are generally reimbursed by regional OMS funds, so they have little incentive to plan for anticipated care volumes or organise the purchase of care efficiently.22
In short, health insurers are not risk-bearers, which raises questions about their entire raison d’être. These problems are not unique to Russia. World Bank (2005b) observes that insurers have tended to play a passive role in reformed healthcare systems in Central Europe and the Baltic States, and OECD (2005a) draws attention to the passivity of private health insurers even in the OECD area. As will be seen, the reasons for this passivity are much the same across the region: a combination of weak incentives for insurers, provider resistance to the introduction of a new source of influence over healthcare decision-making, and regulatory restrictions intended to serve equity goals or other social policy aims.
14. While insurers do sometimes act to uphold patients’ rights ex post when patient–provider conflicts arise,23 they have neither the incentives nor the capacities to press actively for better-quality
provision or greater efficiency ex ante. In some regions, branches of the regional OMS funds themselves perform the role of insurer. Many regional authorities long opposed the involvement of private insurers in the OMS system: as late as 2004, 19 regions still relied entirely on regional OMS funds to perform this role, as against only 47 in which insurance companies were the only OMS insurers – the insurers and the territorial OMS funds shared this role in the remaining 23.24
15. The impact of healthcare reform has varied widely across the country, because regional and local authorities have a very important role in healthcare policy. The vast majority of public healthcare institutions are owned and operated by municipalities (Table 2).25 The federal level consists primarily of
specialised institutions subordinated directly to the Ministry of Health and Social Development and the parallel healthcare systems still operated separately by some federal ministries and departments, the most important being that of the Ministry of Defence.26 While the regions control only a small proportion of
21. Of course, there is no link, in principle, between choice of insurer and choice of primary care provider.
However, in many places, choice of the latter is either very limited or determined via the insurer.
22. See Bertens and Bultman (2003) on similar inefficiencies that arose in the Netherlands owing to
reimbursement of sickness funds’ expenses from a single central fund.
23. The FFOMS estimates that around 70% of such conflicts are resolved in favour of the patient.
24. IISP (2005).
25. Although private provision has been developing in Russia since 1991, the healthcare sector is still
overwhelmingly public. Non-state healthcare providers in 2004 accounted for just 0.6% of hospital beds, 2.7% of outpatient capacity and 6.2% of healthcare employment (Rosstat, 2006). These data include staff of church-affiliated and other non-state, non-commercial organisations.
medical institutions, these are typically the most important establishments in the area, and the regions’ power over municipal budgets ensures that they play a key role in overseeing municipal clinics and hospitals. Moreover, nearly all healthcare expenditure that is channelled through the OMS system is administered by regional OMS funds; the FFOMS spends very little of it directly.
Table 2. Structure of healthcare provision by level of government, 2004
% of total
Federal Regional Municipal
Physicians in outpatient clinics 2.5 35.4 62.1
Hospitals 2.6 19.8 77.6
Hospital beds 4.7 30.6 64.7
Physicians in hospitals 5.6 26.2 68.2
Inpatient facilities
Outpatient clinics
Outpatient care
1.5 17.3 81.2
Source: RF Ministry of Health and Social Development.
16. The regions are thus key players in healthcare provision. While this allows for experimentation and adaptation of systems to local conditions, it makes for a certain fragmentation of regulatory practices and also gives rise to considerable inter-regional inequalities. If healthcare expenditures are deflated by regional consumer price indexes, there is an eight-fold difference between the highest- and lowest-spending regions. In view of the guarantee set out in Article 41 of the Constitution, these inter-regional differences raise constitutional as well as efficiency issues. In some areas, to be sure, regional experimentation could yield valuable results: as will be seen, regions are already exploring a wide variety of approaches to policy-making, management and financing, and the best practices of the most innovative regions are beginning to spread. However, it is important to ensure that the system remains a coherent whole, in the interests of both equity and efficiency.
The need for healthcare reform
The semi-reformed state of the healthcare system aggravates its underlying structural imbalances
17. The Russian healthcare system today is characterised by a number of fundamental imbalances. The first is between commitments and resources. In principle, the constitutional right to medical care is given substance in a range of free services defined in the so-called Guaranteed Package Programme, administered jointly by the regions and the federal centre. Arrangements introduced in the late 1990s provide for the involvement of the federal and regional governments and OMS funds in planning provision and matching commitments to free healthcare with available resources. The Guaranteed Package Programme is also intended to facilitate a shift in provision away from inpatient care and towards greater outpatient care (see below). Under the programme, the federal government sets utilisation targets which define the minimum package of services for the regions and also serve as targets for this restructuring process. The regions are obliged to develop territorial programmes complying with the minimum norms set by the federal centre but may also include additional free services.
18. Similar guarantees have been adopted in many OECD countries in order to specify patients’ rights or protections within the healthcare system and to ensure access to a specific set of services.27
Docteur and Oxley (2003) note that such guarantees can provide incentives for those parties responsible for
27. For example, Sweden adopted a revised Guarantee for Medical Treatment in 1997, and Austria a patient’s
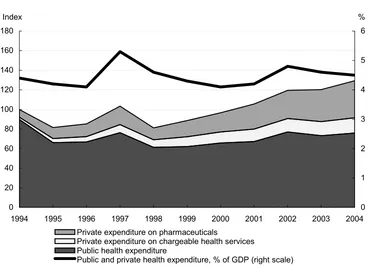
a patient’s rights to take appropriate action. However, the Russian package (Annex 5.1) is actually quite extensive for a country that spends a relatively low share of GDP on healthcare, and in practice, the available resources are insufficient to cover the guaranteed package. Households finance a good deal of medical care that is supposed to be free; the household share of total health expenditure has risen rapidly, roughly quadrupling in the decade to 2004 (Figure 4).28
19. Shishkin (2004) gives a lower-bound estimate of the cost of financing the full programme of state guarantees in 2002 at RUB 348.3bn (3.6% of GDP). The actual cost would probably have been somewhat higher. Yet total state expenditure in 2002 – including construction, equipment procurement and other activities not directly concerned with financing guaranteed services – amounted to just RUB 324bn. In 2004, financing of the state-guaranteed package reached an average level of 81.8% nation-wide, although this figure conceals significant regional variations.29 Only nine regions, accounting for 12.8% of the
population, achieved full financing of the guaranteed package.30 There are particularly severe shortfalls in
[image:16.595.113.482.352.620.2]the provision of high-tech medical procedures: the Ministry of Health and Social Development estimates that in 2005, the system covered around 10% of the demand for coronary angiography and heart-valve replacement, about 7% of the demand for joint replacements and roughly 35% of the demand for treatment of congenital heart defects.
Figure 4. Public and private health expenditure
0 20 40 60 80 100 120 140 160 180
1994 1995 1996 1997 1998 1999 2000 2001 2002 2003 2004
Index
0 1 2 3 4 5 6 %
Private expenditure on pharmaceuticals
Private expenditure on chargeable health services Public health expenditure
Public and private health expenditure, % of GDP (right scale)
Source: Federal Service for State Statistics; Shishkin (2006).
28. Not all household payments are “informal”. Healthcare institutions can offer paid medical services. This
should not extend to guaranteed services but it often does.
29. See IISP (2005); and Shishkin et al. (2005). A regional programme for state-guaranteed care is elaborated for each region, on the basis of an assessment of expected care needs.
30. Tyumen’, Rostov, Chuvashiya, Lipetsk, Novosibirsk, Jewish AO, Udmurtiya, KhMAO and Sverdlovsk. A
20. As will be seen, there is a need to revisit some of the guarantees themselves, but the gap between commitments and resources largely reflects the low level of public healthcare spending. This is a problem common to many transition economies: the gap between extensive guarantees and limited means has given rise to financial strains and significant informal payments for what are supposed to be free services in many Central European countries.31 Rosstat estimates that households spent RUB 53bn on medical services
in 2002, as against RUB 120bn on medicines. On the basis of survey data, Shishkin (2004) estimates that informal payments to providers added another RUB 22bn to the former figure.32 Whether formal or
informal, the increasing role of payments by households to state healthcare providers implies that access to the public healthcare system is becoming significantly more unequal, notwithstanding the provisions of Article 41 of the constitution.
21. The largest share of household spending on healthcare is devoted to pharmaceuticals, and the gap between commitments and resources is particularly stark when it comes to financing pharmaceuticals provision. Like almost all OECD countries, Russia tries to hold down rising pharmaceutical costs via a combination of cost-sharing and regulation. Drugs are in theory provided to hospital patients free of charge, but outpatients must pay for them – an arrangement which creates incentives for unnecessary hospitalisation. In practice, however, informal cost-sharing is pervasive in the hospital sector: it is estimated that around 80% of inpatients still have to pay part of the cost of their medicines. Apart from a few centrally supplied drugs related to public health needs (e.g. insulin and vaccines), hospitals generally have to buy medicines on commercial terms from their budgets, which are limited. This, combined with ineffective enforcement of controls on wholesale and retail mark-ups, means that drugs available on the market are often unavailable to hospital patients unless they can pay.33 It is reckoned that a substantial
proportion of the demand for medicines in Russia simply goes unmet.34
22. The reliance on formal and informal cost-sharing with respect to pharmaceuticals provision underlies the unusually large household share in total healthcare expenditures in Russia, because pharmaceuticals themselves account for an exceptionally large share of Russian health expenditure. Household expenditure on drugs accounts for around 30% of total healthcare spending in Russia, as against an average of just under 12% in OECD countries. It is not clear what proportion of public health spending is devoted to pharmaceuticals in Russia, because such expenditure is channelled through multiple budgets and various levels of the OMS system, and comprehensive data are not available. However, the Ministry of Health estimated in 2002 that drugs and other medical supplies accounted for around 17–20% of total public health spending.35 If this proportion held in 2004, then total pharmaceutical spending in Russia
would have reached around 40% of all healthcare expenditure, as compared with an OECD average of 18%. This is not entirely surprising, since the pharmaceuticals share of health spending tends to be strongly negatively correlated with both per capita health spending and per capita GDP. In a country like Russia, this largely reflects heavy reliance on pharmaceuticals imports, which are expensive relative to locally
31. World Bank (2005b:117).
32. Shishkin also finds significant regional variations in the scale and structure of household healthcare
spending. Surveys yield widely varying estimates of the prevalence of household spending for medical care, though all find that it is relatively common, especially for outpatient and dental care; see Balabanova
et al. (2004), Feeley et al. (2001), Belyaeva (2001a and 2001b), IISP (2003) and Shishkin et al. (2004). See
also the Russian estimates yielded by the Russia Longitudinal Monitoring Survey, available at http://www.cpc.unc.edu/rlms/.
33. Wholesale mark-ups are limited to 25% of the manufacturer’s price and retail mark-ups to 30% of the
wholesale price, but actual mark-ups are often in the 120–200% range. See Tragakes and Lessof (2003).
34. Tragakes and Lessoff (2003).
35. Specifically, the ministry estimated that this item accounted for 20.3% of OMS spending, 28.9% of federal
supplied goods and services.36 The high share of spending on pharmaceuticals may also reflect an
ingrained cultural expectation, left over from the Soviet period, that any consultation with a physician will result in a prescription.37
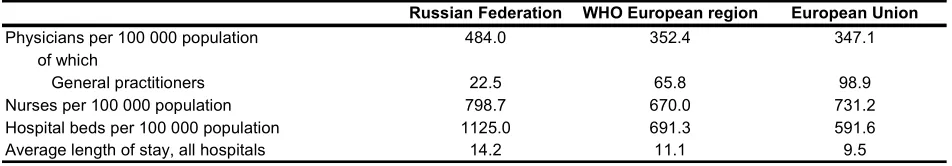
23. The second major imbalance is between thestructure of provision and health needs. The Russian healthcare system still reflects the tendency of the Semashko model to rely too much on specialist treatment and hospitalisation. Hospital stays are too common and too long, on average, and primary care remains seriously under-developed, both quantitatively and qualitatively (Table 3). While there has been some evolution away from this approach, progress has been slow: Starodubov (2005) reports that the share of healthcare expenditure devoted to in-patient services fell by only two percentage points over the preceding decade, and Russia still spends about twice as much on stationary care as on outpatient services, compared with the roughly equal shares typically found in OECD countries.38 Only about 30% of Russian
[image:18.595.59.535.398.481.2]physicians work in outpatient care settings, and roughly 60% of these are specialists. While some of these specialists are paediatricians in what might effectively be described as family practice, the bulk of the burden of primary care falls on the 12% of physicians who work in district polyclinics. Historically, moreover, primary care has been the least prestigious and least remunerated field of medicine, and the reputation of ordinary primary care physicians – terapevty, in Russian parlance – is low in the eyes of both the profession and the population. The government has tried to rectify this by training physicians for two new specialisms – general practitioner (GP) and family practitioner39 – but few have yet been trained. Many physicians insist that the GPs’ training is inadequate, and the population still tends to confuse them with terapevty.
Table 3. Indicators of resource use in the health sector, 2004
Physicians per 100 000 population of which
General practitioners Nurses per 100 000 population Hospital beds per 100 000 population Average length of stay, all hospitals
Russian Federation WHO European region European Union
1125.0
14.2 11.1
691.3 65.8 352.4
798.7 670.0
484.0
22.5
731.2 591.6 9.5 347.1
98.9
Source: Federal Service for State Statistics, WHO; European Union data on physician numbers are for 2003.
36. Indeed, the low price elasticity of demand for medicines contributed to a sharp jump in real household
spending on pharmaceuticals after the 1998 rouble devaluation, even as real incomes fell sharply. While Russia’s pharmaceutical industry has recovered somewhat from the output collapse of the 1990s, the country’s revealed comparative disadvantage in medicines and pharmaceutical products has grown somewhat since 1998.
37. Tragakes and Lessof (2003); Karnitski (1997); Hovhannisyan et al. (2001).
38. World Bank (2004) reports that 64% of healthcare spending in Russia in 2001 was devoted to inpatient
care. See also OECD (2005b:73). The average OECD member state devoted 31% of healthcare spending to inpatient care and 34% to outpatient, with the balance being devoted to medical goods, collective services and other items. However, it is important to note that the OECD figures for inpatient care exclude most long-term care for the elderly and disabled. Including this would raise the OECD average to about 37% of spending. There are, moreover, wide divergences among OECD systems in the inpatient/outpatient balance.
39. Whereas in international terminology, the terms “general practitioner” and “family practitioner” are
synonymous, they refer to distinct groups in Russia. A general practitioner (GP) covers all specialties for adults except gynaecology. He/she does not cover paediatrics either. A family practitioner, by contrast, is effectively a GP who is also qualified to cover gynaecology and paediatrics. As a result, GPs are often
confused with terapevty in the public mind. The Ministry of Health and Social Development favours
24. The potential benefits of a stronger primary care system are considerable, particularly when it comes to prevention and early diagnosis. WHO (2004) draws attention to the growing body of empirical work suggesting that greater emphasis on primary services is associated with better health outcomes, higher patient satisfaction, reduced expenditure and greater equity/access, particularly in middle- and lower-income countries.40 Weakness at the primary care level results in over-referral of patients to
specialists. In Russia, an estimated 35% of primary care consultations result in specialist referrals, around 5–10 times the rate typical of OECD countries. Patients often press actively for referrals, because they have no faith in their local district polyclinics, while terapevty and other primary care staff tend to over-refer owing to the weaknesses in their own training and, in many cases, the incentives for over-over-referral that some remuneration schemes create (see below). Moreover, the 35% referral rate actually understates the extent of reliance on specialist treatment, since ordinary Russians often bypass primary care providers altogether and approach specialists directly.
25. Yet while there is clearly a need to shift resources away from tertiary, and towards primary, care, healthcare restructuring is not primarily about bed closures, and bed closures can only follow provision of alternative, more appropriate services, medical facilities and forms of social support. This is particularly true of any attempt to reduce over-hospitalisation. Many patients, particularly elderly patients, are hospitalised for long periods simply because they cannot manage alone and there are no alternative care arrangements available. This highlights the need to address the problem of long-term care in conjunction with the restructuring of the healthcare sector.41 The government’s medium-term reform programme recognises this need, anticipating a significant, albeit gradual, increase in the number of non-hospital long-term care beds available. Starodubov (2005) points out that Russia’s size and sometimes poor transportation networks mean that closures in rural areas and small towns must be managed carefully, if access to care for their populations is not to be compromised. He notes a tendency in some regions to “rationalise” bed provision at the expense of such areas.
26. Not surprisingly, given the above, there is also a substantial gap between expectations and outcomes. This is reflected in survey data showing that 60–70% of Russians are dissatisfied with their country’s healthcare system. Only 11–13% express satisfaction with it, although just over a quarter express confidence that they can get good-quality medical care for themselves and their families. The latter figure suggests that a significant minority of the population believe that they can secure what they need from the system despite its defects. Retrospective evaluations are more positive still: of those who state that they have recently undergone some sort of medical treatment, roughly half report having found it satisfactory. Unfortunately, around half also declared it unsatisfactory.42
27. The above-listed problems notwithstanding, Russia’s healthcare reforms have brought some benefits. First, as noted above, the OMS system helped to maintain healthcare spending levels in the 1990s, even if OMS contributions did end up replacing, rather than supplementing, budgetary funds. Secondly, the creation of OMS marked the first steps towards a purchaser–provider separation, which, in turn, has helped to make funding less dependent on supplier interests and to focus greater attention on questions of cost and efficiency. It has also spurred the development of clinical protocols and medical-economic standards similar to those adopted in some OECD countries in an effort to increase healthcare providers’ accountability for healthcare quality (Docteur and Oxley, 2003). In a small but growing number of regions, such standards are also being used in an effort to devise more rational tariff structures and methods of payment. Nevertheless, healthcare reform could hardly be called a major success. The unfinished transition
40. In some cases, however, such an emphasis can raise costs by exposing previously unmet needs.
41. According to WHO data, Russia has one of the lowest ratios of nursing and elderly care home beds per
head of population in the European region.
to insurance-based medicine has left the country with an exceptionally complex system of mandatory medical insurance that has achieved few of the reformers’ aims and that, despite its name, actually has relatively little in common with a system of medical insurance.
28. This unfinished OMS reform also constitutes one of the reasons for the very limited shift in the structure of provision. The reformers of the early 1990s focused their attention on the reform of healthcare finance, believing that if financial arrangements were properly restructured, then financial pressures would bring about the kind of broader restructuring of provision that the sector needed. In the event, reform of healthcare finance stalled, and the basic structure of the system remained largely unchanged as a result. This affects not only the provision of current services but also patterns of investment in the sector. Current financing arrangements do little to ensure that capital investment in the sector will be directed towards areas of greatest anticipated need, rather than being use to replace/perpetuate existing facilities and structures. This is a critical issue, given that the healthcare sector’s fixed assets are generally very old.43
Healthcare providers and insurers face perverse micro-level incentives
29. The half-finished transition to an insurance-based system has left healthcare providers facing a confused system of financing. Direct budgetary expenditure still plays the dominant role in healthcare finance. In 2004, only about 40% of public healthcare spending was executed through the OMS system, although this figure varied widely from region to region. In Komi and Tuva, OMS expenditures in 2004 covered just 16% of public healthcare spending, as against a high of 95% in Samara, the only region in which the OMS share exceeded two-thirds.44 The authorities aim to raise the nationwide figure to 60% by 2008. At present, the OMS system in most regions tends to reimburse healthcare providers’ expenditures on salary, pharmaceuticals, disposables and food for inpatients. The fixed costs of regional and municipal public healthcare facilities are generally covered by regional and municipal budgets, as are services related to severe conditions, such as cancer, and emergency care.
30. While it was never intended that the budget should altogether cease to play a role in healthcare finance, the current mix presents providers with contradictory incentives. The problem is not so much with the sources of financing as with the methods used to allocate it. Most budget financing is still input-based – it is allocated to facilities and institutions, based largely on size and staffing, with little reference to volumes of care actually provided or forward-looking assessments of need. The OMS portion of providers’ income is insufficient to create incentives to focus on outcomes. For example, restructuring an institution in order to better meet patient demand (as reflected in OMS income) can result in a loss of budgetary income (which may be based on staffing ratios, bed numbers, etc). The incentives to resist the restructuring of capacities may also be reinforced by the fact that OMS tariffs for specific services in around three-quarters of regions are partly dependent on the status of the institution, rather than the nature of the procedure.
31. One reason for the limited share of OMS revenues in total public health spending has been the chronic under-financing in many regions of OMS for the non-working population, who are not covered by payroll taxes. This is a major problem: only a little over 40% of insured persons are working, and many of these under-contribute, owing to “grey schemes” for paying wages and salaries. However, regional budget transfers to cover OMS contributions for non-working people sometimes amount to less than 5% of regional OMS funding. In 2002, 24 regions allocated only about RUB 100 per person ($ 3.19 at the average exchange rate for the year) in premia for the non-working population; a further 19 regions spent
43. The Ministry of Health and Social Development estimates that the fixed assets of the healthcare sector
were over 58% amortised by end-2004. Amortisation rates for the sector’s machinery and equipment had reached 62–64%.
between RUB 100 and RUB 200.45 Such under-funding can create particular problems in poorer regions,
since the issue of contributions for the non-working population is more acute in regions of high unemployment and/or high fertility.46
32. In an effort to address shortfalls with respect to the elderly population, the Pension Fund of the Russian Federation (PFRF) in 2003 began to participate in the financing of OMS coverage for pensioners in around a dozen regions. This number grew to 32 in 2004. The PFRF insisted on the maintenance of personal accounts for the pensioners so insured and on the use of specific payment methods to facilitate the monitoring of expenditure and ensure that PFRF funds introduced into the system were not diverted to other purposes. While the PFRF programme has not been formally wound up, it cannot be a complete or permanent solution to the problem, especially given that the pension fund itself faces funding problems over the coming years. Under arrangements put in place in 2005, the regions are now responsible for making contributions to the OMS system on behalf of the non-working population, but they receive subventions from the federal budget and the FFOMS to help pay OMS contributions for children, and the PFRF is – for the time being, at least – still involved in helping to finance healthcare for pensioners.47
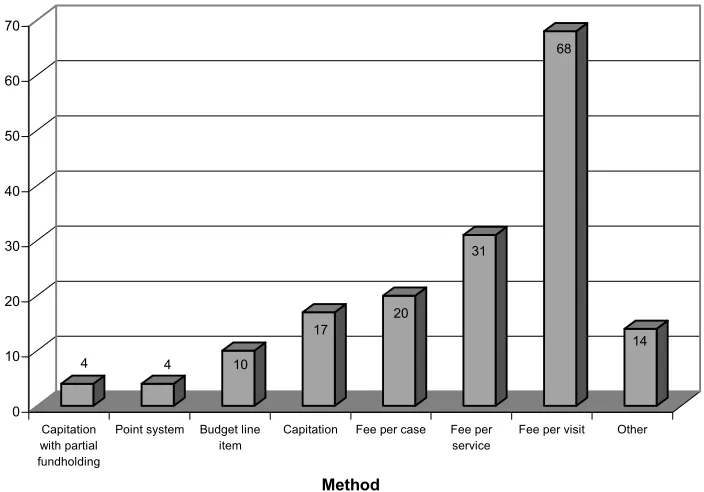
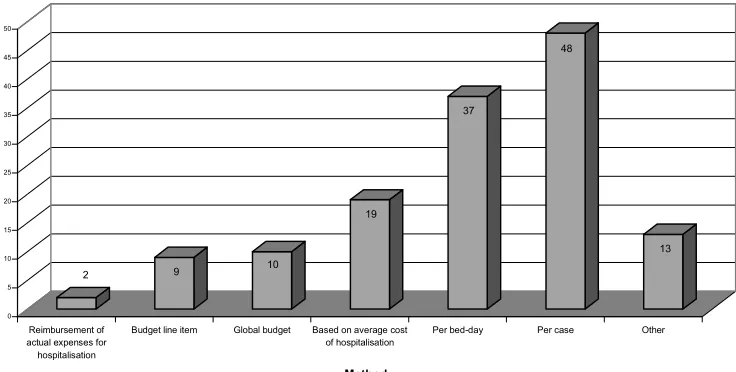
33. The mixed incentives generated by the combination of budgetary and OMS-based financing are compounded by the variety of formulae used to calculate payments to healthcare providers. Diversity is not, in itself, a problem. No single formula is likely to be appropriate for all forms of medical care. However, some widely used forms of payment generate perverse incentives for healthcare providers. At present no fewer than seven forms of payment are used for outpatient care (Figure 5). These include: financing of budgeted costs by line item, pay per visit, pay per service, pay per case, capitation fees based on assignment of patients, capitation with fundholding, and a points system similar to the Uniform Value Scale used in Germany. Six methods are used to pay for in-patient care (Figure 6): financing of line-item budgets, financing of global budgets, pay per bed-day, pay based on the average cost of treating one ill person, pay per case completed, pay for agreed volumes of care, and reimbursement of actual expenditures. Reliance on line-item budgets, global budgets and actual reimbursement of expenditures often eliminates incentives to economise. The challenge is to shift to forms of payment that align incentives to promote effectiveness and efficiency objectives.48
34. While matters are improving gradually, fee per outpatient visit is still widely used, as is pay per bed-day in the hospital sector. Both forms of payment tend to incentivise over-treatment, and the former minimises any incentive for primary care providers to focus on prevention.49 At the opposite end of the
45. Taranov (2005) notes that this figure in 2004 was as low as 1.4% in one region, which implies a more or
less total failure to provide for insurance of non-working people.
46. It does not help that the informal share of wages and salaries is often greater in such regions, so OMS
contributions for the working population are frequently depressed as well.
47. In 2005, the federal authorities provided RUB 6bn for children’s OMS contributions, divided roughly
equally between the federal budget and the FFOMS. The regions spent about RUB 13.0bn on contributions for the non-working population, and the PFRF provided around RUB 10.0bn for pensioners (Taranov, 2005:12). However, the extent of the PFRF’s future involvement is unclear: no formal decision has been taken to wind up the experiment launched in 2003, but it is hard to see how it can continue indefinitely given the PFRF’s financial position and the undesirability of financing healthcare from pensions funding on a permanent basis.
48. Docteur and Oxley (2003) treat “effectiveness” as concerned with health system performance, without
regard to cost. Effectiveness reforms may be cost-increasing, -neutral or -decreasing. “Efficiency” refers to the relationship between cost and outcome: efficiency reforms aim at better outcomes for any given amount of healthcare spending.
49. It should be noted that most other widely employed methods of paying for primary care also limit the
spectrum, many healthcare workers in outpatient settings have little or no incentive to treat patients at all, since they are employed on fixed salaries and subject to little monitoring of outcomes. As a result, they tend to over-refer patients to more expensive specialist outpatient clinics and/or hospitals – which is often what patients want anyway. In 2004, only four regions employed an element of fundholding in respect of primary care providers.50 In the hospital sector, only ten regions employed cost-and-volume contracts
based on anticipated care needs.
[image:22.595.126.478.342.588.2]35. The problem here is not a lack of awareness of incentive problems but a lack of administrative capacity: regions tend to adhere to forms of payment that are easier to monitor and administer. For the same reason, the PFRF insisted on personalised accounts and fee-per-visit arrangements in financing its additional support for pensioners: the Fund was concerned above all to ensure that the money it contributed was spent on treating its clients. At times, therefore, there are trade-offs between transparency and efficiency, a fact which highlights the extent to which the authorities’ healthcare reform options might be broadened by a successful administrative reform.
Figure 5. Methods of paying for outpatient care through regional OMS funds, 2004
4 4 10
17
20
31
68
14
0 10 20 30 40 50 60 70
N
u
mber of regions
employing
Capitation with partial fundholding
Point system Budget line
item
Capitation Fee per case Fee per
service
Fee per visit Other
Method
Note: Different methods may be used for different providers in the same region.
Source: IISP (2005).
sending patients home on weekends/holidays without formally discharging them – i.e. while recording them officially as being in hospital.
Figure 6. Methods of paying for inpatient care through regional OMS funds, 2004
2 9 10
19 37 48 13 0 5 10 15 20 25 30 35 40 45 50 N u m b er o f r eg io n s em p lo y in g Reimbursement of actual expenses for hospitalisation
Budget line item Global budget Based on average cost of hospitalisation
Per bed-day Per case Other
Method
Note: Different methods may be used for different providers in the same region.
Source: IISP (2005).
The direction of healthcare reform
The government has recently been stepping up its healthcare reform efforts
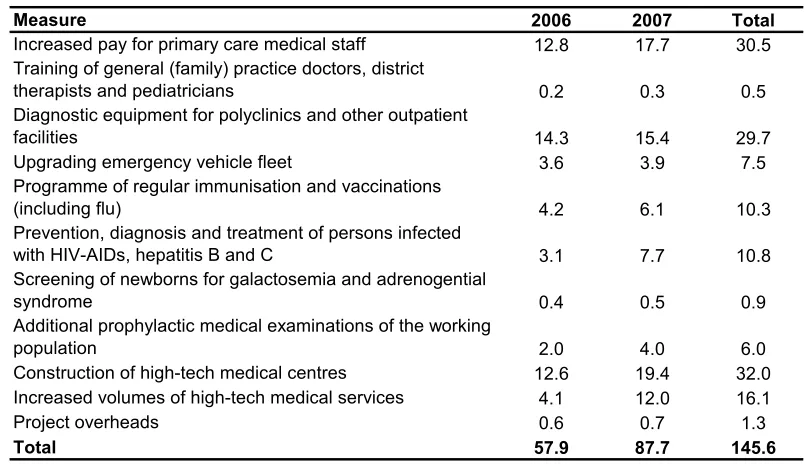
36. The government is not by any means unaware of the problems just described, and after a long hiatus, the authorities have recently begun trying to reinvigorate healthcare reform. In an effort to accelerate progress on some of the most urgent of its healthcare priorities, the government in late 2005 launched “Priority National Project ‘Health’”, which is intended to bring about a palpable improvement in the healthcare system during 2006–07. The health project is by far the largest of the four projects undertaken by the government this year. It will channel an additional RUB 208.9 from federal and regional budgets into healthcare during the course of 2006–07, the bulk of which will be spent on increased salaries for primary-care physicians, the creation of 15 new high-tech medical centres and expanded immunisation and disease-prevention efforts (Table 4). This represents a substantial increase in expenditure focused on a limited number of priorities and administered under a high degree of political direction. It should, therefore, have a positive impact on healthcare in Russia. The project also marks a long-overdue resumption of active policy-making in healthcare, following a period in which little was done.
Table 4. Priority National Project "Health"
Planned federal expenditure, RUB bn
Measure 2006 2007 Total
Increased pay for primary care medical staff 12.8 17.7 30.5
Training of general (family) practice doctors, district
therapists and pediatricians 0.2 0.3 0.5
Diagnostic equipment for polyclinics and other outpatient
facilities 14.3 15.4 29.7
Upgrading emergency vehicle fleet 3.6 3.9 7.5
Programme of regular immunisation and vaccinations
(including flu) 4.2 6.1 10.3
Prevention, diagnosis and treatment of persons infected
with HIV-AIDs, hepatitis B and C 3.1 7.7 10.8
Screening of newborns for galactosemia and adrenogential
syndrome 0.4 0.5 0.9
Additional prophylactic medical examinations of the working
population 2.0 4.0 6.0
Construction of high-tech medical centres 12.6 19.4 32.0
Increased volumes of high-tech medical services 4.1 12.0 16.1
Project overheads 0.6 0.7 1.3
Total 57.9 87.7 145.6
Note: Figures exclude project financing from regional budgets.
Source: Ministry of Health and Social Development.
38. That said, there remain a number of concerns about the design of the health project, not the least of which is its reliance on large spending increases that are in many cases not linked to reforms that address the underlying structural weaknesses of the healthcare system. While the project is meant to give renewed impetus to healthcare reform, it is far from clear that it will do so. Only limited steps towards greater efficiency or changed incentives are planned, and this must be regarded as a missed opportunity, since such reforms would be easier to implement in a context of rapidly increasing resources. Although the federal government has recently undertaken a number of experiments and pilot projects in cooperation with regional and municipal authorities in the field of healthcare reform, there has been no move to address the reform of the guaranteed package programme or the need for greater equity in access to healthcare. Moreover, the risk of large-scale corruption and waste must be regarded as high, given that over half of the expenditures envisaged involve centralised procurement of medicines, equipment, services and construction work. It is not entirely clear how the authorities intend to ensure efficient spending of the funds allocated for such purposes, although they are clearly aware of the challenge: the creation of a Council on the Implementation of National Priority Projects chaired by the President of the Russian Federation is indicative of a high-level determination to monitor the projects closely.
39. The mechanisms used to adjust salaries also raise problems. In principle, salary increases could have been introduced alongside changes in the way primary care medical staff were paid, and this was indeed what some policy-makers envisaged. In practice, however, the necessary changes were probably too complex to introduce quickly, and the authorities determined that salary increases should be implemented as a matter of urgency. Thus, the decision was taken to pay an additional RUB 10 000 per month to the pay of primary care physicians51 and an additional RUB 5 000 to nurses in primary care facilities from the beginning of 2006 – sums sufficient in many regions to triple or even quintuple their take-home pay. While regions have discretion to introduce changes to remuneration packages when implementing the pay hikes,
there is little evidence of their doing so.52 As a result, the large, flat increase in remuneration for primary
care staff risks distorting incentives throughout the medical system: early 2006 saw large numbers of specialists and hospital staff, who did not receive the additional increments, being reclassified as primary-care terapevty.53
The government has recently confirmed its healthcare reform priorities for the period to 2010
40. While many of the specific measures advanced as part of project “Health” are to be commended, it does little to foster the restructuring the system requires. This will remain to be undertaken over a longer period, outside the framework of the project. However, the federal government reaffirmed its commitment to this restructuring in November 2005, when it defined its major goals for healthcare policy to 2010. Among the most important of these are to:
• bring commitments to the population into line with available resources by reforming the guaranteed package mechanism and strengthening its legislative basis;
• make the OMS system genuinely insurance-based;
• shift the structure of provision away from specialist/hospital care and towards greater reliance on integrated primary care; and
• change the remuneration schemes employed in the sector in an effort to restructure providers’ incentives.
The challenges posed by these four priorities are examined in the sections that follow.
What can be done to balance commitments and resources?
41. While healthcare spending is expected to go on rising, both in absolute terms and relative to GDP, the balance between commitments and resources cannot be restored merely by increasing the latter. The guaranteed package itself will have to be re-examined. This will involve more than an assessment of what the Russian state can actually afford, although resource constraints will clearly be a critical factor. If the state guarantee is to have any meaning at all, the package must be transparent to both providers and patients, and must provide mechanisms for citizens to assert their rights if the commitments in the package are not met. Ensuring real accountability will require specifying not only what medical services are to be provided free of charge, but also by whom and in what setting. If the guarantee is to be effective, a patient’s package of guaranteed services should probably be financed from a single source, so as to avoid cost-shifting among different actors. Moreover, clarity about the precise nature of the guarantees should help reduce the incidence of informal payments: patients who are not aware of the benefits to which they are entitled are likely to be more susceptible to requests for additional payments.54 In the Slovak Republic,
which faced a similar problem, the government has established a special office under the auspices of Ministry of Health to which citizens can appeal if they believe they have been charged for service that
52. The subventions in question are transferred not to regional budgets but to regional OMS funds. These, in
turn, conclude separate agreements with healthcare providers who conclude additional contracts with their staff, covering the requirements for receiving the additional increments. In practice, these requirements seem to be minimal, so the incentives facing primary care staff have changed little.
53. See Vedomosti, 14 February 2006.