A Monthly Double-Blind Peer Reviewed Refereed Open Access International e-Journal - Included in the International Serial Directories. GE- International Journal of Management Research (GE-IJMR)
Website: www.aarf.asia. Email: editoraarf@gmail.com , editor@aarf.asia
Page 17
AN ANALYSIS ON PERFORMANCE OF WORKING CAPITAL
(A Comparative study of selected fertilizer units in Andhra Pradesh)
Dr.P.S.Ravindra,
Professor & H.O.D
Miracle School of Management, Miracle Educational Society Group of Institutions (Approved by AICTE, New Delhi &
Affiliated to JNT University, Kakinada) Miracle City, Bhogapuram, Vizianagaram
(Dist)-535216, Andhra Pradesh, India
Mr.Ch.Trinadha Rao,
Assistant Professor,
Miracle School of Management, Miracle Educational Society Group of Institutions (Approved by AICTE, New Delhi &
Affiliated to JNT University, Kakinada) Miracle City, Bhogapuram, Vizianagaram
(Dist)-535216, Andhra Pradesh, India
ABSTRACT
Indian Fertilizer Industry is one industry with immense scopes in future. India is primarily
agriculture oriented country and its economy is highly based on the agrarian produce the
agricultural sector and its other associated spheres provide employment to a large section at the
country’s population and share about 25% to the GDP. The Indian fertilizer industry is one of
the allied sectors of the agricultural sphere. India has emerged as the third largest producer of
nitrogenous fertilizers. The adoption of book to break five year plan has paved the way for self
sufficiency in the production of food grains. In recently production has gone up to an extent that
there is scope for the export at food reins. The surplus has been foliated by the way of chemical
fertilizers. The large scale use of chemical fertilizers has been instrumental in bringing about the
green revolution in India. Fertilizer plays the most important role in the development of
agricultural production and productivity of land. So the fertilizer industry is the key industry in
the development of Indian economy. In fertilizer industry working capital management is major
problem. This paper proposes to present the performance of working capital management in
fertilizer industry with specific reference to the Coromandel Fertilizer Limited (CFL) and
Nagarjuna Fertilizers Limited (NFL).
Keywords: Fertilizer Industry, Working Capital, Current Ratio, Liquid Ratio, Sales to working
A Monthly Double-Blind Peer Reviewed Refereed Open Access International e-Journal - Included in the International Serial Directories. GE- International Journal of Management Research (GE-IJMR)
Website: www.aarf.asia. Email: editoraarf@gmail.com , editor@aarf.asia
Page 18 1. INTRODUCTION:
Finance is regarded as the lifeblood of any business organization. The Financial
management deals with the process of procuring of financial resources and its judicious
utilization with a view to maximizing the shareholders wealth. Efficient management of every
business enterprise is largely dependent on the efficient management of its finance. Financial
management is managerial activity which is concerned with planning and controlling of the firm‟s financial resources. Most of the businesses fail as they are unable to meet their working
capital requirements. If the firm cannot maintain a satisfactory level of working capital, it is
likely to become insolvent.
Working capital is a financial metric which represents the amount of day to day operating
liquidity available to a business. Along with fixed assets such as plant and equipment, working
capital is considered a part of operating capital. Working capital is an important component of
the corporate finance because it directly affects the liquidity and profitability of the firm.
Working capital management is a sensitive area in the field of financial management. It
involves the decision of the amount and composition of current assets and the financing of these
assets. Current assets include all those assets that in normal course of business return to the form
of cash within a short period of time, ordinarily within a year and such temporary investment as
may be readily converted into cash upon need. The ultimate objective of any firm is to maximize
the profit, but, preserving liquidity of the firm is also an important objective. The problem is that
increasing profits at the cost of liquidity can invite serious problems to the firm. Therefore, there
must be a tradeoff between these two objectives of the firms. Firms may have an optimal level of
working capital that maximizes their value.
Working Capital Management always affects marketing, production, personal and other
areas of management (Deloof, M., 2003)2. No areas of business unit are so ultimately reported to
its other areas as the area of Working Capital Management. For the success of every business
and concern not only fair capitalization is required, but the management of capital especially
working capital is very much important concern and its profitable operations.
Every functions of the business unit or everything that happens in the business is related
A Monthly Double-Blind Peer Reviewed Refereed Open Access International e-Journal - Included in the International Serial Directories. GE- International Journal of Management Research (GE-IJMR)
Website: www.aarf.asia. Email: editoraarf@gmail.com , editor@aarf.asia
Page 19
concepts and techniques particularly from discipline, like economics and accounting. Capital is
the nucleus around which the entire corporate sector relates and receives nourishment. In the area
of economics capital is often calculated as a capital goods consisting of machines, plants,
buildings, raw materials, goods in process etc. According to Juan.P.G. And Martinez. P.S.
(2007)4 “Capital is concerned as a sketch of wealth at an instant of time”.
Working Capital Management is concern with the problems that arise in attempting to
manage the current assets- currents liabilities and the integration ship that exist between them.
The concept of working capital was first endowed by Karl Marx in a different form and using
the term variable capital. In his views, the variable capital means the outlays for payroll is
advanced to worker to spend now before the goods they work on are complete. The variable
capital is nothing but usage fund which remains blocked in work-in-progress along with other
operating expenses until it is realized though the sale of finished goods.
The concept of working capital has changed a lot, with the evolution of business. From
the above indicated theoretical foundation of working capital, it presents that if the finance
manager does not properly estimate the working capital, the enterprise will have to face severe
problems in connection with the production as well as meeting daily requirements.
In this backdrop the researcher has decided to study the working capital management of
Coromandel Fertilizer Limited (CFL) and Nagarjuna Fertilizers Limited (NFL) with the overall
objective of studying working capital management through different types of ratios based on the
financial information of these companies.
2. RESEARCH METHODOLOGY:
2.1 Review of Literature:
There is a sizable literature on fertilizer industry in conforming to its long history and
economic importance. A good deal of and analytical literature exists at board levels like
problems associated with productivity, size and technology, capacity utilization, financial
performance, manpower and plant location etc. Relevant existing studies and literature have been
discussed as under:
Amarjit and Nahum, (2012)1 stated that the ultimate objective of any firm is to maximize
A Monthly Double-Blind Peer Reviewed Refereed Open Access International e-Journal - Included in the International Serial Directories. GE- International Journal of Management Research (GE-IJMR)
Website: www.aarf.asia. Email: editoraarf@gmail.com , editor@aarf.asia
Page 20
Jyh, (2011)3 most of the businesses need short term working capital at some point in their
operations.
Mahmood and Qayyum, (2010)5 pointed out that to increase profitability of a company
and ensuring sufficient liquidity to meet short-term obligations as they fall due are two main
objectives of working capital management. Profitability is related to the goal of shareholders‟
wealth maximization, and investment in current assets is made only if an acceptable return is
obtained. While liquidity is needed for a company to continue business, a company may choose
to hold more cash than needed for operational or transactional needs i.e. for precautionary or
speculative reasons.
According to Odi and Solomon, (2010)6 decisions relating to working capital and short
term financing are referred to as working capital management. These involve managing the
relationship between a firm‟s short term assets and its short term liabilities. The goal of working
capital is to ensure that the firm is able to continue its operations and that it has sufficient cash
flow to satisfy both maturing short term debt and forthcoming operational expenses. An
important working capital decision is associated with the level of investment in current assets.
Determining the most favorable level of investment in current assets involves an exchange
between costs that increase with current assets and costs that go down with current assets.
Zariyawati et al, (2009)8 opined that the fundamental principles of working capital
management are to reduce the capital employed and to improve efficiency in the areas of
receivables, inventories and payables. Working capital management initiatives release capital
employed and increase profitability that can be used for strategic investments or the reduction of
debt. Working capital management increases availability of liquid assets in a business.
Generally, businesses that have adequate working capital increase the likelihood of success
because they can improve their operations and growth.
Ranjith (2008)7, pointed that working capital decisions generally relating to the next year.
These decisions are therefore not taken on the same basis as capital investment decisions rather
they will be based on cash flows and on profitability. Management will use a combination of
policies and techniques for the management of working capital.
A Monthly Double-Blind Peer Reviewed Refereed Open Access International e-Journal - Included in the International Serial Directories. GE- International Journal of Management Research (GE-IJMR)
Website: www.aarf.asia. Email: editoraarf@gmail.com , editor@aarf.asia
Page 21
The overall objective of the study is to find out the trends of working capital and to know
liquid position. The main objectives are as under:
1. To study the trend of working capital in Coromandel Fertilizer Limited (CFL) and Nagarjuna
Fertilizers Limited (NFL) during the study period.
2. To measure the components and efficiency of working capital in selected Units
3. To make suggestions for the better working capital management for selected units.
2.3 Period of the Study:
The present study is undertaken for a period of five accounting year starting from
2008-09 to 2012-13. The researcher has selected the base year 2008-2008-09 because this year is normal for
the purpose of analysis and evolution.
2.4 Method of Data Collection:
The main source of data, used for the study is secondary drown from the annual profit
and loss account and balance sheet figures as found in the annual reports of the selected units.
Opinions expressed in commercial journals magazines, news papers accounting literature,
various journals and magazines on fertilizer industry have also been used in this study.
2.5 Method of Analysis and Interpretation of Data:
Accounting techniques and statistical techniques have been used in the present study. For
the analysis of the data, accounting technique ratio analysis is used. By using appropriate and
revenant statistical techniques, the collected data is edited and tabulated. The researcher used
parametric and non - parametric tests. With the help of average, percentage, the data has been
presented. Hypotheses have been tested by 5% level of significance by using t-test as per
requirement of the study.
2.6 Scope of the Study:
The study covers a period of five year beginning from 2008-09 to 2012-13. In this study
overall working capital, its broader components and their management have been discussed. The
fertilizer industry in Andhra Pradesh state has witness radical changes in the last decade.
A Monthly Double-Blind Peer Reviewed Refereed Open Access International e-Journal - Included in the International Serial Directories. GE- International Journal of Management Research (GE-IJMR)
Website: www.aarf.asia. Email: editoraarf@gmail.com , editor@aarf.asia
Page 22
sector of A.P. There are many corporate units working in A.P. of which the study attempted with
two leading units, they are CFL and NFL. The study covers the evaluation of credit efficiency,
quick ratio efficiency, inventory efficiency, current efficiency, working capital to sales efficiency
of selected units. The study is limited to only working capital management covering various
ratios related to working capital. The tool for appraisal of working capital management is ratio
analysis. So the scope of the study is restricted to working capital management as functional
scope and fertilizer corporate sector of Andhra Pradesh as geographical scope.
3. PROFILE OF SELECTED UNITS:
3.1 Coromandel Fertilizers Limited
Coromandel Fertilizers Limited, India‟s second largest Phosphatic fertilizer player, is in
the business segments of Fertilizers, Specialty Nutrients, Crop Protection and Retail. The
Company manufactures a wide range of fertilizers and markets around 2.9 million tons making it
a leader in its addressable markets. In its endeavor to be a complete plant nutrition solutions
Company, Coromandel has also introduced a range of Specialty Nutrient products including
Organic Fertilizers. The Crop Protection business produces insecticides, fungicides and
herbicides and markets these products in India and across the globe. Coromandel is the second
largest manufacturer of Malathion and only the second manufacturer of Phenthoate. Coromandel
has also ventured into the retail business setting up more than 640 rural retail centers in the
States of Andhra Pradesh and Karnataka. The Company clocked a turnover of Rs. 8,560 Crore
during FY 2012-13. lt was ranked among the top 20 best companies to work for by Business
Today and was also voted as one of the ten greenest companies in India by TERI, reflecting its
commitment to the environment and society. Coromandel is a part of the INR 225 Billion
Murugappa Group.
3.2 Nagarjuna Fertilizers Limited
Nagarjuna Fertilizers and Chemicals Limited is a leading manufacturer and supplier of
plant nutrients in India. It offer attractive cost-benefit ratio by delivering superior products and
services in terms of functionality, in terms of quality, offering better prices, increasing choice of
A Monthly Double-Blind Peer Reviewed Refereed Open Access International e-Journal - Included in the International Serial Directories. GE- International Journal of Management Research (GE-IJMR)
Website: www.aarf.asia. Email: editoraarf@gmail.com , editor@aarf.asia
Page 23
The flagship company of the Nagarjuna Group, Nagarjuna Fertilizers and Chemicals
Limited is a leading manufacturer and supplier of plant nutrients in India. Commencing
operations in 1986-87, today our asset base is around Rs. 21 billion. It have the distinction of
being the single largest private sector investment in Southern India. An ISO 9001:2000 certified
company, Its operational profits are one of the highest in the industry. It assume market
leadership in the markets it operate. In terms of the Composite Scheme, the name of the
Company has been changed to Nagajuna Fertilizers and Chemicals Limited w.e.f. August 19
2011.
4. RESEARCH FINDINGS AND DISCUSSIONS OF RESULTS:
Data on current assets, current liabilities, turnover, cash, inventory and profitability is acquired
from balance sheets of Coromandel Fertilizer Limited (CFL) and Nagarjuna Fertilizers Limited
(NFL) for a period of five years i.e.2008-09 to 2012-13. The reason for restricting to this
particular time period is that the latest and updated data is available for this period only. On the
basis of the information collected and analysis made thereof with the help of the statistical tools,
the results are presented in following tables.
4.1 Current Ratio:
Current ratio is the ratio of current assets of a business to its current liabilities. It is the
most widely used test of liquidity of a business and measures the ability of a business to repay its
debts over the period of next 12 months. Current ratio is calculated by dividing the current assets
with total current liabilities during that period. Table 4.1 shows the current ratio of the selected
unit CFL and NFL under the study periods.
Current ratio matches current assets with current liabilities and tells us whether the
current assets are enough to settle current liabilities. Current ratio below 1 shows critical
liquidity problems because it means that total current liabilities exceed total current assets.
General rule is that higher the current ratio better it is but there is a limit to this. Abnormally high
value of current ratio may indicate existence of idle or underutilized resources in the company.
Table 4.1
Current Ratio of the selected unit CFL and NFC
A Monthly Double-Blind Peer Reviewed Refereed Open Access International e-Journal - Included in the International Serial Directories. GE- International Journal of Management Research (GE-IJMR)
Website: www.aarf.asia. Email: editoraarf@gmail.com , editor@aarf.asia
Page 24 Year
CFL NFC
Current Assets
Current Liabilities
Ratio Current
Assets
Current liabilities
Ratio
2008-09 2862.63 1943.92 1.47 830.99 664.58 1.25
2009-10 2513.08 1146.68 2.19 534.67 561.36 0.95
2010-11 3749.81 1971.44 1.90 782.91 544.78 1.44
2011-12 5733.67 2543.5 2.25 2282.30 2503.15 0.91
2012-13 5297.74 2932.09 1.81 3063.39 3347.72 0.91
Average 1.92 1.09
Source: Published annual reports of selected units from 2008-09 to 2012-13
This ratio is a measure to know the firm‟s short term solvency. It indicates the ability of
the company to meet its current obligations. Some authors consider 2:1 as standard norm for
current ratio. Table 4.1 shows that the average current ratios of CFL 1.92:1 and NFC 1.09:1 are
less than the standard ratio which indicates that the companies are not able to meet its current
obligations from its current assets. Therefore it can be said that the liquidity in terms of current
ratio had been quite inadequate in all the years except 2009-10 and 2011-12 of CFL.
Hypothesis Testing:
H0 = There would be no significant difference in average times of current ratio in selected unit
CFL and NFC
H1 = There would be significant difference in average times of current ratio in selected Units
CFL and NFC
CFL NFC ‘t’ Value
Mean 1.9240 1.0920
4.6907
S.D 0.3149 0.2411
N 5 5
The table value of „t‟ is 2.306 and calculated value of t is 4.6907, which is in the rejection
region, as such H0 is rejected at 5 per cent level of significance and we can conclude that, there is
significant difference in the current ratio of CFL and NFC.
4.2 Quick Ratio:
The Quick Ratio is used for determining a company's ability to cover its short term debt
with assets that can readily be transferred into cash, or quick assets. The Current Liabilities
A Monthly Double-Blind Peer Reviewed Refereed Open Access International e-Journal - Included in the International Serial Directories. GE- International Journal of Management Research (GE-IJMR)
Website: www.aarf.asia. Email: editoraarf@gmail.com , editor@aarf.asia
Page 25
The Quick Ratio provides an idea of how solvent a company is without requiring sales to
cover the short debt, which differentiates it from the current ratio. Quick ratio is derived by
dividing liquid assets by current liabilities during that period. Table 4.2 shows quick ratio of the
[image:9.612.100.536.207.387.2]CFL and NFC under the study periods.
Table 4.2
Quick Ratio of the selected unit CFL and NFC
(Rs.In Crores)
Year
CFL NFC
Quick Assets
Current Liabilities
Ratio Quick
Assets
Current liabilities
Ratio
2008-09 1496.81 1943.92 0.77 830.72 664.58 1.25
2009-10 1570.95 1146.68 1.37 533.29 561.36 0.95
2010-11 2227.72 1971.44 1.13 784.48 544.78 1.44
2011-12 3840.68 2543.5 1.51 2054.86 2530.15 0.82
2012-13 4046.28 2932.09 1.38 2820.08 3347.72 0.84
Average 1.23 1.06
Source: Published annual reports of selected units from 2008-09 to 2012-13
From the table 4.2, it can be analyzed that the quick ratio of CFL ranged from 0.77 to
1.51 and in the case of NFL 0.82 to 1.44 during the study period. In the year 2008-09 the liquid
ratio of CFL was 0.77 and it increased to 1.37 in the year 2009-10. In the year 2010-11 it was
decreased to 1.13 because of there was a decrease in liquid asset when compared to previous
year. In the year 2012-13, when compared to the year 2008-09, there was an increase in the
liquid ratio to 1.38 by maintaining the ideal liquid ratio. In case of NFC the quick ratio indicates
a mixed friend. It was 1.25 in the year 2008-09 and decreased to 0.95 during the year 2009-10
due to decrease in liquidity. In the year 2010-11 further increased to 1.44 thereafter decreased to
0.84 by 2012-13 which is less than the ideal ratio but on average of last five years the company is
maintaining an ideal ratio.
While compare the liquidity position of CFL and NFC the liquid ratio of CFL is initially
low but later on it was increased but in case of NFC initially high later on it was decreased
during the study period. It can be concluded that the quick ratio of CFL shows somewhat better
A Monthly Double-Blind Peer Reviewed Refereed Open Access International e-Journal - Included in the International Serial Directories. GE- International Journal of Management Research (GE-IJMR)
Website: www.aarf.asia. Email: editoraarf@gmail.com , editor@aarf.asia
Page 26 Hypothesis Testing:
H0 = There would be no significant difference in average times of Quick Ratio in selected unit
CFL and NFC
H1 = There would be significant difference in average times of Quick Ratio in selected Units
CFL and NFC
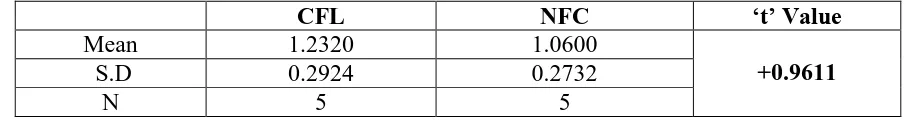
CFL NFC ‘t’ Value
Mean 1.2320 1.0600
+0.9611
S.D 0.2924 0.2732
N 5 5
Table value of „t‟ is 2.306 and Calculated value of „t‟ is + 0.96 which is lower than the table
value so null hypothesis is accepted. It shows that there is no significant difference in quick ratio
of CFL and NFC.
4.3 Sales to Working Capital Ratio:
It usually takes a certain amount of invested cash to maintain sales. There must be an
investment in accounts receivable and inventory, against which accounts payable are offset.
Thus, there is typically a ratio of working capital to sales that remains relatively constant in a
business, even as sales levels change.
This relationship can be measured with the sales to working capital ratio, which should
be reported on a trend line to more easily spot spikes or dips. A spike in the ratio could be caused
by a decision to grant more credit to customers in order to encourage more sales, while a dip
could signal the reverse. A spike might also be triggered by a decision to keep more inventories
on hand in order to more easily fulfill customer orders. Such a trend line is an excellent feedback
mechanism for showing management the results of its decisions related to working capital.
The sales to working capital ratio is calculated by dividing annualized net sales by
average working capital. Table 4.3 shows the sales to working capital ratio of the selected units
[image:10.612.77.530.211.271.2]CFL and NFC under the study time.
Table 4.3
Sales to Working Capital Ratio of the selected unit CFL and NFC
(Rs.In Crores)
[image:10.612.72.544.671.726.2]A Monthly Double-Blind Peer Reviewed Refereed Open Access International e-Journal - Included in the International Serial Directories. GE- International Journal of Management Research (GE-IJMR)
Website: www.aarf.asia. Email: editoraarf@gmail.com , editor@aarf.asia
Page 27
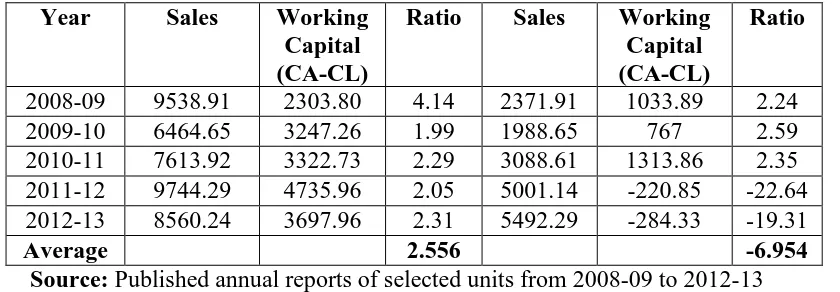
Year Sales Working
Capital (CA-CL)
Ratio Sales Working
Capital (CA-CL)
Ratio
2008-09 9538.91 2303.80 4.14 2371.91 1033.89 2.24
2009-10 6464.65 3247.26 1.99 1988.65 767 2.59
2010-11 7613.92 3322.73 2.29 3088.61 1313.86 2.35
2011-12 9744.29 4735.96 2.05 5001.14 -220.85 -22.64
2012-13 8560.24 3697.96 2.31 5492.29 -284.33 -19.31
Average 2.556 -6.954
Source: Published annual reports of selected units from 2008-09 to 2012-13
Table 4.3 makes it evident the ratio of sales to working capital in CFL ranged between
1.99 times and 4.14 times indicating a fluctuating trend during the four year 2009-10, 2010-11,
2011-12 and 2012-13 the ratio was 1.99, 2.29, 2.05 and 2.31 respectively. The ratio was 4.14
times in 2008-09 which was the highest level of the study period. This ratio declined and went
down to 2.05 in 2011-12 showing a good support working capital to sales after the year it was
increased to 2.31 during the last year of the study period.
In case of NFC the sales to working capital ratio in the beginning two years this ratio was
increased. It was -22.64 the lowest level in 2011-12 and where as it was of 2.59 the highest level
in 2009-10 thereafter it decreased and went down to -19.31 by the end of the study period due to
increase in creditors and outstanding payments. It can be concluded that the average sales to
working capital ratio of CFL is higher and better than the average ratio of NFC during the study
period.
Hypothesis Testing:
H0 = There would be no significant difference in sales to working capital ratio in selected unit
CFL and NFC
H1 = There would be significant difference in sales to working capital ratio in selected Units CFL
and NFC
CFL NFC ‘t’ Value
Mean 2.556 -6.954
2.6503
S.D 0.896 12.854
[image:11.612.99.519.86.232.2]A Monthly Double-Blind Peer Reviewed Refereed Open Access International e-Journal - Included in the International Serial Directories. GE- International Journal of Management Research (GE-IJMR)
Website: www.aarf.asia. Email: editoraarf@gmail.com , editor@aarf.asia
Page 28
Table value of „t‟ is 2.306 and Calculated value of „t‟ is + 2.65 which is higher than the
table value so null hypothesis is rejected. It shows that there is a significant difference in sales to
working capital ratio of CFL and NFC.
4.4 Inventory Turnover Ratio:
Inventory turnover ratio is used to measure the inventory management efficiency of a
business. In general, a higher value of inventory turnover indicates better performance and lower
value means inefficiency in controlling inventory levels. A lower inventory turnover ratio may
be an indication of over-stocking which may pose risk of obsolescence and increased inventory
holding costs. However, a very high value of this ratio may be accompanied by loss of sales due
to inventory shortage.
Inventory turnover is different for different industries. Businesses which trade perishable
goods have very higher turnover compared to those dealing in durables. Hence a comparison
would only be fair if made between businesses of same industry.
Inventory turnover is the ratio of cost of goods sold by a business to its average inventory
during a given accounting period. It is an activity ratio measuring the number of times per
[image:12.612.96.544.459.621.2]period, a business sells and replaces its entire batch of inventory again.
Table 4.4
Inventory Turnover Ratio of the selected unit CFL and NFC
(Rs.In Crores)
Year
CFL NFC
CGS Average
Inventory
Ratio CGS Average
Inventory
Ratio
2008-09 8771.03 1206.46 7.27 2164.14 50.98 42.45
2009-10 5795.56 797.18 7.27 1750.02 32.60 53.68
2010-11 6657.62 1272.96 5.23 2761.51 41.61 66.38
2011-12 8598.37 1557.68 5.45 4632.14 113.72 40.73
2012-13 7884.84 1151.07 6.85 4984.52 121.66 40.97
Average 6.414 48.842
Source: Published annual reports of selected units from 2008-09 to 2012-13
Table 4.4 makes an evident that the inventory turnover ratio in CFL ranged between 5.23
times and 7.27 times. It was highest with 7.27 in the year 2008-09 and 2009-10 and lowest with
A Monthly Double-Blind Peer Reviewed Refereed Open Access International e-Journal - Included in the International Serial Directories. GE- International Journal of Management Research (GE-IJMR)
Website: www.aarf.asia. Email: editoraarf@gmail.com , editor@aarf.asia
Page 29
ratio of 6.41 except 2010-11 and 2011-12. Where as in case of NFC the ratio ranged between
40.73 times to 66.38 times. The ratio was highest in 2010-11 with 66.38 times and lowest with
40.73 times in 2011-12. During the study period the performance in respect of inventory
management of CFL was impressive than that of NFC. The average of stock ratio during the
study time was also higher in NFC (48.84) in comparison to that of CFL (6.41) for the five years
study period from 2008-09 to 2012-13.
Hypothesis Testing:
H0 = There would be no significant difference in Inventory turnover ratio in selected unit CFL
and NFC
H1 = There would be significant difference in Inventory turnover ratio in selected Units CFL and
NFC
CFL NFC ‘t’ Value
Mean 6.414 48.842
8.4553
S.D 0.998 11.176
N 5 5
Table value of „t‟ is 2.306 and Calculated value of „t‟ is 8.45 which is higher than the
table value so null hypothesis is rejected. It shows that there is a significant difference in
inventory turnover ratio of CFL and NFC.
4.5 Cash Turnover Ratio:
Cash Turnover Ratio shows the number of times that cash turnover in a year. A lower
ratio may indicate the inefficient use of working capital. Analyzing the cash turnover ratio can
help you determine how efficiently you keep cash flowing through your small business, but there
are some drawbacks to the ratio that could present an inaccurate picture. Cash turnover ratio has
been computed by dividing the cash balance with current liabilities. The following table shows
the cash turnover ratio of CFL and NFC.
Table 4.5 indicates the cash turnover ratio of fertilizer units under study from 2008-09 to
2012-13. Above table make it evident that the cash turnover ratio in CFL witnessed decreasing
trend during the study period except 2008-09. It was 0.70 times in 2009-10 which decreased to
0.15 times in 2012-13. But it was more than the average ratio of 0.36 times from 2009-10 to
[image:13.612.78.529.334.395.2]A Monthly Double-Blind Peer Reviewed Refereed Open Access International e-Journal - Included in the International Serial Directories. GE- International Journal of Management Research (GE-IJMR)
Website: www.aarf.asia. Email: editoraarf@gmail.com , editor@aarf.asia
Page 30
0.11 and 0.22 times respectively. Thereafter it was under decline trend and stepped down to 0.09
times by the end of the study period. It was observed that both CFL and NFC not having
sufficient cash to meet the current liabilities. Whenever the creditors need urgent payment both
[image:14.612.95.542.196.353.2]the units will face financial difficulties.
Table 4.5
Cash Turnover ratio of the selected unit CFL and NFC
(Rs.In Crores)
Year
CFL NFC
Cash Balance
Current Liabilities
Ratio Cash
Balance
Current Liabilities
Ratio
2008-09 341.49 1943.92 0.17 57.46 664.58 0.08
2009-10 809.86 1146.68 0.70 61.96 561.36 0.11
2010-11 902.06 1971.44 0.45 120.78 544.78 0.22
2011-12 917.85 2543.50 0.36 280.20 2503.15 0.11
2012-13 452.76 2932.09 0.15 325.21 3347.72 0.09
Average 0.366 0.122
Source: Published annual reports of selected units from 2008-09 to 2012-13
Hypothesis Testing:
H0 = There would be no significant difference in Cash turnover ratio in selected unit CFL and
NFC
H1 = There would be significant difference in Cash turnover ratio in selected Units CFL and
NFC
CFL NFC ‘t’ Value
Mean 0.366 0.122
2.345
S.D 0.22568 0.0563
N 5 5
Table value of „t‟ is 2.306 and calculated value of „t‟ is 2.345 which is higher than the
table value so null hypothesis is rejected. It shows that there is a significant difference in cash
turnover ratio of CFL and NFC.
4.6 Net working capital to total working capital ratio:
This ratio is computed by dividing the net working capital by total working capital here
total working capital means total current assets. The ratio of working capital as percentage of
total working capital (Current assets) shows long term financing of current assets where as the
[image:14.612.79.531.471.531.2]A Monthly Double-Blind Peer Reviewed Refereed Open Access International e-Journal - Included in the International Serial Directories. GE- International Journal of Management Research (GE-IJMR)
Website: www.aarf.asia. Email: editoraarf@gmail.com , editor@aarf.asia
Page 31
Following table shows net working capital to total working capital ratio in GSFC and GNFC
[image:15.612.101.532.173.303.2]during the study period of 2008-09 to 2012-13.
Table 4.6
Net working capital to total working capital ratio of the selected unit CFL and NFC
(Rs.In Crores)
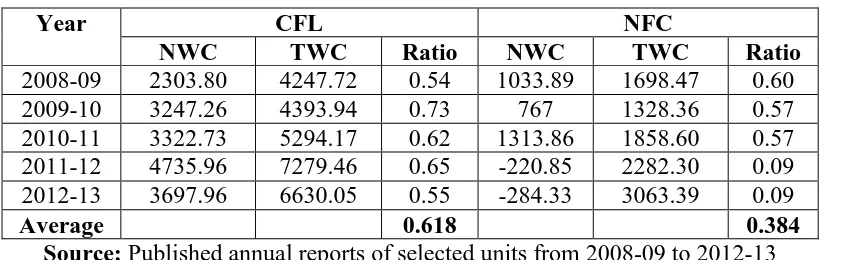
Year CFL NFC
NWC TWC Ratio NWC TWC Ratio
2008-09 2303.80 4247.72 0.54 1033.89 1698.47 0.60
2009-10 3247.26 4393.94 0.73 767 1328.36 0.57
2010-11 3322.73 5294.17 0.62 1313.86 1858.60 0.57
2011-12 4735.96 7279.46 0.65 -220.85 2282.30 0.09
2012-13 3697.96 6630.05 0.55 -284.33 3063.39 0.09
Average 0.618 0.384
Source: Published annual reports of selected units from 2008-09 to 2012-13
It is evident from above table that the percentage of net working capital to total working
capital in CFL increased in four year while compare with first year. It was 0.54 times in the year
2008-09 and increased to 0.73, 0.62 and 0.65 times in 2009-10 to 2011-12 and it was more than
the average ratio of 0.618. The ratio was decrased to 0.55 in 2012-13 due to increase in current
liabilities but the portion of net working capital was high in CFL throughout the study period.
Where as in case of NFC the ratio was high in first three years with 0.60, 0.57 and 0.57 times but
it was tremendously dropped to 0.09times during the last two years of study period due to
negative net working capital. The main reason behind the negative net working capital is greater
increase in current liabilities of NFC.
While compare the Net working capital to total working capital (Current Assets) of CFL
and NFC the ratio of NFC is initially high but later on it was decreased but in case of CFL
initially low later on it was increased during the study period. It can be concluded that the
portion of net working capital to total working capital of CFL shows better depiction than the
NFC during the period under study.
Hypothesis Testing:
H0 = There would be no significant difference in Net working capital to Total working capital
A Monthly Double-Blind Peer Reviewed Refereed Open Access International e-Journal - Included in the International Serial Directories. GE- International Journal of Management Research (GE-IJMR)
Website: www.aarf.asia. Email: editoraarf@gmail.com , editor@aarf.asia
Page 32
H1 = There would be significant difference in Net working capital to Total working capital in
selected Units CFL and NFC
CFL NFC ‘t’ Value
Mean 0.618 0.384
2.8705
S.D 0.0779 0.268
N 5 5
Table value of„t‟ is 2.306 and calculated value of „t‟ is 2.87 which is higher than the table
value so null hypothesis is rejected. It shows that there is a significant difference in cash turnover
ratio of CFL and NFC.
5. RECOMMENDATIONS AND CONCLUSION:
Working capital management is new concept in management in the area of research like
as accounting for human resources financial management marketing management and liquidity
management fertilizer is considered as the most essential element for increasing agricultural
production and land productivity no doubt there is an increase in the use of chemical fertilizer
and in secticids after the green revolution the development of industry, trade, commerce,
infracture, transportation communication etc depends on agriculture provide employs round
about 65% of the population. The use of chemical fertilizer is necessary for the increase in
agro-production time by time as the central and state government announced different types of
schemes for the development of Indian agri. Production.
In view of above significance the present study attempts to understand the performance
of selected fertilizers units through working capital management. From the above analysis it can
be concluded that working capital management of CFL is effective than NFL. NFL has needed
to reduce current liabilities and growth up its current assets. Also it should increase its liquidity
for effective working capital management. A high value of inventory turnover ratio of NFL may
be accompanied by loss of sales due to inventory shortage. The excise duty on fertilizer which
has been constant on the rise during the study period should be lowered down by the central
government so that the cost of production and selling price of fertilizer can be reduce and thus
A Monthly Double-Blind Peer Reviewed Refereed Open Access International e-Journal - Included in the International Serial Directories. GE- International Journal of Management Research (GE-IJMR)
Website: www.aarf.asia. Email: editoraarf@gmail.com , editor@aarf.asia
Page 33 References:
1. Amarjit and Nahum, (2012). „The relationship between Working Capital Management and Profitability, Evidence from the United States‟, Business and Economics Journal. Vol.10, pp.24-32.
2. Deloof, M. (2003). „Does Working Capital Management Affects Profitability of Belgian Firms‟ Journal of Business Finance & Accounting, Vol. 30 No 3 & 4 pp. 573 – 587.
3. Dong, H.P and Jyh. S,, (2011), „The relationship between Working Capital Management and Profitability‟, International Research Journal of Finance and Economics. Vol. 49, pp. 1450-2887.
4. Juan.P.G. And Martinez. P.S. (2007). „Effects of working capital management on SME profitability‟, International journal of Managerial Finance, Vol 3 No 2, pp. 164-177.
5. Mahmood and Qayyum. A. (2010). „Working Capital Management and Corporate Performance of Manufacturing Sector in India‟, International Research Journal of Finance and Economics, Vol. 47. Pp 1450-2887.
6. Odi and Solomon, (2010). „An Empirical Analysis of Corporate Survival and Growth: Evidence from Efficient Working Capital Management,‟ Vol.12, No.1.
A Monthly Double-Blind Peer Reviewed Refereed Open Access International e-Journal - Included in the International Serial Directories. GE- International Journal of Management Research (GE-IJMR)
Website: www.aarf.asia. Email: editoraarf@gmail.com , editor@aarf.asia
Page 34
8. Shin, H.H and Soenen, L. (1998). „Efficiency of Working Capital Management and Corporate Profitability‟, Financial Practice and Education, Vol. 8 No. 2, pp 37-45.