CONSUMERS’ PERCEPTION TOWARDS STORE BRAND
Dr. N. Meeran Mydheen
Associate Professor, School of Commerce and International Business, Dr. G. R. Damodharan College of Science, Coimbatore.
ABSTRACT
Stores are nowadays expected to establish their brand image for survive in the market.
Over the period, stores enrich their services from augment to potential position for this. But it is
difficult to struggle with big giant’s concentration on retail sector in recent years. In order to
create more brand image in specific market, they have to understand the consumer perception
towards store brand. This study was conducted in Coimbatore city to understand consumers’
perception and expectation towards store brand. This study finds that majority of respondent are
belong to urban area and fall in the age group of 29-35.
Key Words: Brand, Perception, Consumer, Retail, Quality
Introduction
Retail are emerging sectors in India, its net sales are quite significant among the world
retail sector. Indian consumers‟ views and expectations towards retails are influenced by various
aspects like growth of middle class, exposure of global lifestyle with technological growth, flow
of FDI and inflow of global brand and marketing strategies. Hence the every retailer has to
present themselves as a unique outlet to the end users. Store brand is a creation of uniqueness
for their outlet by segmenting, pricing, packing, facilitating with their own brand. The stores falls
under one brand are responsible for maintaining of stock, sourcing, warehousing, and control and
International Research Journal of Management and Commerce
ISSN: (2348-9766) Impact Factor- 5.564, Volume 4, Issue 10, October 2017 Website- www.aarf.asia, Email : [email protected] , [email protected]
developing, merchandising of stock and marketing. Nowadays, the retailer may create format for
their services into various ways like supermarket, departmental stores, single brand and multi
brand and chain store. This formats require some uniqueness and identification, hence the
concept of store brand have emerged. The main advantages of store brand are control over
brand, more freedom and flexibility on pricing, more control over product attribute and quality ,
profit margin, and can fill the category gap that are not being filled by national brand.
Competition among these stores in creation of brand may give positive result for the consumers‟
purchase process. This study focus on the consumers‟ perception towards store brand in
Coimbatore. Coimbatore is one of the leading business centres with good number of
manufacturing sectors and services sectors.
Review of literature
Alan Dick, Arun Jain, Paul Richardson, (1996) their study shows that store brand prone
consumers exhibit significantly less reliance on extrinsic cues in quality assessment. Reliance on
brand name had an especially strong effect in forming taste expectations. Price reliance had a
marked effect in determining perceptions of quality and reliability of ingredients.. Eugene
Sivadas, Jamie L. Baker‐Prewitt, (2000) reveals in his study that service quality influences
relative attitude and satisfaction with department stores. Satisfaction influences relative attitude,
repurchase, and recommendation but has no direct effect on store loyalty. Fostering favorable
relative attitude and getting customers to recommend the product or service holds key to
fostering store loyalty. Kusum L. Ailawadi, Scott A. Neslin, Karen Gedenk (2001), reveal
findings in their study that though demographics do not influence these behaviors directly, they
have significant associations with psychographic characteristics and therefore are useful for
market targeting. Most important, usage of store brands and usage of promotions, particularly
out-of-store promotions, are associated with different psychographics. Store brand use correlates
mainly with traits related to economic benefits and costs, whereas the use of out-of-store
promotions is associated mainly with traits related to hedonic benefits and costs. Kristof De
Wulf, Gaby Odekerken‐Schröder, Frank Goedertier, Gino Van Ossel (2005), shows the results
confirm the common belief that private label products can offer the same or even better quality
than national brands, but at a lower price. George Baltas, Paraskevas C. Argouslidis (2007),
disclose in their study that specific consumer characteristics are associated with interpersonal
process, in which quality has the most significant role. The results also demonstrate the changing
image of store brands, the endorsement of such products by consumers of higher socio‐economic
status, and lead to important implications for both retailers and manufacturers of consumer
products Rita Martenson, (2007), shows in her study that most important for customer
satisfaction is the store brand. Customers are satisfied when the store is neat and pleasant and
when they feel that the store understands their needs. Only certain customer segments are
interested in store brands. Marcel Corstjens, Rajiv Lal (2000), in this article, In a market in
which a segment of consumers is sensitive to product quality and consumers‟ brand choice in
low-involvement packaged goods categories is characterized by inertia, the authors show that
quality store brands can be an instrument for retailers to generate store differentiation, store
loyalty, and store profitability, even when the store brand does not have a margin advantage over
the national brand. A quality store brand policy is profitable only if a significant portion of
shoppers buys the national brand. Mbaye Fall Diallo, Jean‐Louis Chandon, Gérard Cliquet, Jean
Philippe, (2013), depicts results in his study indicating that store image perceptions, Store Brand
price‐image, value consciousness, and Store Brand attitude have significant and positive
influence on Store Brand purchase behaviour. Store familiarity positively influences Store Brand
choice, but not Store Brand purchase intention. None of the socio‐demographic variables (age,
gender, household income, and family size) included as control variables has an effect on SB
choice.
Statement of problem
Nowadays stores have to meet huge competition in emerging globalization scenario. They are
driven by product brand as well as other store competitor. The store itself creates marketing
strategy to enrich brand image and occupy the strong place in consumer minds. They need to
understand the consumer perception towards store brand.
Objective of study
This study is carried out with following objectives:
a) To understand the profile of the customer
c) To understand consumer „s perception on branded store
Research Methodology
The data were collected through structured questionnaires and distributed to visitors of
various branded store in Coimbatore city. The questionnaire was prepared with five point Likert
Scale method. There were twenty five branded stores chosen in Coimbatore city on convenient
sample methods. From each store ten visitors were selected to collect primary data. Totally 250
questionnaire were collected through convenient sampling method. Descriptive statistics and
Chi-Square technique were used to analyse the data and with percentage analysis, the respondent
were categorized into various segments.
ANALYSIS
Profile of the Consumer
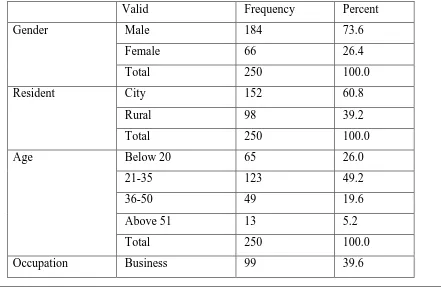
Table No. 1 depicts the profile of the consumer of stores in the Coimbatore City.
Consumers‟ profile includes gender, residential, age, occupation, income and education are taken
[image:4.612.87.528.406.693.2]for understanding classification of consumer who using stores.
Table No. 1.
Profile of Consumer
Valid Frequency Percent
Gender Male 184 73.6
Female 66 26.4
Total 250 100.0
Resident City 152 60.8
Rural 98 39.2
Total 250 100.0
Age Below 20 65 26.0
21-35 123 49.2
36-50 49 19.6
Above 51 13 5.2
Total 250 100.0
Employee 91 36.4
Agriculture 18 7.2
Professional 16 6.4
None 26 10.4
Total 250 100.0
Income Per Month Below 15000 5 2.0
15001-25000 41 16.4
25001-40000 132 52.8
40001-60000 44 17.6
Above 60000 28 11.2
Total 250 100.0
Education Secondary Level 66 26.4
Degree Level 141 56.4
Post Graduate 21 8.4
Professional 22 8.8
Total 250 100.0
Table No. 1 shows that majority (73.6 Percent) of the respondent belong to
male, majority (60.8 percent) of the respondent are residing in city area, majority (40.2 percent)
of consumer falls under the age group of 29-35 category, majority (39.6 Percent) of the
respondent doing business are visiting the stores, 52.8 percent of the respondent falls under the
income group of (25,001-40,000), 56.4 percent of the respondent are degree holders.
Number of time visited
Table No. 2 shows that the number of time visited the stores by the consumers.
As many as time a consumer visiting stores will show their level of satisfaction towards stores
brand.
[image:5.612.94.504.33.388.2]
Table No. 2
Number of time visited the Store
Valid Frequency Percent
Number of Time
Visited
one time 6 2.4
Rare 29 11.6
Occasionally 71 28.4
Frequent 106 42.4
Regularly 38 15.2
Total 250 100.0
Table No. 2 depicts that majority of the respondent (42.4 Percent) are visiting the stores
frequently.
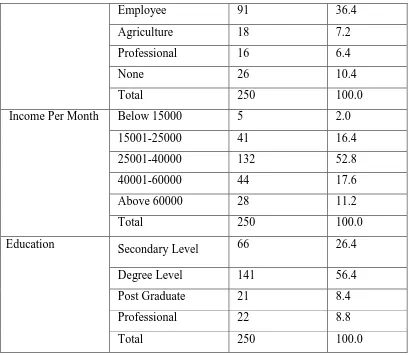
Purpose of visit
Table No. 3 shows that purpose of visiting the store. The purpose includes
shopping, entertainment, just a company with others who intending to visit the stores for their
own purpose, enquiry about the product to make purchase decision. The purpose of visit has
been evaluated through five point scales with Regular, Frequently, Occasional, Rare and None.
Table No. 3 Purpose of Visit
Descriptive Statistics
N Minimum Maximum Mean Std.
Deviation
Shopping 250 1 4 2.42 .924
Entertainment 250 2 5 3.67 1.074
Just a company to
others
250 1 5 3.13 .902
Enquiry about product 250 2 5 3.58 .902
[image:6.612.70.490.459.661.2]Table No. 3 depicts that means score 3.67 shows that stores were visited for
entertainment purpose was rare. Mean value of purpose of visiting stores is close to 2.42 shows
that stores were visited frequently for the shopping purpose
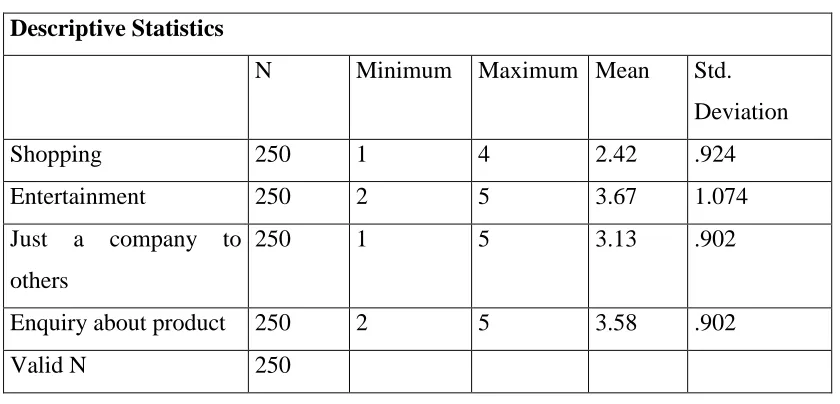
Selection of a store
Table No. 4 shows that factors of selection of stores includes convenient, brand of store,
Trust, variety of product, product brand, price , service after sales, ambience, product quality,
service quality , Elite, Credit facility measured by five point scale with Strongly Agree, Agree,
[image:7.612.73.524.256.607.2]Neutral, Disagree, Strongly Disagree.
Table No. 4
Selection of a Store
Descriptive Statistics: Selection of a Store
N Minimum Maximum Mean Std. Deviation
Convenenient 250 1 4 1.78 .758
Brand 250 1 5 1.98 1.086
Trust 250 1 2 1.46 .499
Variety Of Product 250 1 4 1.52 .701
Product Brand 250 1 5 1.94 .923
Price 250 1 4 1.65 .799
Service After Sales 250 1 4 1.88 .834
Ambience 250 1 5 3.69 1.101
Product Quality 250 1 2 1.28 .450
Service Quality 250 1 2 1.51 .501
Elite 250 1 4 1.85 .835
Credit Facility 250 1 5 2.59 1.216
Table No. 4 reveals that highest mean value 3.69 shows that Ambience of
parking has been „Disagreed‟. Mean value 1.28 is close to Strongly Agree shows the product
Opinion on success factor on branded stores
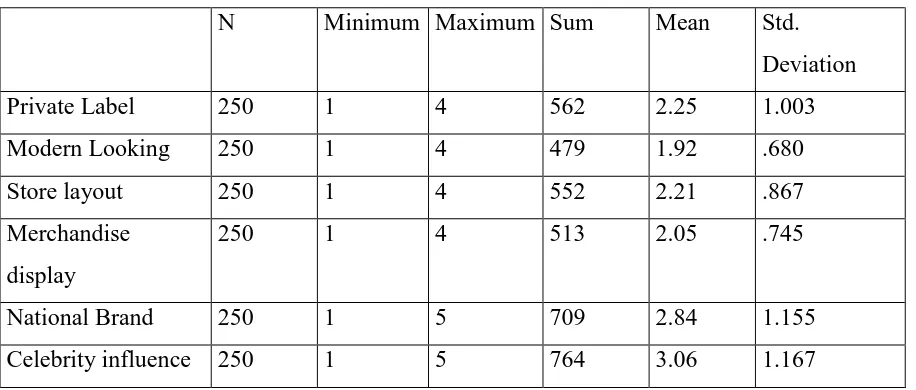
Table No. 5 shows the opinion of the respondent towards various factor success of store
brand which include which include private label, modern looking, store layout, merchandise
display, role of national brand, celebrity influence on store brand. Respondent‟s opinions were
evaluated through five point scale with Strongly Agree, Agree, Neutral, Dis-agree, Strongly
disagree.
Table No. 5
Descriptive Statistics: Opinion on success factor of branded stores
N Minimum Maximum Sum Mean Std.
Deviation
Private Label 250 1 4 562 2.25 1.003
Modern Looking 250 1 4 479 1.92 .680
Store layout 250 1 4 552 2.21 .867
Merchandise
display
250 1 4 513 2.05 .745
National Brand 250 1 5 709 2.84 1.155
Celebrity influence 250 1 5 764 3.06 1.167
Table No. 5 reveals that the respondent agrees that modern looking of the stores increase
the outlook of the stores. The highest mean value (3.06) is close to „Dis-Agree‟ for Celebrity
influence towards store brand. Because of mean value of modern looking (1.92) is close to
„Agree‟.
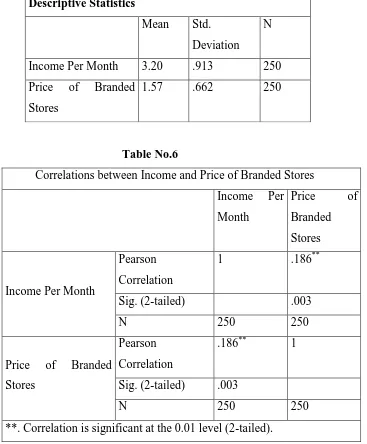
Correlation between Income and Price of Branded Stores
The Table No. 6 shows that correlation between Income of the respondent and their
opinion on price of Branded stores. Income of the consumers is one of the deciding factors of
purchasing power which ultimately influence on price of product or services. This table shows
whether there is any significant relativity between income of the respondent and Price of the
Branded stores.
Null Hypothesis: There is no significant relationship between Income of the respondent and
Price of the Branded stores
Alternative hypothesis: There is significant relationship between Income of the respondent and
Price of the Branded stores
Table No.6
Correlations between Income and Price of Branded Stores
Income Per
Month
Price of
Branded
Stores
Income Per Month
Pearson
Correlation
1 .186**
Sig. (2-tailed) .003
N 250 250
Price of Branded
Stores
Pearson
Correlation
.186** 1
Sig. (2-tailed) .003
N 250 250
**. Correlation is significant at the 0.01 level (2-tailed).
Table No. 6 shows that correlation between income of the respondent and opinion on
prices of branded store. This Table shows that Pearson‟s „r‟ is 0.186 which is close to 0 hence
there is weak relationship between Income of the respondent and Prices of the branded store.
Descriptive Statistics
Mean Std.
Deviation N
Income Per Month 3.20 .913 250
Price of Branded
Stores
[image:9.612.124.491.158.602.2]The Sig (2-tailed) value 0.003 is less than 0.05. Hence null hypothesis is rejected and alternative
hypothesis is accepted. There is significant relationship between income of the respondent and
prices of the branded store.
FINDINGS
This study focuses on consumers‟ experience and expectation on store brand. This study
shows that majority of respondent are male and majority are residing in city area under the age
group of 29-35 category, majority of the respondent doing business are visiting the stores and
falls under the income group of (25,001-40,000), majority of respondent are degree holders.
Majority of the respondent are visiting the stores frequently. Descriptive analysis shows that
people are rarely visiting the store for entertainment purpose and ambiance for parking is not
given higher importance for selection of stores when compare with product and service quality
and price and Celebrity factor are less influential factor on success of the store brand. There is
significant relationship between income of the respondent and prices of the branded store. The
perception towards the price will be influenced with purchasing capacity of the people.
BIBLIOGRAPHY
1. Alan Dick, Arun Jain, Paul Richardson, (1996), "How consumers evaluate store brands",
Journal of Product & Brand Management, Vol. 5 Issue: 2, pp.19-28,
2. Eugene Sivadas, Jamie L. Baker‐Prewitt, (2000) "An examination of the relationship
between service quality, customer satisfaction, and store loyalty", International Journal of
Retail & Distribution Management, Vol. 28, Issue: 2, pp.73-82,
3. Kusum L. Ailawadi, Scott A. Neslin, Karen Gedenk (2001), “Pursuing the Value-Conscious Consumer: Store Brands Versus National Brand Promotions”, Journal of
Marketing: January 2001, Vol. 65, No. 1, pp. 71-89.
4. Kristof De Wulf, Gaby Odekerken‐Schröder, Frank Goedertier, Gino Van Ossel, (2005),
"Consumer perceptions of store brands versus national brands", Journal of Consumer
5. George Baltas, Paraskevas C. Argouslidis, (2007) "Consumer characteristics and demand
for store brands", International Journal of Retail & Distribution Management, Vol. 35
Issue: 5, pp.328-341,
6. Rita Martenson, (2007), "Corporate brand image, satisfaction and store loyalty: A study
of the store as a brand, store brands and manufacturer brands", International Journal of
Retail & Distribution Management, Vol. 35 Issue: 7, pp.544-555.
7. Marcel Corstjens and Rajiv Lal, (2000), “Building Store Loyalty Through Store Brands”,
Journal of Marketing Research: August 2000, Vol. 37, No. 3, pp. 281-291.
8. Mbaye Fall Diallo, Jean‐Louis Chandon, Gérard Cliquet, Jean Philippe, (2013) "Factors
influencing consumer behaviour towards store brands: evidence from the French market",
International Journal of Retail & Distribution Management, Vol. 41 Issue: 6, pp.422-441,