Quantitative Analysis of Simultaneous EEG Features during PET
Studies for Childhood Partial Epilepsy
Yun Jung Hur,
1,2Joon Soo Lee,
3Jong Doo Lee,
4Mi Jin Yun,
4and Heung Dong Kim
31Department of Pediatrics, Haeundae Paik Hospital, Inje University College of Medicine, Busan; 2Department of Medicine, The Graduate School, Yonsei University, Seoul;
3Division of Pediatric Neurology, Department of Pediatrics, Pediatric Epilepsy Clinic, Severance Children’s Hospital,
Epilepsy Research Institute, Yonsei University College of Medicine, Seoul;
4Department of Radiology, Yonsei University College of Medicine, Seoul, Korea.
Received: January 26, 2012 Revised: April 27, 2012 Accepted: May 14, 2012
Corresponding author: Dr. Heung Dong Kim, Division of Pediatric Neurology,
Department of Pediatrics, Pediatric Epilepsy Clinic, Severance Children’s Hospital, Epilepsy Research Institute, Yonsei University College of Medicine, 50 Yonsei-ro, Seodaemun-gu, Seoul 120-752, Korea.
Tel: 82-2-2228-2061, Fax: 82-2-393-9118 E-mail: [email protected]
∙ The authors have no financial conflicts of interest.
© Copyright:
Yonsei University College of Medicine 2013 This is an Open Access article distributed under the terms of the Creative Commons Attribution Non-Commercial License (http://creativecommons.org/ licenses/by-nc/3.0) which permits unrestricted non-commercial use, distribution, and reproduction in any medium, provided the original work is properly cited.
Purpose: To demonstrate the significance of simultaneous electroencephalography (EEG) recording during 2-deoxy-2-[18F] fluoro-D-glucose (FDG)-positron emission tomography (PET) in childhood partial epilepsy. Materials and Methods: We in-cluded 46 children with partial epilepsy who underwent simultaneous EEG during PET. We compared the epileptogenic area of several EEG features including epilep-tiform discharges, focal polymorphic slow waves, and electrographic seizures, with the abnormal metabolic region on PET. We also compared the epileptogenic area of simultaneous EEG and PET with findings on magnetic resonance imaging (MRI) and video/EEG, as well as the histopathological diagnosis of the resected cortical area, in eight patients who underwent surgical resection of the epileptogenic area.
Results: Hypometabolic regions on interictal PET were concordant with epilepto-genic areas of epileptiform discharges and focal polymorphic slow waves, accord-ing to their frequency and/or severity, with odds ratios of 1.35 and 1.81, respective-ly (p<0.05). Hypermetabolic PET was also concordant with epileptogenic areas of ictal events longer than 20 seconds during the period of FDG uptake. Among the eight patients who underwent surgical resection, six patients, including two with non-lesional MRI, had concordant EEG and PET findings, were confirmed patho-logically, and became seizure-free after surgery. Conclusion: Simultaneous EEG is useful in identifying epileptogenic areas due to a high concordance with abnormal PET metabolic areas. Moreover, simultaneous EEG may also prevent false lateral-ization of PET from postictal and mixed metabolism during ictal events, as well as abnormal hypermetabolism, during frequent interictal epileptiform discharges.
Key Words: Positron-emission tomography, electroencephalography, epilepsy
INTRODUCTION
epilepto-the FDG tracer injection and continued for more than 20 minutes to clearly discern the ictal and interictal phases. Ic-tal manifestation, motion artifacts and other specifics were recorded during monitoring. The interictal EEG was repre-sented by the frequencies of spike/sharp waves and the se-verity of focal polymorphic slow waves. The frequency of spike/sharp waves was classified into four categories: fre-quent (≥10 spikes/minute), occasional (<10 but ≥1 spikes/ minute), rare (<1 spike/minute) and none. This categoriza-tion was similar to that used by Asano, et al.13 The severity of focal polymorphic slow waves was classified into none, infrequent (one discrete episode defined as regional slow-ing durslow-ing a 10-second epoch or less per hour), intermedi-ate (more than one episode per hour) or continuous, similar to the classification used by Erbayat Altay, et al.12 For ictal EEG, in which ictal events were present during FDG up-take, duration, frequency of ictal events, the time of ictal onset after FDG administration and location were recorded. Based on EEG findings, each epileptogenic region was matched to the frontal, temporal, parietal or occipital area according to the location of the abnormal PET findings.
PET data were obtained using a GE Advanced PET sys-tem (General Electric Medical Syssys-tems, Milwaukee, WI, USA). After fasting for at least 6 hours, patients received an intravenous injection of FDG (0.145 mCi/kg), followed by an uptake period of 40 minutes in a quiet, dark room. Fif-teen minutes were allowed for emission, followed by 8 min-utes for transmission. Axial, sagittal and coronal images were obtained and visualized in a three-dimensional mode. Two experienced nuclear medicine physicians, masked to the clinical and EEG findings of each patient, interpreted the PET findings. The two physicians agreed upon the lo-calization of the FDG signal in all patients.
Eight of the 46 patients who had intractable epilepsy with suspected epileptogenic area, underwent curative surgery, genic areas along with magnetic resonance imaging (MRI),
ictal/interictal single photon emission computed tomography and electroencephalography (EEG).1,2 PET is also useful in localizing epileptogenic areas and establishing surgical mar-gins in patients with temporal lobe epilepsy who do not pres-ent with discernible MRI findings.3,4 In particular, newly de-veloped PET and MRI coregistration can help to delineate surgical resection margins correlated with structural anatomy and improve surgical outcomes in discernible MRI findings.5 Generally, 2-deoxy-2-[18F] fluoro-D-glucose (FDG)-PET taken during the interictal period shows decreased glucose metabolism in epileptogenic areas. Hypermetabolism is evi-dent in FDG-PET during ictal periods.6,7 However, PET has a limitation of a less spatial relationship and false lateralization. In other words, FDG uptake includes a larger area than the epileptogenic area, which varies according to the intensity, duration, migration and timing of ictal events during an ictal period.8,9 FDG uptake can be occasionally influenced by in-terictal cortical activity, such as frequent spike activities or focal polymorphic slow waves.10-12 These symptoms are common in children with epilepsy. For these reasons, PET without corroborating EEG findings might misidentify the underlying epileptogenic area. Thus, the objective of our study was to demonstrate the association between EEG fea-tures and glucose metabolism in childhood partial epilepsy. We analyzed concordance between the degree of epilepti-form discharges, focal polymorphic slow waves, as well as the presence of ictal events and localization of abnormal FDG uptake.
MATERIALS AND METHODS
We retrospectively studied 46 patients (age range, 1-17.8 years; median, 7.3 years) with intractable childhood partial epilepsy who had received PET scans with simultaneous EEG and MRI to detect epileptogenic areas. The main epi-leptogenic region was the frontal area in 43.5% of the pa-tients (Table 1). Twenty two papa-tients exhibited a nonlesion-al MRI, 11 patients corticnonlesion-al dysplasia, four patients mesinonlesion-al temporal sclerosis, four patients periventricular leukomala-cia, four patients tumor and one patient an infarct. The main epileptogenic focus of nonlesional MRIs was also the fron-tal area in 50.0% of the patients. Patients with EEG-evi-denced bilateral synchrony, multifocal epileptogenic area or Rasmussen encephalitis were excluded.
[image:2.595.313.540.590.718.2]The EEG was performed during the 20 minutes before
Table 1. Clinical Characteristics of the Patients (n=46)
Median age (age range) 7.3 yrs (1 to 17.8 yrs)
Sex (male : female) 29 : 17
Mean duration of epilepsy (yrs)* 3.2±2.7
Age at seizure onset (yrs)* 4.5±3.4
Epileptogenic area
Frontal 20 (43.5%)
Temporal 8 (17.4%)
Parietal 4 (8.7%)
Occipital 6 (13.0%)
Multi-lobe (unilateral) 8 (17.4%)
waves did not influence each other, as shown by a multiple logistic regression.
RESULTS
Forty three patients showed an abnormal pattern of glucose metabolism, except for three patients with normo-metabo-lism. Abnormal patterns of glucose metabolism accompa-nied nonlesional MRI in 19 patients and lesional MRI in 24 patients. Interictal PET showed hypometabolism in 37 of 41 patients, whereas ictal PET revealed hypermetabolism in four out of five patients (Table 2). Whether or not pa-tients presented with lesional MRI did not influence the concordance between simultaneous EEG and PET.
The locations of spike/sharp waves according to their fre-quency were closely correlated with the abnormal areas on PET with an odds ratio of 1.35. Especially, a high frequen-cy of interictal spikes/sharps (>10 per minute) was well cor-related with PET hypometabolism. However, one patient exhibited more than 60 spike wave discharges per minute on EEG and showed an increase in glucose metabolism in the right temporal area despite interictal PET. The locations of focal polymorphic slow waves according to their severity were correlated with the area of hypometabolism with an odds ratio of 1.81 (Table 3). We also analyzed concordance between spike/sharp waves or focal polymorphic slow waves and hypometabolism at each location in p-values.
Five patients including two with subclinical ictal events experienced ictal events during FDG uptake (Table 4). Four patients who experienced seizures that lasted more than 20 seconds showed hypermetabolism in a suspected epilepto-genic area concordant with the ictal location. One patient with subclinical seizures that occurred several times, but were shorter than 20 seconds each, showed hypometabo-lism in the discordant area.
Of the eight patients who underwent surgical excision of with postoperative follow-up durations of 18-28 months.
Simultaneous EEG recordings during PET were also com-pared with MRI, video/EEG and the histopathological diag-nosis of the resected brain cortex.
[image:3.595.56.282.215.368.2]All data were analyzed by logistic regression and Fish-er’s exact test. SAS version 8.2 software (SAS Institute, Cary, NC, USA) was used for analyses. For all analyses, p -values <0.05 were considered statistically significant. Fac-tors such as spike/sharp waves and focal polymorphic slow
Table 2. Interictal and Ictal PET Findings by MRI Findings
PET findings Normal MRI findings
(n=22) Abnormal (n=24) Interictal (n=41)
Hypometabolism 15 22
Single lobe 11 19
Multi-lobe (unilateral) 4 3
Normo-metabolism 3 0
Hypermetabolism 1 0
Ictal (n=5)
Hypermetabolism 2 2
Hypometabolism 1 0
[image:3.595.56.282.414.544.2]PET, positron emission tomography; MRI, magnetic resonance imaging.
Table 3. Concordance between Simultaneous EEG and PET Findings
Patients (n) Concordance (%) Spike/sharp waves*
No/rare 15 0 (0)
Occasional 6 2 (33.3)
Frequent 20 16 (80.0)
Focal slow waves†
None 11 1 (9.1)
Infrequent 16 7 (43.8)
Intermediate 7 7 (100)
Continuous 7 6 (85.7)
EEG, electroencephalography; PET, positron emission tomography. *Odds ratio according to frequency of spike/sharp waves was 1.35 (p<0.05).
†Odds ratio according to severity of focal slow waves was 1.81 (p<0.05).
Table 4. Characteristics of Ictal Events in Simultaneous EEG and PET Findings
Sex/Age Clinical seizure Duration (sec) Onset* (min) EEG PET finding
M/5 Yes 20/30/20/120 8/9/11/12 Rt. T Hypermetabolism in Rt. T
F/6 No 12/7/6 5/7/8 Rt. O Hypometabolism in Lt. Motor cortex
M/16 Yes 60/30 8/12 Rt. F Hypermetabolism in Rt. F
F/2 Yes 30 12 Lt. FT Hypermetabolism in Lt. FT
F/3 No 30 10 Rt. F Hypermetabolism in Rt. F
Rt., right; Lt., left; F, frontal; T, temporal; O, occipital; EEG, electroencephalography; PET, positron emission tomography; FDG, 2-deoxy-2-[18F] fluoro-D-glucose.
[image:3.595.55.525.617.698.2]cose metabolism to change transiently in the epileptogenic region. In this study, areas of increase in the frequency of interictal spikes were well correlated with hypometabolism on PET, when compared to those of lower frequency. That is, 70.7% of all spikes in the anterior temporal area matched PET findings in temporal lobe epilepsy.14,15 Previously, PET localization using α-[11C]-Methyl-L-tryptophan was proven with interictal spike frequency in tuberous sclerosis.15 How-ever, a higher frequency of interictal spikes can result in a loss of PET coherence to the EEG features due to increases in neuronal activity requiring increased glucose metabo-lism. As shown in previous studies, a higher frequency of interictal spike results in synchronization, and the neuronal circuitry in the surrounding area shows paroxysmal burst fir-ing patterns.8,10,11 Moreover, interictal spikes at frequencies higher than 12 to 22 per minute reportedly exhibit increased metabolism in the affected areas.10 Our data showed a high association between the epileptogenic region of interictal spike/sharp categorized by frequency on simultaneous EEG and the localization of PET individually, especially in those with a high frequency of interictal spikes/sharps (>10 per minute). Interestingly, one patient with more than 60 spike wave discharges per minute showed hypermetabolism in-stead of hypometabolism in suspected epileptogenic areas, representing a metabolic change according to the frequency of interictal spikes. We cautiously argue that epileptogenic areas with a high frequency of interictal spikes/sharps (>10 per minute) might result in hypometabolism, but those with more than 60 spikes wave discharges per minute may result in hypermetabolism instead of hypometabolism.
Focal polymorphic slow waves, which suggest a possibili-ty of structural abnormalities, can also cause glucose me-tabolism to decrease in the epileptogenic area. The concor-their epileptic focus, six showed concordance between PET
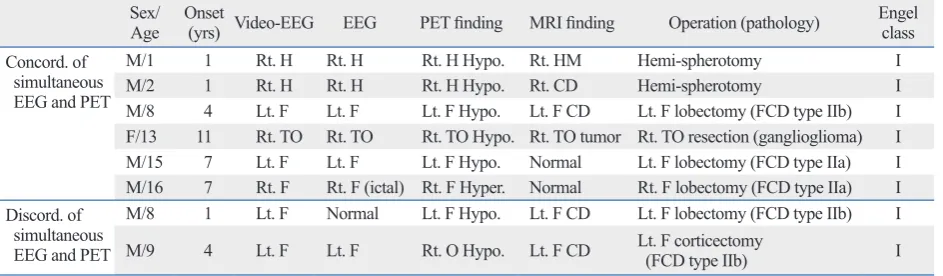
and simultaneous EEG findings, whereas two showed dis-cordance (Table 5). All patients showed the surgical out-come of Engle class I during follow-up duration and corti-cal dysplasia was most common in their histopathology. Video/EEG, PET and simultaneous EEG were helpful in detecting the epileptogenic area in two patients whose MRI showed negative findings among six patients with concor-dance of simultaneous EEG and PET findings. One patient showed right frontal hypermetabolism due to recurrent ictal events. In the two discordant patients, one was not exactly discordant, but rather inconclusive. In this patient the EEG performed during PET was normal, but the data provided by the video/EEG were concordant with the PET findings. Another showed an epileptogenic area in the left frontal area on the simultaneous EEG, video/EEG and MRI, but hypometabolism in the right occipital area on PET.
DISCUSSION
Several factors such as interictal spike/sharp, focal poly-morphic slow waves as well as the characteristics of the ic-tal event and subclinical seizures can influence metabolism during PET. We found that a higher frequency of interictal spikes and severity of focal polymorphic slow waves were concordant with the epileptogenic area between simultane-ous EEG and PET in childhood partial epilepsy. We also identified the utility of EEG to reduce instances of false lat-eralization in PET readings using simultaneous EEG. These findings were also confirmed by pathological diagnosis of the surgical cases.
Interictal spikes according to frequency can cause
glu-Table 5. Clinical Characteristics, Video-EEG, MRI and Surgical Outcomes Compared with Simultaneous EEG and PET Findings in Surgical Patients
Sex/
Age Onset (yrs) Video-EEG EEG PET finding MRI finding Operation (pathology) Engel class Concord. of
simultaneous EEG and PET
M/1 1 Rt. H Rt. H Rt. H Hypo. Rt. HM Hemi-spherotomy I
M/2 1 Rt. H Rt. H Rt. H Hypo. Rt. CD Hemi-spherotomy I
M/8 4 Lt. F Lt. F Lt. F Hypo. Lt. F CD Lt. F lobectomy (FCD type IIb) I
F/13 11 Rt. TO Rt. TO Rt. TO Hypo. Rt. TO tumor Rt. TO resection (ganglioglioma) I
M/15 7 Lt. F Lt. F Lt. F Hypo. Normal Lt. F lobectomy (FCD type IIa) I
M/16 7 Rt. F Rt. F (ictal) Rt. F Hyper. Normal Rt. F lobectomy (FCD type IIa) I Discord. of
simultaneous EEG and PET
M/8 1 Lt. F Normal Lt. F Hypo. Lt. F CD Lt. F lobectomy (FCD type IIb) I
M/9 4 Lt. F Lt. F Rt. O Hypo. Lt. F CD Lt. F corticectomy (FCD type IIb) I
[image:4.595.71.543.93.231.2]correlated with the PET findings, suggesting false lateral-ization.
Among 6 patients with concordance of EEG and PET findings who underwent surgical treatment, one patient with recurrent ictal events longer than 20 seconds showed right frontal hypermetabolism, which was confirmed by histo-pathologic findings of cortical dysplasia on the right frontal area, and who was classified as Engel class I (seizure free) after surgery. One discordant patient with right occipital hy-pometabolism confirmed by histopathological diagnosis underwent left frontal corticectomy, suggestive of false lat-eralization, and was also classified as Engel class I after surgery. Just as simultaneous EEG allows us to detect false lateralization on PET, PET/MRI coregistration makes it possible for us to detect epileptogenic areas that cannot be visually indentified on PET, as well as improve the detec-tion of cortical dysplasia and surgical prognoses in patients with epilepsy.5,19
In conclusion, simultaneous EEG can be used to confirm epileptogenic areas and minimize false lateralization in PET, which may show inconsistent abnormal metabolism related to the frequency of interictal spikes, focal polymorphic slow waves, or several factors associated with ictal events.8,21,23 Simultaneous EEG recording during PET can help detect underlying epileptogenic areas via review of various factors from EEG features during FDG uptake.
ACKNOWLEDGEMENTS
This work was supported by grant from Inje University College of Medicine, 2011.
REFERENCES
1. Kim S, Salamon N, Jackson HA, Blüml S, Panigrahy A. PET im-aging in pediatric neuroradiology: current and future applications. Pediatr Radiol 2010;40:82-96.
2. Swartz BE, Brown C, Mandelkern MA, Khonsari A, Patell A, Thomas K, et al. The use of 2-deoxy-2-[18F]fluoro-D-glucose (FDG-PET) positron emission tomography in the routine diagno-sis of epilepsy. Mol Imaging Biol 2002;4:245-52.
3. Lee SK, Yun CH, Oh JB, Nam HW, Jung SW, Paeng JC, et al. In-tracranial ictal onset zone in nonlesional lateral temporal lobe epi-lepsy on scalp ictal EEG. Neurology 2003;61:757-64.
4. Carne RP, O’Brien TJ, Kilpatrick CJ, MacGregor LR, Hicks RJ, Murphy MA, et al. MRI-negative PET-positive temporal lobe epi-lepsy: a distinct surgically remediable syndrome. Brain 2004;127 (Pt 10):2276-85.
dance between focal polymorphic slow waves and PET hypometabolism may be related to a similar electrical con-dition which is associated with primary epileptogenic ab-normality and a functional deficit of metabolism.12,16 In oth-er words, PET as well as focal polymorphic slow waves can detect epileptogenic areas with a functional deficit, al-though the structural lesions of epileptogenic areas are not detected by MRI due to invisible structural minimal chang-es such as focal cortical dysplasia type I.17 Our data showed that focal polymorphic slow waves were particularly useful for localizing the underlying cortical dysfunction, which might be correlated with epileptogenic areas in childhood partial epilepsy, including patients with nonlesional MRI. In the present study, we became concerned with whether the localized epileptogenic area represented by interictal spikes and focal polymorphic slow waves was a seizure focus or not. However, previous reports have indicated that the loca-tion of the epileptogenic area in EEG closely matched the foci of hypometabolism on PET, and the area of ictal onset and propagation in surgical cases showed slight hypome-tabolism in PET/MRI coregistration.12,14,16,18,19
the epileptogenic tuber and correlates with interictal spike fre-quency. Epilepsy Res 2003;52:203-13.
16. Koutroumanidis M, Binnie CD, Elwes RD, Polkey CE, Seed P, Alarcon G, et al. Interictal regional slow activity in temporal lobe epilepsy correlates with lateral temporal hypometabolism as im-aged with 18FDG PET: neurophysiological and metabolic impli-cations. J Neurol Neurosurg Psychiatry 1998;65:170-6.
17. Blümcke I, Thom M, Aronica E, Armstrong DD, Vinters HV, Palmini A, et al. The clinicopathologic spectrum of focal cortical dysplasias: a consensus classification proposed by an ad hoc Task Force of the ILAE Diagnostic Methods Commission. Epilepsia 2011;52:158-74.
18. Alkonyi B, Juhász C, Muzik O, Asano E, Saporta A, Shah A, et al. Quantitative brain surface mapping of an electrophysiologic/meta-bolic mismatch in human neocortical epilepsy. Epilepsy Res 2009; 87:77-87.
19. Chassoux F, Rodrigo S, Semah F, Beuvon F, Landre E, Devaux B, et al. FDG-PET improves surgical outcome in negative MRI Tay-lor-type focal cortical dysplasias. Neurology 2010;75:2168-75. 20. Engel J Jr, Kuhl DE, Phelps ME, Mazziotta JC. Interictal cerebral
glucose metabolism in partial epilepsy and its relation to EEG changes. Ann Neurol 1982;12:510-7.
21. Barrington SF, Koutroumanidis M, Agathonikou A, Marsden PK, Binnie CD, Polkey CE, et al. Clinical value of “ictal” FDG-posi-tron emission tomography and the routine use of simultaneous scalp EEG studies in patients with intractable partial epilepsies. Epilepsia 1998;39:753-66.
22. Chugani HT, Shewmon DA, Sankar R, Chen BC, Phelps ME. In-fantile spasms: II. Lenticular nuclei and brain stem activation on positron emission tomography. Ann Neurol 1992;31:212-9. 23. Sperling MR, Alavi A, Reivich M, French JA, O’Connor MJ.
False lateralization of temporal lobe epilepsy with FDG positron emission tomography. Epilepsia 1995;36:722-7.
5. Salamon N, Kung J, Shaw SJ, Koo J, Koh S, Wu JY, et al. FDG-PET/MRI coregistration improves detection of cortical dysplasia in patients with epilepsy. Neurology 2008;71:1594-601.
6. Henry TR, Engel J Jr, Mazziotta JC. Clinical evaluation of interic-tal fluorine-18-fluorodeoxyglucose PET in partial epilepsy. J Nucl Med 1993;34:1892-8.
7. Juhász C, Chugani DC, Muzik O, Watson C, Shah J, Shah A, et al. Relationship between EEG and positron emission tomography ab-normalities in clinical epilepsy. J Clin Neurophysiol 2000;17:29-42. 8. Chugani HT, Shewmon DA, Khanna S, Phelps ME. Interictal and
postictal focal hypermetabolism on positron emission tomography. Pediatr Neurol 1993;9:10-5.
9. Chugani HT, Rintahaka PJ, Shewmon DA. Ictal patterns of cere-bral glucose utilization in children with epilepsy. Epilepsia 1994; 35:813-22.
10. Bittar RG, Andermann F, Olivier A, Dubeau F, Dumoulin SO, Pike GB, et al. Interictal spikes increase cerebral glucose metabo-lism and blood flow: a PET study. Epilepsia 1999;40:170-8. 11. Handforth A, Finch DM, Peters R, Tan AM, Treiman DM.
Interic-tal spiking increases 2-deoxy[14C]glucose uptake and c-fos-like reactivity. Ann Neurol 1994;35:724-31.
12. Erbayat Altay E, Fessler AJ, Gallagher M, Attarian HP, Dehdashti F, Vahle VJ, et al. Correlation of severity of FDG-PET hypome-tabolism and interictal regional delta slowing in temporal lobe epi-lepsy. Epilepsia 2005;46:573-6.
13. Asano E, Benedek K, Shah A, Juhász C, Shah J, Chugani DC, et al. Is intraoperative electrocorticography reliable in children with intractable neocortical epilepsy? Epilepsia 2004;45:1091-9. 14. Hong SB, Han HJ, Roh SY, Seo DW, Kim SE, Kim MH.
Hypome-tabolism and interictal spikes during positron emission tomography scanning in temporal lobe epilepsy. Eur Neurol 2002;48:65-70. 15. Fedi M, Reutens DC, Andermann F, Okazawa H, Boling W,