© Associated Asia Research Foundation (AARF)
A Monthly Double-Blind Peer Reviewed Refereed Open Access International e-Journal - Included in the International Serial Directories.
Page | 74
ROLE OF PRIMARY AGRICULTURE CO-OPERATIVE SOCIETIES
IN ECONOMIC DEVELOPMENT
Vinod Kumar
Junior Lecturer, Economics, G.S.S. School Jatu Lohari, Bhiwani.
ABSTRACT
Primary Agricultural Co-operative Societies (PACSs) are providing agricultural credit to farmers, distributing agricultural inputs like seeds, fertilizers, pesticides, agricultural implements and machinery, providing facilities for marketing of agricultural produce, and inculcating the habit of thrift and savings. PACS are playing an important role in improving the economic and social conditions of the common masses of India. They provide short-term and medium-term loan to the members and farmers at reasonable interest rates to meet their various needs. The study findings that the number of viable PACS, deposits, borrowing, number of borrowers and total loan issued by the Primary Agriculture Co-operative Societies in India has increased significantly during the period from 2004-05 to 2014-15 in India. Keywords: Agriculture credit, borrowers and deposits.
Introduction
Primary agriculture credit societies mean a co-operative society. Primary Agriculture Co-operative Societies (PACS) are also known as “Mini Banks” or “Rural Credit Banks”. Primary Agricultural Credit Societies are the foundation of the co-operative credit structure in
India. The first Primary Agriculture Co-operative Societies was organized in India in 1904. PACS are playing an important role in improving the economic and social conditions of the
common masses of India. They provide short-term and medium-term loan to the members and farmers at reasonable interest rates to meet their various needs. The loans are given to members for the purchase of cattle, fertilizers, pesticides, etc.
International Research Journal of Human Resources and Social Sciences
ISSN(O): (2349-4085) ISSN(P): (2394-4218) Impact Factor- 5.414, Volume 5, Issue 01, January 2018
Website- www.aarf.asia, Email : [email protected] , [email protected]
© Associated Asia Research Foundation (AARF)
A Monthly Double-Blind Peer Reviewed Refereed Open Access International e-Journal - Included in the International Serial Directories.
Page | 75
Co-operative Credit Structure in India
The structure consist of Co-operative credit in India can be divided into two broad category.
1. Urban Co-operative Banks:
Urban co-operative banks, though not formally defined, refer to primary co-operative bank located in urban and semi urban areas. These banks till 1996 were allowed to lend money only for non-agriculture purposes.
2. Rural Co-operative Banks:
Rural co-operative banks are divided in to short-term and long-term credit structure. The
short-term co-operative banks are three tiered operating in different states. The District Central Co-operative banks are affiliated members of respective State Co-operative banks.
Similarly, the societies are constituents of the respective district central co-operative banks. The central co-operative banks are called autonomous units subject to excess control and supervision of registrar co-operative societies.
Short term credit (Three Tier Systems)
The short-term credit not exceeds 15 month and medium term credit range 15 month to 5 year.
State Co-operative Banks (SCBs): They operate at the apex level in the state. District Central Co-operative Banks (DCCBs): They operate at the District levels. Primary Agriculture Co-operative Societies (PACS): They operate at the village or
grass-root level.
Long term credit (Two tiers System)
© Associated Asia Research Foundation (AARF)
A Monthly Double-Blind Peer Reviewed Refereed Open Access International e-Journal - Included in the International Serial Directories.
Page | 76
Co-operative Credit Structure in India
Particulars India
Short-term and Medium term credit (Three tier System)
State Co-operative Banks (SCBs) 31
District Central Co-operative Banks (DCCBs) 370
Primary Agriculture Co-operative Societies (PACS) 97289
Long term credit (Two tier System)
State Co-operative Agriculture and Rural development Banks (SCARDBs)
20
Primary Co-operative Agriculture and Rural Development Banks (PCARDBs)
697
Source: Performance of Primary Agriculture Credit Societies for Various years.
Objective of the Study
1. To analyze the Cooperative Credit structure in India.
2. To analyze the Role of Primary Agriculture Cooperative Societies in Economic Development in India.
Research Methodology
© Associated Asia Research Foundation (AARF)
A Monthly Double-Blind Peer Reviewed Refereed Open Access International e-Journal - Included in the International Serial Directories.
Page | 77
Findings of the study
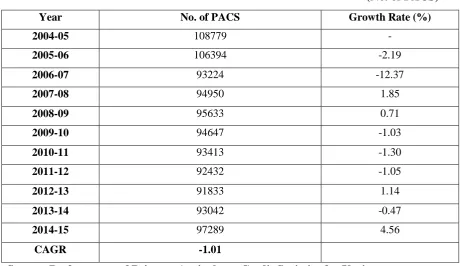
[image:4.595.65.527.109.375.2]No. of PACS
Table-1
(No. of PACS)
Source: Performance of Primary Agriculture Credit Societies for Various years.
Table 1 shows the number of primary agriculture co-operative societies have decreased from 108779 in 2004-05 to 97289 in 2014-15 i.e. decrease of 0.89 times. The compound annual growth rate of it accounts for -1.01 percent per annum during the study period. The highest growth rate of no. of PACS has 45.89 per cent during the period 2009-10.
Year No. of PACS Growth Rate (%)
2004-05 108779 -
2005-06 106394 -2.19
2006-07 93224 -12.37
2007-08 94950 1.85
2008-09 95633 0.71
2009-10 94647 -1.03
2010-11 93413 -1.30
2011-12 92432 -1.05
2012-13 91833 1.14
2013-14 93042 -0.47
2014-15 97289 4.56
© Associated Asia Research Foundation (AARF)
A Monthly Double-Blind Peer Reviewed Refereed Open Access International e-Journal - Included in the International Serial Directories.
Page | 78
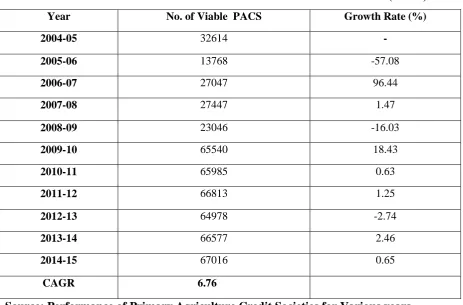
[image:5.595.67.531.89.394.2]NO. of Viable PACS
Table-2
(in 000)
Source: Performance of Primary Agriculture Credit Societies for Various years.
Table 2 shows the number of viable primary agriculture co-operative societies has increased from 32614 in 2004-05 to 67016 in 2014-15 i.e. an increase of 2.05 times. The compound annual growth rate of it accounts for 6.76 percent per annum during the study period. The highest growth rate of no. of viable PACS has 96.44 per cent during the period 2006-07.
Year No. of Viable PACS Growth Rate (%)
2004-05 32614 -
2005-06 13768 -57.08
2006-07 27047 96.44
2007-08 27447 1.47
2008-09 23046 -16.03
2009-10 65540 18.43
2010-11 65985 0.63
2011-12 66813 1.25
2012-13 64978 -2.74
2013-14 66577 2.46
2014-15 67016 0.65
© Associated Asia Research Foundation (AARF)
A Monthly Double-Blind Peer Reviewed Refereed Open Access International e-Journal - Included in the International Serial Directories.
Page | 79
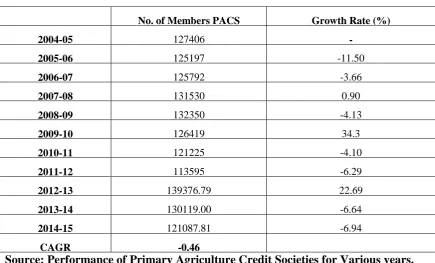
[image:6.595.67.503.92.355.2]NO. of Members PACS
Table-3
(in 000)
Source: Performance of Primary Agriculture Credit Societies for Various years.
Table 3 shows the number of members of primary agriculture co-operative societies has decreased from 127406 in 2004-05 to 121087.81 in 2014-15 i.e. decrease of 0.95 times. The compound annual growth rate of it accounts for -0.46 percent per annum during the study period. The highest growth rate of no. of membership of PACS has 34.3 per cent during the period 2009-10.
No. of Members PACS Growth Rate (%)
2004-05 127406 -
2005-06 125197 -11.50
2006-07 125792 -3.66
2007-08 131530 0.90
2008-09 132350 -4.13
2009-10 126419 34.3
2010-11 121225 -4.10
2011-12 113595 -6.29
2012-13 139376.79 22.69
2013-14 130119.00 -6.64
2014-15 121087.81 -6.94
© Associated Asia Research Foundation (AARF)
A Monthly Double-Blind Peer Reviewed Refereed Open Access International e-Journal - Included in the International Serial Directories.
Page | 80
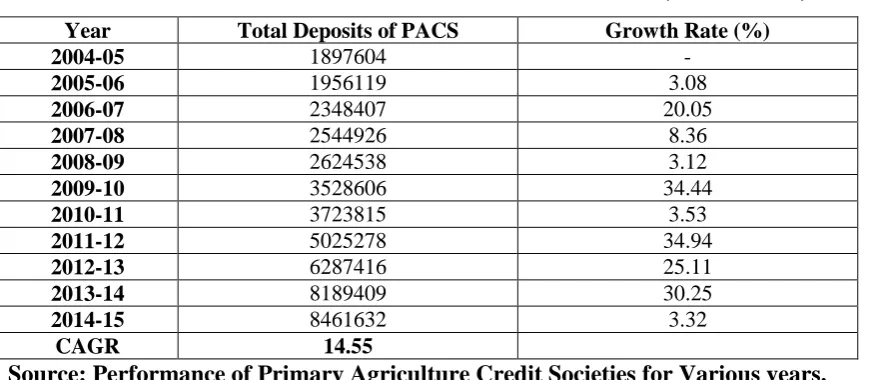
[image:7.595.68.503.90.280.2]Total Deposits of PACS
Table-4
(Rs. In Lakhs)
Source: Performance of Primary Agriculture Credit Societies for Various years.
Table 4 shows the deposits of primary agriculture co-operative societies has increased from 1897604.00 in 2004-05 to 8461632.00 in 2014-15 i.e. an increase of 4.45 times. The compound annual growth rate of it accounts for 14.55 percent per annum during the study period. The highest growth rate of total deposits of PACS has 34.94 per cent during the period 2011-12.
Total Borrowings of PACS
Table-5
(Rs. In Lakhs)
Source: Performance of Primary Agriculture Credit Societies for Various years.
Table 5 shows the borrowings of primary agriculture co-operative societies has increased from 4024949.00 in 2004-05 to 9998011.00 in 2014-15 i.e. an increase of 2.48 times. The compound annual growth rate of it accounts for 8.62 percent per annum during the study
Year Total Deposits of PACS Growth Rate (%)
2004-05 1897604 -
2005-06 1956119 3.08
2006-07 2348407 20.05
2007-08 2544926 8.36
2008-09 2624538 3.12
2009-10 3528606 34.44
2010-11 3723815 3.53
2011-12 5025278 34.94
2012-13 6287416 25.11
2013-14 8189409 30.25
2014-15 8461632 3.32
CAGR 14.55
Year Borrowings of PACS Growth Rate (%)
2004-05 4024949 -
2005-06 4101760 1.90
2006-07 4371449 6.57
2007-08 4784797 9.47
2008-09 4893844 2.27
2009-10 5176389 5.57
2010-11 5400009 4.31
2011-12 8883556 64.50
2012-13 11565823 29.85
2013-14 9583580 -17.13
2014-15 9998011 4.32
[image:7.595.65.517.455.642.2]© Associated Asia Research Foundation (AARF)
A Monthly Double-Blind Peer Reviewed Refereed Open Access International e-Journal - Included in the International Serial Directories.
Page | 81 period. The highest growth rate of borrowing of PACS has 64.50 per cent during the period 2011-12.
NO. Of Borrowers PACS
Table-6
(In Thousands)
[image:8.595.65.525.137.454.2]Source: Performance of Primary Agriculture Credit Societies for Various years.
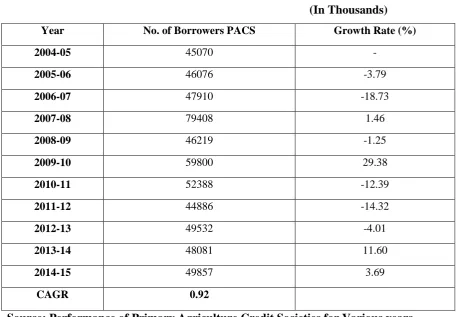
Table 6 shows the borrowers of primary agriculture co-operative societies has increased from 45070 in 2004-05 to 49857 in 2014-15 i.e. an increase of 1.10 times. The compound annual growth rate of it accounts for 0.92 percent per annum during the study period. The highest growth rate of borrowers of PACS has 29.38 per cent during the period 2009-10.
Year No. of Borrowers PACS Growth Rate (%)
2004-05 45070 -
2005-06 46076 -3.79
2006-07 47910 -18.73
2007-08 79408 1.46
2008-09 46219 -1.25
2009-10 59800 29.38
2010-11 52388 -12.39
2011-12 44886 -14.32
2012-13 49532 -4.01
2013-14 48081 11.60
2014-15 49857 3.69
[image:8.595.66.522.151.445.2]© Associated Asia Research Foundation (AARF)
A Monthly Double-Blind Peer Reviewed Refereed Open Access International e-Journal - Included in the International Serial Directories.
Page | 82
Total Loan and Advanced Issued of PACS
Table-7
(Rs. In Lakhs)
Year Total loan and Advanced issued Growth Rate
2004-05 3921172 -
2005-06 4291965 9.45
2006-07 4961275 15.59
2007-08 5764248 16.18
2008-09 5878674 1.98
2009-10 7493753 27.47
2010-11 9130382 21.83
2011-12 10730023 17.51
2012-13 16190916 50.59
2013-14 17141956 5.87
2014-15 15905029 -7.21
CAGR 13.57
Source: Performance of Primary Agriculture Credit Societies for Various years.
Table 7 shows that the total loan and advanced issued by primary agriculture co-operative societies has increased from 3921172 in 2004-05 to 15905029 in 2014-15 i.e. an increase of 4.05 times. The compound annual growth rate of it accounts for 13.57 percent per annum during the study period. The highest growth rate of total loan and advanced issued of PACS has 50.89 per cent during the period 2012-13.
Loan Outstanding of PACS
Total-8
(Rs. In Laks)
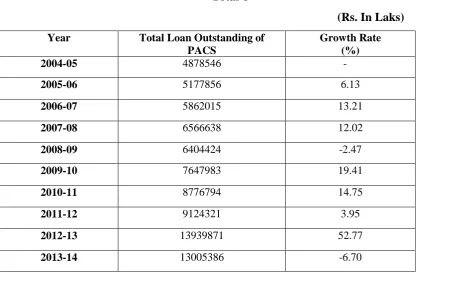
Year Total Loan Outstanding of
PACS
Growth Rate (%)
2004-05 4878546 -
2005-06 5177856 6.13
2006-07 5862015 13.21
2007-08 6566638 12.02
2008-09 6404424 -2.47
2009-10 7647983 19.41
2010-11 8776794 14.75
2011-12 9124321 3.95
2012-13 13939871 52.77
[image:9.595.66.530.90.281.2] [image:9.595.67.521.446.728.2]© Associated Asia Research Foundation (AARF)
A Monthly Double-Blind Peer Reviewed Refereed Open Access International e-Journal - Included in the International Serial Directories.
Page | 83
2014-15 14722557 13.20
CAGR 10.56
Source: Performance of Primary Agriculture Credit Societies for Various years.
Table 8 indicates that the total loan outstanding by primary agriculture co-operative societies has increased from Rs. 4887282 Lakhs in 2004-05 to Rs. 14722557 Lakhs in 2014-15 in India. The compound annual growth rate of it accounts for 10.56 percent per annum during the study period. The highest growth rate of total loan outstanding of PACS has 52.77 per cent during the period 2012-13.
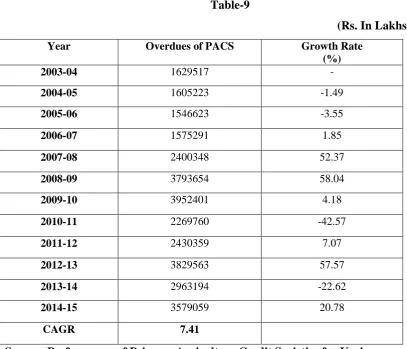
Overdues of PACS
Table-9
(Rs. In Lakhs)
Year Overdues of PACS Growth Rate
(%)
2003-04 1629517 -
2004-05 1605223 -1.49
2005-06 1546623 -3.55
2006-07 1575291 1.85
2007-08 2400348 52.37
2008-09 3793654 58.04
2009-10 3952401 4.18
2010-11 2269760 -42.57
2011-12 2430359 7.07
2012-13 3829563 57.57
2013-14 2963194 -22.62
2014-15 3579059 20.78
CAGR 7.41
Source: Performance of Primary Agriculture Credit Societies for Various years.
[image:10.595.67.475.248.597.2]© Associated Asia Research Foundation (AARF)
A Monthly Double-Blind Peer Reviewed Refereed Open Access International e-Journal - Included in the International Serial Directories.
Page | 84
Conclusion
The study findings that the number of viable PACS, deposits, borrowing, number of borrowers and total loan issued by the Primary Agriculture Co-operative Societies in India has increased significantly during the period from 2004-05 to 2014-15. But the total no. of PACS and number of members has decreased of PACS during the study period.
Reference
Annual Report of National Federation of State Co-operative bank, various issues from
2004-05 to 2014-15.
Tamilarasu A. (2014) “Role of banking sector on Financial Inclusion”, GALAXY
International Interdisciplinary Research Journal, Vol. 2, issue 2.
Vijaykumar J. Jasva (2016) “Financial Performance of Primary Agricultural Co-operative Credit Societies in India”, International Journal of Advance Scientific
Research & Development Volume 3, Issue 1.
Vijaykumar J. Jasva and Sukumar S. (2014) “Role of Primary Agricultural