International Research Journal of Management and Commerce Vol. 4, Issue 6, June 2017 Impact Factor- 5.564
ISSN: (2348-9766)
© Associated Asia Research Foundation (AARF)
Website: www.aarf.asiaEmail : [email protected] , [email protected]
“PORT USERS LEVEL OF SATISFACTION TOWARDS CARGO
HANDLING PROCESS- AN ANALYTICAL STUDY”
Mr. L. Prakash,MIB,M.Com.,M.Com (CA).,NET.,PGDBA.,1
Dr. B. Thangaraj, M.Com (CA). M.Phil., Ph.D.,2
1
Ph.D Research Scholar
2
Assistant Professor, Department of Commerce, Government Arts College Udhagamandalam, Tamilnadu, India.
ABSTRACT
This study has focused on analyzing the procedure of Cargo handling through Chennai Port
trust. The scope of the study is restricted to 100 customers only. Findings and conclusion
given in the study may help the Port trust to take effective step and improving the Cargo
handling process.
Keywords:Port Users, Cargo Handling Process, Users Satisfaction.
1. INTRODUCTION
Port is a place where facilities are provided for the ships and other Sea going Crafts to take
shelter, have and facilities for unloading and loading, for fuelling, and for taking fresh waters
and such facilities as may be required by them.
Various types of Export & Import cargoes are handled at each Port for International Trade as
well as Coastal Trade. The Export Cargoes are those cargoes which are loaded in a ship and
go out of the Port and or to the country. The Import Cargoes are the various types of Export
& Import cargoes are handled at each Port for International Trade as well as Coastal Trade.
The Export Cargoes are those cargoes which are loaded incoming cargo from outside the
For handling various cargoes as well as for shipping movements and/or Marine Operation
within and outside the Port, a no. of equipment are needed to support the services to be
rendered to the Port Users.
2. OBJECTIVE
To find the level of satisfaction in the Cargo and handling process.
To determine the most used type equipment for Cargo handling.
3. RESEARCH METHODOLOGY
3.1 RESEARCH
Research can be defined as “a scientific and systematic search for pertinent information on a specific topic”. The Advanced Learners Dictionary of current English gives the meaning of research as “a careful investigation or inquiry especially through search for new facts in any branch of knowledge”.
3.2 RESEARCH DESIGN
Research design stands for advanced planning of methods to be adopted for
collecting the relevant data and the techniques to be used in their analysis keeping in view the
objective of the research. The present study is based on survey and fact-findings enquiries
with the customers. Here the descriptive method of research has been followed.
3.3 SAMPLING UNIT
The sampling unit for present study is port users in Chennai PortTrust.
3.4 SAMPLING TECHNIQUE
We have used convenience sampling technique to collect the required
information from the respondents.
3.5 SAMPLE SIZE
The total sample size selected for the present study is 100 customers from
Chennai Port Trust.
3.6 DATA COLLECTION
Primary Data are that, which are collected afresh and for the first time and
happens to be original in character. Here the primary data was collected using a structured
questionnaire from various respondents among port users. The respondents were contacted
personally.
Secondary data was collected for port related information from the internal
4.DATA ANALYSIS AND INTERPRETATION
4.1.Chi-squre Test
Ho: There is no significant difference between responses regarding satisfaction in cargo handling
process.
Observed N Expected
N
Residual
Strongly Agree 9 25% -16%
Agree 79 25% 54%
Can't say 7 25% -18%
Disagree 5 25% -20%
Total 100
Step.1: Formula:
Chi Square: X2= £[ (Oij - Eij)]2Eij
Where:
Oij = Observed frequency of the cell in the ithrow and jthcolumn. Eij = Expected frequency of
the cell in the ith row and jth column.
Step.2: Expected frequency and Chi-square value
E= N/ n
E= 100/ 4=25
Chi-Square
Df
Asymp
Sig
155.840
3
.00
O E O-E (O-E)2 (O-E)2/ E
Strongly Agree 9 25.0 -16.0 256 256/25
Agree 79 25.0 54.0 2916 2916/25
Can't say 7 25.0 -18.0 324 324/25
Disagree 5 25.0 -20.0 400 400/25
Calculated value of chi-square= 155.840
Degrees of freedom= 3
Table value of chi-square = 7.81
P value= <0.001
Inference
Since the calculated value of p is less than 0.05, therefore the null hypothesis is rejected. So we
conclude that there is a significant difference between responses regarding satisfaction in
cargo handling process.i.e., Maximum number of respondents are agreed that the Cargo
handling process is good.
4.2. T-TEST
T-test is any statistical hypothesis test in which the test statistic follows a Student's t distribution
if the null hypothesis is true. It is most commonly applied when the test statistic would follow a
normal distribution if the value of a scaling term in the test statistic were known. When the
scaling term is unknown and is replaced by an estimate based on the data, the test statistic (under
certain conditions) follows a Student's t distribution.
Most t-test statistics have the form T = Z/s, where Z and s are functions of the data. Typically, Z
is designed to be sensitive to the alternative hypothesis (i.e. its magnitude tends to be larger when
the alternative hypothesis is true), whereas s is a scaling parameter that allows the distribution of
T to be determined.
The assumptions underlying a t-test are that
• Z follows a standard normal distribution under the null hypothesis
• ps2 follows a x2 distribution with p degrees of freedom under the null hypothesis, where p is a
positive constant
• Z and s are independent.
The Independent Samples T Test compares the mean scores of two groups on a given variable.
Under the Analyze menu, choose Compare Means, the Independent Samples T Test. Move your
dependent variable into the box marked "Test Variable." Move your independent variable into
the box marked "Grouping Variable." Click on the box marked "Define Groups" and specify the
value labels of the two groups you wish to compare.
x 1- x 2
t =
S 21 S 22
--- 1 ---
N
1 N2
Ho: There is no significant difference between the respondents regarding own equipment for
handling cargos.
Step.1:
Group Statistics
Own Std. Std. Error
equipment N Mean Deviation Mean
Avg_Score Yes 47 2.8865 .48293 .07044
No 53 3.1195 .49396 .06785
Independent Samples Test
Levene's Test for Equality
OfVariances
T-test for Equality of Means
Sig.(2- tailed)
Mean Difference
Std. Error Difference
95% Confidence Interval of the Difference
Sig. T df Lower Upper
Avg_ Score
Equal variances assumed
.712 .401 -2.379 98 .19 -.23297 .9794 -.42733 -.3862
Equal
variances not assumed
-2.382 97.51 .19 -.23297 .9780 -.42709 -.3886
Step.2: Formula
x 1— x 2
t =
S 21 S 22
--- 1 ---
N
t= (2.88- 3.11)/V (0.48)2/47 + (0.49)2/53 t= 2.379
[image:6.595.67.567.526.779.2]Calculated value of t= 2.379 Degrees of freedom= 98
Table value of t = 1.96
P value = 0.019
Inference
Since the calculated value of p is less than 0.05, therefore the null hypothesis is rejected. So we
conclude that respondents having own equipment are more satisfied in handling cargos.
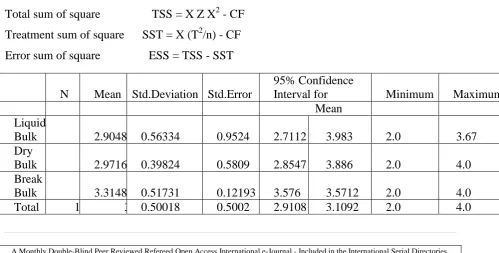
4.3ANALYSIS OF VARIANCE
In statistics, analysis of variance (ANOVA) is a collection of statistical models, and their
associated procedures, in which the observed variance is partitioned into components due to
different explanatory variables. In its simplest form ANOVA provides a statistical test of whether
or not the means of several groups are all equal, and therefore generalizes Student's two-sample
i-test to more than two groups. ANOVAs are helpful because they possess a certain advantage over
a two-sample t-test. Doing multiple two-sample t-tests would result in a largely increased chance
of committing a type I error.
One-way ANOVA is used to test for differences among two or more independent groups.
Typically, however, the one-way ANOVA is used to test for differences among at least three
groups, since the two-group case can be covered by a t-test (Gosset, 1908). When there are only
two means to compare, the t-test and the F-test are equivalent; the relation between ANOVA and
is given by F = i2.
Total sum of square TSS = X Z X2 - CF
Treatment sum of square SST = X (T2/n) - CF
Error sum of square ESS = TSS - SST
N Mean Std.Deviation Std.Error
95% Confidence
Interval for Minimum Maximum
Mean
Liquid
Bulk 35 2.9048 0.56334 0.9524 2.7112 3.983 2.0 3.67
Dry
Bulk 47 2.9716 0.39824 0.5809 2.8547 3.886 2.0 4.0
Break
Bulk 18 3.3148 0.51731 0.12193 3.576 3.5712 2.0 4.0
Ho: There is no significant difference between the types of cargos regarding satisfaction for
handling cargo
Total sum of square TSS = X X X2 - CF
= 24.768
Treatment sum of square SST = X (T2/n) - CF
= 2.129
Error sum of square ESS = TSS - SST
= 22.639
ANOVA
Sum of
Squares df Mean Square F Sig.
Between Groups 2.129 2 1.65 4.562 .13
Within Groups 22.639 97 .233
Total 24.768 99
Inference
Since the calculated value of p is less than 0%5, therefore the null hypothesis is rejected. So we
conclude that there is significant difference between the types of cargos regarding
satisfaction for handling cargo .i.e., Maximum number of respondents are satisfied for handling
Liquid Bulk & Dry Bulk cargo types.
4.4 CORRELATION
In statistics, correlation and dependence are any of a broad class of statistical relationships
between two or more random variables or observed data values. In general statistical usage,
correlation or co-relation can refer to any departure of two or more random variables from
independence, but most commonly refers to a more specialized type of relationship between
mean values. There are several correlation coefficients, often denoted p or r, measuring the
degree of correlation. The most common of these is the Pearson correlation coefficient, which is
mainly sensitive to a linear relationship between two variables. Other correlation coefficients
have been developed to be more robust than the Pearson correlation, or more sensitive to
nonlinear relationships.
The degree of dependence between variables X and Y should not depend on the scale on which
the variables are expressed. Therefore, most correlation measures in common use are invariant to
location and scale transformations of the marginal distributions. That is, if we are analyzing the
bX and Y to c + dY, where a, b, c, and d are constants. This is true of most correlation statistics
as well as their population analogues. Some correlation statistics, such as the rank correlation
coefficient, are also invariant to monotone transformations of the marginal distributions of X
and/or Y.
Formula
r = J XY
Vjx2 jy2
Ho : Null Hypothesis : There is a possibility of using the equipments for different types of cargos
effectively.
X Y X2 Y2 XY
23 7 529 49 161
75 82 5625 6724 6150
2 8 4 64 16
0 3 0 9 0
100 100 6158 6846 6327
r = J XY
r = 6327^6158 x 6846
r = 6327= 0.98
6492.89
r = 0.98
Inference
Since t he cal cul at ed val ue co - effi ci ent and correl ation i ndi cates 0.98.
We conclud e that the usage of equip men t is full y dep ending on types of
cargos and th ei r handling
5. SUGGESTIONS AND RECOMMENDATIONS
> Number of free days offered for handling of import and export cargo should be increased.
Charges used for handling Import and Export cargo must be decreased.
> Also to reduce man power in Chennai port automatic handling of cargo should be
encouraged more.
> This will also enable to handle the cargo easily and much quicker compared to manual
> Most of the Respondents feel that Transport facility provided is not sufficient, So the
Transport facility provided by Chennai Port Trust must be improved.
> Chennai Port can improve their Safety Procedures for handling of Cargo.
> Most of the Respondent feels that there is no enough lightening around Chennai port, So
Lightening can be improved.
> The Infrastructure around Chennai port is not clean to carry clean cargo, in order to carry
clean cargo the infrastructure and cleanliness must be well maintained.
6.CONCLUSION
Majority of the respondents use Ship crane for cargo And they feel that the Cargo handling
process is good in Chennai port and Import and export documentation procedure is simple in
Chennai port, But most of them were dissatisfied with the free days offered for handling of
Import and Export cargo and half of them dissatisfied with the charges used for handling Import
and Export cargo.Therefore the study concludes the most of the equipment’s used for Cargo
handling is best in Chennai Port Trust.
Reference Books
• Marketing Management by Philip Kotler. • Research methodology by C.R.KOTHARI. • Cargo Handling By John R. Immer.
Search Engines
•Company Website: www.chennaiport.gov.in
www.wikipedia.com