activity patterns in elite race walkers. Slovak Journal of Sport Science, 2 (1). ISSN 2453-9325
Link to Leeds Beckett Repository record:
http://eprints.leedsbeckett.ac.uk/4022/
Document Version:
Article
Creative Commons: Attribution 4.0
The aim of the Leeds Beckett Repository is to provide open access to our research, as required by
funder policies and permitted by publishers and copyright law.
The Leeds Beckett repository holds a wide range of publications, each of which has been
checked for copyright and the relevant embargo period has been applied by the Research Services
team.
We operate on a standard take-down policy.
If you are the author or publisher of an output
and you would like it removed from the repository, please
contact us
and we will investigate on a
case-by-case basis.
1
GENDER AND AGE-GROUP DIFFERENCES IN HIP MUSCLE ACTIVITY
PATTERNS IN ELITE RACE WALKERS
Brian HANLEY, Athanassios BISSAS, Andrew DRAKE Carnegie School of Sport, Leeds Beckett University, United Kingdom
Original scientific paper
Key words:
athletes, electromyography, gait, track and field
Race walking is a complex activity that relies on considerable power generation by the muscles at the hip joint. Little is known, however, whether differences are present in terms of muscle activity patterns between men and women, or between younger and older athletes. The purpose of this study was to compare hip muscle activity patterns in elite male and female race walkers across U20 and senior age groups. Ten male and ten female race walkers participated, with five U20 and five senior athletes of each gender. The athletes were recorded using high-speed videography (100 Hz) as they race walked down a 40 m runway, during which the muscle activity of the gluteus medius, gluteus maximus, biceps femoris and rectus femoris was recorded using electromyography (EMG) (1000 Hz). The hip sagittal angle was calculated from digitised data, and average rectified EMG used to identify visual differences between groups. No differences were found using ANOVA between any groups for the activity of any of the four muscles analysed at toe-off, midswing, heel-strike and midstance, although there were visual differences in activity timings. Overall the few differences between groups showed that race walking techniques are comparable across trained athletes and coaches can adopt similar training practices when developing the muscular qualities of their athletes.
INTRODUCTION
Race walking is a complex form of gait that requires both muscular strength and endurance to achieve fast and legal technique. Some of the most important muscles in race walking are those at the hip joint (Cairns, Burdette, Pisciotta, et al.,1986; Hoga, Ae, Enomoto, et al., 2003; Hoga, Ae, Enomoto, et al., 2006; Hoga-Miura, Ae, Fujii, et al., 2016). These include hip flexors (e.g., rectus femoris), hip extensors (e.g., gluteus maximus) and hip abductors (e.g., gluteus medius). Hip joint movements in the sagittal plane are particularly important because coaches of race walkers have suggested that athletes with larger hip flexion angles at contact and larger hip hyperextension angles at toe-off can achieve longer step lengths (McGuire, 1989). The angular velocity of the hip joint movements, and not just the range of movement, can also clearly differentiate between
quicker and slower race walkers (Murray, Guten, Mollinger, et al., 1983; Hanley, Bissas & Drake, 2008). With regard to other planes of movement, the gluteus medius is potentially crucial in race walking, more so than in other forms of gait, because of its role in controlling pelvic obliquity (Hanley & Bissas, 2016), which is pronounced because of the straightened knee rule.
2 results were found by Padulo, Annino, Tihanyi, et al. (2013) who compared electromyography (EMG) patterns between different slopes and speeds; at a 0% gradient, there appeared to be less biceps femoris activity at initial contact and more rectus femoris activity during mid- to late stance compared with Murray, Guten, Mollinger, et al.’s (1983) findings. It is possible that these differences were a result of the change in the IAAF rule governing the knee’s straightness post-1995, although it could also be due to different methodologies, or because of individual differences between the participants themselves. In a study of work-energy patterns in elite-standard athletes, Hanley & Bissas (2017) found that the hip extensors were key muscles with regard to energy generation, and that the quadriceps femoris group acted more as a hip flexor than a knee extensor. However, these studies did not differentiate between genders or age groups, and such comparisons would be useful in evaluating the importance of these muscles.
There are a number of important mechanical variables that cannot normally be measured in competition such as muscular activity patterns (via EMG)). These data can improve understanding of the strength training needs of race walking, which should be based on the specificity of its motor-technical demands (Scholich, 1992). Because the present rule governing the knee during stance was introduced in 1995, earlier studies no longer describe the EMG patterns (e.g., Murray, Guten, Mollinger, et al., 1983) in modern race walkers. Furthermore, those studies that have taken place since the introduction of the new rule have not compared athletes across U20 and senior levels, or both men and women. This is particularly important because U20 race walkers’ EMG patterns might differ because of less-developed techniques and muscle strength. A thorough description and understanding of the patterns of muscular activity in elite international race walkers will allow coaches and athletes to develop training regimens that emphasise correct technique and appropriate strength development. In addition, this information will prove useful to members of the scientific community with regard to understanding the musculoskeletal limits of the lower limbs in an exaggerated form of gait. The aim of this study was to analyse hip muscle activity patterns in elite male and female race walkers across U20 and senior age groups.
METHODS
[image:3.516.254.460.214.388.2]Twenty international race walkers from six different nations took part in the study (Table 1). There were no differences between the heights and masses of the senior men and U20 men, or between the senior women and U20 women. Each participant gave written informed consent.
Table 1. Mean (± s) participant ages, heights, masses and personal / season’s best times over the senior and U20 championship distances. Four of the five senior men had recorded a time over the 50 km distance.
Age (year s) Heig ht (m) Mas s (kg) Personal best (h:min:s) Season’s best (h:min:s) Senio r men (N=5) 26.7 (± 4.0) 1.81 (± .06) 70.2 (± 7.1)
20 km – 1:22:53 (±
1:38) 50 km – 3:50:48 (±
3:17)
20 km – 1:23:58 (± 2:04) 50 km – 3:56:56 (± 8:49) Senio r wome n (N=5) 25.6 (± 5.3) 1.68 (± .05) 56.7 (± 3.6)
20 km – 1:30:11 (±
0:48)
20 km – 1:33:14 (± 2:17) U20 men (N=5) 18.8 (± 1.1) 1.77 (± .06) 63.9 (± 11)
10 km – 44:38 (± 2:16)
10 km – 45:19 (± 2:24) U20 wome n (N=5) 18.4 (± 0.2) 1.69 (± .06) 51.1 (± 6.2)
10 km – 49:53 (± 1:56)
10 km – 49:53 (± 1:56)
3
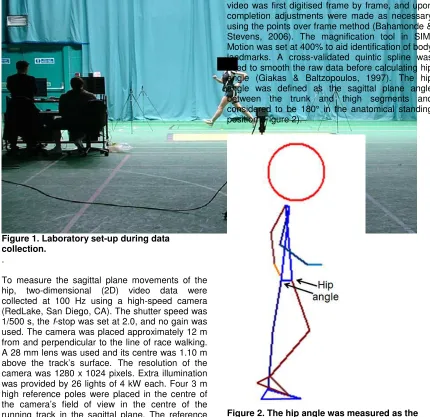
Figure 1. Laboratory set-up during data collection.
.
To measure the sagittal plane movements of the hip, two-dimensional (2D) video data were collected at 100 Hz using a high-speed camera (RedLake, San Diego, CA). The shutter speed was 1/500 s, the f-stop was set at 2.0, and no gain was
used. The camera was placed approximately 12 m from and perpendicular to the line of race walking. A 28 mm lens was used and its centre was 1.10 m above the track’s surface. The resolution of the camera was 1280 x 1024 pixels. Extra illumination was provided by 26 lights of 4 kW each. Four 3 m high reference poles were placed in the centre of the camera’s field of view in the centre of the running track in the sagittal plane. The reference poles provided a total of twelve reference points (up to a height of 2 m) that were later used for calibration (scaling). Only the measurement of sagittal plane movements was included in this 2D study as only one camera was available and the measurement of angular kinematics in other planes (e.g., pelvic obliquity) have thus been excluded. The video files were manually digitised by a single experienced operator to obtain kinematic data using motion analysis software (SIMI Reality Motion Systems GmbH, Munich). Digitising was started at least 10 frames before the beginning of the stride and completed at least 10 frames after to provide padding during filtering (Smith, 1989). Each
[image:4.516.55.485.68.485.2]video was first digitised frame by frame, and upon completion adjustments were made as necessary using the points over frame method (Bahamonde & Stevens, 2006). The magnification tool in SIMI Motion was set at 400% to aid identification of body landmarks. A cross-validated quintic spline was used to smooth the raw data before calculating hip angle (Giakas & Baltzopoulos, 1997). The hip angle was defined as the sagittal plane angle between the trunk and thigh segments and considered to be 180° in the anatomical standing position (Figure 2).
Figure 2. The hip angle was measured as the angle between the trunk and thigh segments..
4 contracted muscle, each electrode was placed over the muscle belly, and aligned parallel to the underlying muscle fibre direction (Clarys & Cabri, 1993). A telemetry unit (DelSys, Inc., Boston, MA), carried in a pack worn around the athlete’s waist, was used to collect the data at 1000 Hz.
The Common Mode Rejection Ratio (CMRR) was 92 dB, the gain 1000 V/V, and the input impedance greater than 100 GΩ. The data were filtered with a bandpass filter (20 – 450 Hz). EMG data were collected for 5 s and collection was begun using the EMG acquisition software (DelSys, Inc., Boston, MA). The EMG data collection software triggered the high-speed camera via a Trigger Output Module (Wireless) (National Instruments, Austin). The delay between activation of the EMG software and triggering of the camera was 5 ms. The raw EMG signals were processed in the data analysis software (DelSys, Inc., Boston, MA) using average rectified EMG (AREMG) (Bartlett, 2007), with a time window of 50 ms and an overlap of 25 ms. These data were then interpolated to 101 points using a cubic spline.
All statistical analyses were conducted using SPSS Statistics 24 (IBM SPSS, Inc., Chicago, IL). Descriptive statistics such as means and standard deviations have been used to show group results. One-way ANOVA was conducted to compare values between groups, with post-hoc Tukey tests conducted; these tests were carried out on the values found at toe-off, midswing, heel-strike and midstance. An alpha level of 5% was set for all tests. The EMG traces were visually compared between subgroups by first expressing each athlete’s individual traces as a percentage of the highest magnitude found during that trace, and then averaging across all athletes within that subgroup.
RESULTS
[image:5.516.45.380.464.570.2]There were no differences between the test speeds of the senior men and U20 men (Table 2). The results of the ANOVA showed that there were no differences between groups for AREMG values at toe-off, midswing, heel-strike and midstance.
Table 2. Mean (± s) spatiotemporal values for each group of athletes.
Speed (km/h) Step length (m) Step frequency (Hz)
Senior men (N=5) 13.66 (± 0.48) 1.21 (± .02) 3.14 (± 0.09)
Senior women (N=5) 12.72 (± 0.39) 1.10 (± .04) 3.22 (± 0.16)
U20 men (N=5) 13.66 (± 0.33) 1.24 (± .01) 3.07 (± 0.09)
U20 women (N=5) 12.25 (± 1.23) 1.14 (± .03) 2.99 (± 0.24)
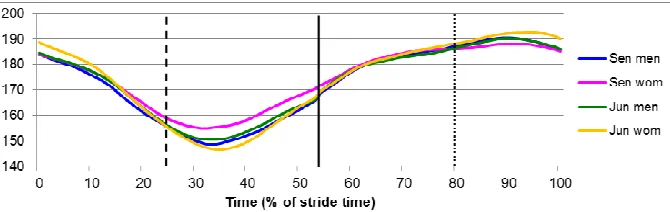
The hip angle for each group over the course of one whole gait cycle is shown in Figure 3. The hip angle was considered to be 180° in the anatomical standing position; angles beyond 180° are therefore indicative of hyperextension. The muscle activity of the gluteus medius, gluteus maximus, biceps femoris and rectus femoris are shown in Figures 4-7, respectively. Each figure shows activity during one stride (off to toe-off).
5
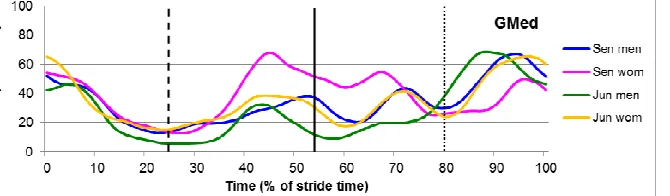
Figure 4. Muscle activity in the gluteus medius for one complete stride (toe-off to toe-off) in senior men, senior women, U20 men and U20 women. The dashed line at 25% indicates midswing, the full line at 54% indicates heel strike and the dotted line at 80% indicates midstance.
[image:6.516.68.403.71.169.2]Figure 5. Muscle activity in the gluteus maximus for one complete stride (toe-off to toe-off) in senior men, senior women, U20 men and U20 women. The dashed line at 25% indicates midswing, the full line at 54% indicates heel strike and the dotted line at 80% indicates midstance.
Figure 6. Muscle activity in the biceps femoris for one complete stride in senior men, senior women, U20 men and U20 women. The dashed line at 25% indicates midswing, the full line at 54% indicates heel strike and the dotted line at 80% indicates midstance.
[image:6.516.57.405.214.313.2] [image:6.516.66.400.359.457.2]DISCUSSION
The aim of this study was to analyse hip muscle activity patterns in elite international male and female race walkers across U20 and senior age groups. With regard to their typical activity across groups during swing, the rectus femoris acted to flex the hip rapidly during early swing, whereas the gluteus maximus acted during midswing to stop flexion, and then acted with biceps femoris to reverse the hip’s movement into extension. During late swing, hip extension occurred with continued noticeable EMG activity in the gluteus maximus and biceps femoris. Overall, the results showed that the hip extensors were considerably active during the gait cycle and emphasised their key role in elite race walking. The gluteus medius was most active during early and late swing, when a likely function was to abduct the hip so that the swing leg was able to clear the stance leg (Murray, Guten, Mollinger, et al., 1983).
With regard to the stance phase, gluteus maximus and biceps femoris activity was observed immediately after initial contact and continued until midstance as the hip’s extension continued. Rectus femoris had little activity during early stance and midstance but was more active during late stance when hip flexion begun, whereas the activity of the hip extensors was reduced by this time. Gluteus medius increased in activity during stance with peak values mostly found during late stance. Murray, Guten, Mollinger, et al. (1983) suggested that an acceleration of the whole body centre of mass (CM) towards the swing side of the body occurs during stance, which is a result of pelvic obliquity that reduces the vertical displacement of the CM.
The activation patterns of all four muscles (and the hip angular kinematics) were relatively similar across subgroups, although there no differences between values at specific phases of the gait cycle. The activation of the biceps femoris, which began during swing, lasted longer in the senior men’s group and the second activation peak during midstance was much smaller than the first. As with the biceps femoris, the gluteus maximus in senior men seemed to be active for longer during the late swing and early stance phases. Although no muscle groups should be neglected, there is evidence that those directly involved in these movements require particular attention. This is not necessarily meant to infer that they need to be trained to produce large forces, but that coaches and athletes should be aware that race walking speed might suffer if these muscles become
fatigued or if there is an imbalance between left and right sides of the body.
The results from this study provide in-depth comparisons of EMG activity patterns between elite race walking of different genders and age groups to date. It should be noted though that the U20 athletes were of a lower standard than the senior athletes (relative to other athletes in their category) and this might have affected the interpretation of findings. Although all-round development is important for elite athletes, highlighting the activity of the predominant muscle groups can inform strength training regimens. Of the muscles analysed, the gluteus maximus and biceps femoris were active from midswing to prevent too great a hip flexion angle before initial contact. These synergist muscles continued as powerful hip extensors from late swing until midstance. The prominence of the biarticular hamstrings was also notable as they are typically involved in decelerating knee extension by contracting eccentrically during late swing (Hanley, Bissas & Drake, 2013). Therefore, the appropriate training of the hamstrings as eccentric knee flexors and hip extensors together with the gluteus maximus is particularly important, as it is in running (Belli, Kyröläinen, & Komi, 2002).
Overall, the EMG patterns were very similar across all four subgroups as the muscles appeared to begin and end contracting at roughly the same times during the gait cycle (taking into account individual differences). The finding that the muscles act in a similar fashion across athletes is of use to coaches, especially as they can adopt these findings when working with athletes on their strength and conditioning without conducting EMG data collection of their own. There are of course many other muscles that act at the hip and pelvis, and although the activity of these muscles is often difficult to measure (e.g., the deep-lying lateral rotators), it is therefore important to be mindful that a complicated technical movement like race walking is the result of many muscle actions that combine to create an efficient, fast technique. Training the correct movements is thus more important than developing individual, targeted muscles.
CONCLUSION
7
patterns between men and women (or between U20s and seniors) and this suggests that techniques are comparable across elite athletes, and thus similar strength and conditioning routines can be used across training groups. It also
suggests that the U20 participants in this study were quite close to elite senior athletes in terms of technique, and more pronounced differences might have been found with non-elite athletes.
REFERENCE
BAHAMONDE, R. E. & STEVENS, R. R. (2006). Comparison of two methods of manual digitization on accuracy and time of completion. In: Schwameder, H., Strutzenberger, G., Fastenbauer, V., Lindinger, S. & Müller, E. eds. Proceedings of the XXIV International Symposium on Biomechanics in Sports. Salzburg: Universität Salzburg, pp.650-653.
BARTLETT, R. (2007). Introduction to Sports Biomechanics (2nd ed.). London: E&FN Spon.
BELLI, A., KYRÖLÄINEN, H. & KOMI, P. V. (2002). Moment and power of lower limb joints in running.
International Journal of Sports Medicine, 23(2), pp.136-141.
BENNELL, K., CROSSLEY, K., WRIGLEY, T. & NITSCHKE, J. (1999). Test-retest reliability of selected ground reaction force parameters and their symmetry during running. Journal of Applied Biomechanics, 15(3), pp.330-336.
CAIRNS, M.A., BURDETT, R.G., PISCIOTTA, J.C., & SIMON, S.R. (1986). A biomechanical analysis of race walking gait. Medicine and Science in Sports and Exercise, 18(4), pp.446-453.
CLARYS, J. P. & CABRI, J. (1993). Electromyography and the study of sports movements. Journal of Sports Sciences, 11(5), pp.379-448.
GIAKAS, G. & BALTZOPOULOS, V. (1997). A comparison of automatic filtering techniques applied to biomechanical walking data. Journal of Biomechanics, 30(8), pp.847-850.
HANLEY, B. & BISSAS, A. (2017). Analysis of lower limb work-energy patterns in world-class race walkers.
Journal of Sports Sciences, 35(10), pp.960-966.
HANLEY, B. & BISSAS, A. (2016). Ground reaction forces of Olympic and World Championship race walkers. European Journal of Sport Science, 16(1), pp.50-56.
HANLEY, B. & BISSAS, A. (2013). Analysis of lower limb internal kinetics and electromyography in elite race walking. Journal of Sports Sciences, 31(11), pp.1222-1232.
HANLEY, B., DRAKE, A. & BISSAS, A. (2008). The biomechanics of elite race walking: technique analysis and the effects of fatigue. New Studies in Athletics, 23(4), pp.17-25.
HOGA, K, AE, M., ENOMOTO, Y. & FUJII, N. (2003) Mechanical energy flow in the recovery leg of elite race walkers. Sports Biomechanics, 2(1), pp.1-13.
HOGA, K., AE, M., ENOMOTO, Y., YOKOZAWA, T. & FUJII, N. (2006) Joint torque and mechanical energy flow in the support legs of slkilled race walkers. Sports Biomechanics, 5(2), pp.167-182.
HOGA-MIURA, K., AE, M., FUJII, N., & YOKOZAWA, T. (2016) A three-dimensional kinematics analysis of men’s 20-km walking races using an inverted pendulum model. Gazzetta Medica Italiana Archivio per le Scienze Mediche, 175(7-8), pp.297-307.McGuire, F. (1989). An introduction to race walking. Modern Athlete and Coach, 27(1), pp.23-26.
McGUIRE, F. (1989). An introduction to race walking. Modern Athlete and Coach, 27(1), pp.23-26.
MURRAY, M. P., GUTEN, G. N., MOLLINGER, L. A. & GARDNER, G. M. (1983). Kinematic and electromyographic patterns of Olympic race walkers. The American Journal of Sports Medicine, 11(2),
pp.68-74.
OKAMOTO, T., TSUTSUMI, H., GOTO, Y. & ANDREW, P. D. (1987). A simple procedure to attenuate
artifacts in surface electrode recordings by painlessly lowering skin impedance. Electromyography and Clinical Neurophysiology, 27(3), pp.173-176.
PADULO, J., ANNINO, G., TIHANYI, J., CALCAGNO, G., VANDO, S., SMITH, L., VERNILLO, G., LA
8
SCHOLICH, M. (1992). Why technique oriented strength development for race walkers? Modern Athlete and Coach, 30(4), pp.27-29.
SMITH, G. (1989). Padding point extrapolation techniques for the Butterworth digital filter. Journal of Biomechanics, 22(8/9), pp.967-971.
DECLARATION
We confirm that the submitted article, ‘Gender and age-group differences in hip muscle activity patterns in elite race walkers’ is an original article
that has not been published elsewhere. We can also confirm that it is not under consideration for publication elsewhere.
CORRESPONDING AUTHOR: Dr Brian Hanley
Carnegie School of Sport, Headingley Campus, Leeds Beckett University, LS6 3QS,
United Kingdom.
Email: [email protected]