GE-International Journal of Management Research
Vol. 3, Issue 9, Sep 2015 IF- 4.316 ISSN: (2321-1709)
© Associated Asia Research Foundation (AARF)
Website: www.aarf.asia Email : [email protected] , [email protected]ENVIRONMENTAL ACCOUNTING : ITS ISSUES, PRACTICES AND
CHALLENGES IN GOA
Dr.Anthony Rodrigues
Associate Professor & Former Head, Department Of Commerce, Fr.Agnel College Of Arts & Commerce, Pilar-Goa, India.
ABSTRACT
Environmental accounting is the practice of incorporating principles of environmental management and conservation into reporting practices and cost/benefit analyses. Environmental accounting allows a business to see the impact of ecologically sustainable practices in everything from their supply chain to facility expansion. It allows accountants to report on the economic impact of those decisions to stakeholders so as to allow for proactive decision making about processes that simultaneously meet environmental regulations while adding to the bottom line.main objectives of this research paper are To ascertain the impact of industrial practices on our environment.To ascertain the measures taken by industries to prevent the harm caused to our environment.To measure how far industries are planning for sustainable environment.To verify the role of Government towards environment.
1.1 Introduction
Sustainability is the principle of engaging in practices that will not deplete a resource, and sustainability accounting and measurement is to engage in practices that allow a business to measure and assess the environmental impact of its activities. Sustainability measurement is a quantitative basis for management of sustainability practices. When a business makes a decision to use green packaging (a sustainable practice), it needs to know how that increased cost is offset with decreased waste disposal costs or increased consumer interest, in addition to the environmental implications (sustainability measurement).
Environmental accounting takes stock of conventional resources plus natural resources and
environmental resources. Environmental resources are qualitative more than quantitative as a general role, with general acceptance due to increasing awareness and concern, environmental resources have begun to be treated as capital.
An Ecological Historian’s Approach
Goa has changed radically in the 20th century. Four major environmental drivers--- mining (post 1945), urbanization (post-1961), industrialization (post-1971) and tourism (post-1972) have strongly impacted its ecology and economy in the past 60 years. Understanding the transformation of the ecology and environment of Goa needs an approach of an ecological historian. In this paper the focus is mostly on the developments of the post-second world war period (1945-2005). There are new approaches to present history from interdisciplinary
angles. History can be studied from the hierarchical level of the biosphere (Ponting, 1991) to the molecular level of the Genes (Cavalli-sforza et al, 1996). In their path-breaking work, “History and Geography of Human Genes” these authors comments that “reconstruction of human evolution, including the fissions, the major migrations and the understanding of the roles of mutation, drift, and natural selection is often difficult and challenging. The credibility of our conclusions can be greatly strengthened if these conclusions can be confirmed in the light of an interdisciplinary approach.
Major issues in Environment accounting awaiting resolution
The following are the most urgent issues for resolution:
a) Accountants are not used to such an accounting. They are trained in measuring financial transactions, not the consumption of natural resources. Guidelines need to be formulated.
There is no such provision for environment accounting: these needs to be provided and enforced.
c) Environmental accounting makes corporates it accountable to the public at large, both current and future generations. This aspect need to be reiterated and enforced.
d) Some natural resources are used up and not renewed at all. The extent of depletion causes deprivation to the current and future generation. A system of compensation has to be built up to integrate the same into conventional accounting.
e) Some activities cause pollution the pollutants are released into the environment / atmosphere and causes permanent damage. This damage has to be compensated. There are pollutants which can be treated to neutralize bad effects. There are anti-pollution or control equipment’s /devices which are installed /used to treat such pollutants. Expenses incurred on such system should be distinguished in accounting system to satisfy the authorities, society and other as well as to give demonstrative effect to enhance further awareness.
Experience of other countries in environmental accounting
In the united states, securities and exchange commission makes it obligatory to disclose much more than conventionally required, about the current and potential environment liability on the part of the corporate apart from transparency, responsibilities towards environment is imposed to ensure truthful accounting, reporting and thereby to facilitate an assessment of impact of the activity through auditing. The European community by act of 1987,as provided for environmental protection ,preservation and compensation. In Canada, all the listed companies and those publicly owned once are required to include , in their annual financial statement, full information about effects of operation on environment, expenditure made for environmental protection, current earning/expenditure on environmental issues and impact on future as well as any remedial/supportive measures taken.
1.2 Objectives of Study
1. To ascertain the impact of industrial practices on our environment.
2. To ascertain the measures taken by industries to prevent the harm caused to our
environment.
1.3 Scope of study
The study is related to the geographical areas of Goa. The industries which are undertaken to conduct are analyses are packing, manufacturing, pharmaceutical, food and beverages, electronics, and electrical. It includes different talukas and industrial estates.
1.5 Research Methodology:
The methodology used in the study is explained below.
Data and sources of data: The study is based mainly on primary data. Primary data have been collected through the issues of questionnaire to the various industries. Personal observations
and discussion with the various business houses.
Sample selected for the study: The questionnaire was circulated to 50 companies of various categories. the sample respondents are selected on the basis of the convenient sampling method.
Area of study: The study area is limited to Goa, and is identified as one of the fast developing state of India. It is poised for the spectacular growth in the near future. Goa being backward in industrial development ,sustainability and growth are the main concern for development. Period of study: The study was undertaken during the period of 2014 – 2015.
Framework of analysis
Secondary data was collected from books, journals, magazines, newspapers and internet.
Limitation of the study
The only difficulty we faced while doing our project was that there was no co-operation from some companies to disclose their environmental status.
Global efforts for sustainable development
The foundation for a greater insight into global environment was laid at the 1972 conference on human environment held at Stockholm. Late Indira Gandhi, who was one of the very few heads of governments that participated in the deliberations, emphasized that poverty is the biggest polluter.one important outcome of the conference was a detailed action plan which led to the creation of the United Nations environmental programme (UNEP).
Sustainable development was defined as that which meets the needs of the present generation without sacrificing the welfare of the future. The concept of sustainable development leads us to new resource consumption strategies which are:
Recycling and reuse of materials, and
More use of renewable resources like solar energy rather than non-renewable resources such as oil and coal.
Sustainable development components
Conservation of basic resources: sustainable development must not endanger the natural systems that support life on earth; the atmosphere, the waters, the soils, and the living beings.
Retention of resources: sustainable development requires that the rate of depletion of non-renewable resources foreclose as few future options as possible.
Diversification of the species: sustainable development requires the conservation of plants and animals species.
Minimize adverse impacts: sustainable development requires that the adverse impacts on the quality of air, water and other natural elements are minimized so as to sustain the ecosystems overall integrity.
Environmental quality: corporate environmental policy is an extension of total quality management
Pollution Discharged to Environment
pollutants Quantity of pollutants discharged
( mass / day ) Kg / Hr
Concentration of pollutants in discharge
(mass / vol. ) Mg / M3
Percentage of variation from prescribed standards with reasons
(a) Water
NIL NIL N.A
(b) Air
i) Particulate Matter from Prilling Tower – Urea plant
ii) Particulate Matter from Dust Separator – Urea plant
iii) Ammonia from Off Gas Absorber – Urea plant
iv) Ammonia from Amm. Recovery Absorber – Urea plant v) Ammonia from Fumes Stack – NPK-A plant
vi) Particulate Matter from Dryer Stack – NPK-A plant
vii) Particulate Matter from Dedusting Stack – NPK-A plant viii) Ammonia from NPK-B Stack
ix) Particulate Matter from NPK-B Stack x) SO2 from Boiler Stack
xi) Particulate Matter from Boiler --- --- 2.28 1.01 1.43 --- --- 3.98 -- 402.09 --- 37.67 41.23 --- --- --- 41.73 43.57 --- 44.98 --- 124.02
Less by 74.88%
Less by 72.51%
Less by 77.20%
Less by 89.90%
Less by 85.70%
Less by 72.18%
Less by 70.95%
Less by 60.20%
Less by 70.01%
Less by 49.86%
Hazardous waste
Hazardous Waste Total Quantity
During the previous financial year 2011-12
During the current financial year
2012-13
(a) From Process
(i) Used / Spent Oil under H.W.
Category No.5.1
( (ii) Spent Catalyst under H.W.Category No.18.1
(iii) Furnace Oil Tank cleaning sludge under
H.W.Category No.3.1
16.9 MT
NIL
106.49 MT
3.29 MT
23.26 MT
37.58 MT
b) From pollution control facilities
(i) ETP sludge under H.W.Category No.34.3
35MT 40 MT
(c)(i) Quantity recycled / reused within Unit
(ii) Sold ( used/spent Oil)
(iii) Sold ( Spent Catalyst) (iv) Sold ( Furnace oil Tank cleaning residue)
35 MT ETP Sludge
16.9 MT
NIL 106.49 MT
40 MT ETP Sludge
3.29 MT
Hazardous waste
Used / Spent Oil Used Oil Sold to CPCB registered and
SPCB Authorized
Vendors/Recyclers only for reprocessing.
Furnace Oil Tank sludge & cleaning residue
Oil sludge & cleaning residue Sold to CPCB registered and
SPCB Authorized
Vendors/Recyclers only for reprocessing
Spent Catalyst Spent catalyst containing metals/oxides like Ni, Cu, Zn, Fe, Co, Mo etc.in different composition
Sold to CPCB registered and
SPCB Authorized
Vendors/Recyclers only for reprocessing.
ETP Sludge Amm./Urea nitrogen,
Phosphate, Sulphate, KCl, Salts of Na, Ca, Mg & Suspended solids
Recovered into process as recycle along with filler material in NPK-A and NPK-B plants
Solid waste
DM plant resin material Water insoluble co-polymers
Used along with backfilling material for structure / building foundation, road construction etc.
Sand from filters Used along with backfilling
material for structure / building foundation, road construction etc.
Activated carbon from filters Carbon material Used along with backfilling material for structure / building foundation, road construction etc.
Role of the Government
Goa State Pollution Control Board (GSPCB)
The Goa State Pollution Board is an autonomous statutory organization constituted on 1st July 1988 under water (prevention and control pollution) act 1974. Prior to that, when Goa formed a part of the erstwhile Union territory of Goa, Daman and Diu, the central board for the prevention and control of water pollution was performing the function of the state board in Goa .the central pollution control board at Ponda Goa had established a section office for the purpose. The same arrangement continued till the constitution of the state board. In the meanwhile, the section office was re-constituted as west zonal office and shifted to Baroda
on4th 12988. All the relevant records pertaining to Goa were transferred to the Goa state pollution control board on12th september1988.
MONITORING NETWORK FOR AIR AND WATER QUALITY
The Goa State pollution Control Board monitors the air and water quality under the central pollution Control Board sponsored projects National Air monitoring Programme (NAMP) and National Water Monitoring Programme (NWMP). The NAMP projects covers16 air quality monitoring locations within the state of Goa and the NWMP project covers 49 water quality monitoring locations within the state of Goa. The details of the project are given as under.
National Air Monitoring Programme (NAMP)
This is an ongoing activity funded by the Central Pollution Control Board, New Delhi under the national Air monitoring programme (NAMP).
Ambient air quality in some areas of goa
Trend status of air quality for the period April 2013-march 2014 in some of the towns of goa Parameter Location PM10 µg/m3 NO2 µg/m3 SO2 µg/m3
Panaji 43.50 7.85 5.02
Vasco 44.48 10.67 7.33
MPT 55.48 10.67 6.52
Mapusa 58.08 12.28 10.14
Margao 56.30 11.71 6.03
Ponda 49.91 11.45 5.72
0.00 10.00 20.00 30.00 40.00 50.00 60.00 70.00
Panaji Vasco MPT Mapusa Margao Ponda
C on c in µ g/ m 3
Status of air quality in some of the towns in Goa
PM10 µg/m3 NO2 µg/m3 Annual limit for
PM10 Annual limit for
SO2
Annual l imit for
Trend status of air quality in areas which were affected with mining transportation during April 2012-March2013 Parameter Location PM10 µg/m3 PM2.5 µg/m3 NO2 µg/m3 SO2 µg/m3
Assanora 51.93 21.13 11.77 6.14
Amona 55.95 22.21 12.01 6.19
Bicholim 49.35 20.17 11.82 6.15
Curchorem 50.85 20.23 11.81 5.99
Honda 48.10 19.44 11.83 6.11
Sanguem 49.13 19.58 11.63 5.98
Tilamol 47.66 18.49 11.61 6.05
Usgao 51.50 20.37 11.58 5.92
National water quality monitoring programme
The Goa State Pollution Control Board monitors water quality at 52 locations throughout Goa under the Central Pollution Control Board sponsored project NWMP. The water bodies monitored include rivers, wells, canals, lake, reservoir and creek. Among the rivers ,the estuarine rivers as well the sweet water rivers, which form a part of the network for water intake points for water treatment plants for public water supply have been covered. Ground water sources located within the industrial estates are also part of this programme.
Management problems in the State of Goa
The Government of Goa has constituted a Monitoring Cum Working Committee to support, consolidate and assist in the activities in the various Government
0.00 10.00 20.00 30.00 40.00 50.00 60.00
C
o
n
c
in
g
/m3
location
Status of air quality in areas which were
affected with mining transportation
PM10 µg/m3
PM2.5 µ g/m3 NO2 µ g/m3
SO2 µ g/m3
Annual limit for PM10 Annual limit for
SO2 Annual limit for
departments, local Panchayat Raj institution, NGO’s / VGO’s: who are working in the field of solid waste management and monitoring the enforcement of Goa non-biodegradable Garbage(control) Act 1966 & rules 1997 and the plastic waste (management and handling) rules, 2011 under the chairmanship of honorable minister for environment and the High Level Task Force (HLTF) to provide directions and implement various measures as announced in the budget speech, 2012-13, towards resolving the solid waste management problems affecting the state of Goa. The decisions taken by the committee as well as the HLTF are implemented through
the Goa State Pollution Control Board.
Environment and industries are inter-related and interdependent. Environmental problems are an important concern for industries today. Industrial activities cause various impacts on the natural environment e.g. building an industry results in deterioration of place, lot of trees are being cut down, waste disposed of at the site, gases released by industries including CO2, smoke etc. This has caused disturbance in the people including the plants and animals.
Table No. 1
Environmental awareness
Yes No Percentage
Concern for environment 44 7 86.2%
Involved in environmental activities
35 16 68%
Environmental department 25 26 49%
Source: Questionnaire Graph no.1
0 10 20 30 40 50
Concern for environment
Involved in environmental
activities
Environmental department 44
35
25
7
16
26
Environmental awareness
Yes No
From the above table No. 1 and graph No.1 it shows very clearly that concern for the environment is highest i.e. 86% and it is good for the companies. And further only 68% of companies are involved in environmental activities. And only 49% of them has environmental department. Industries should also show it in more practical terms by showing concern about the environment and they also ought to have environmental department in their units so that they can be more aware about the environmental issues that are occurring in their industries.
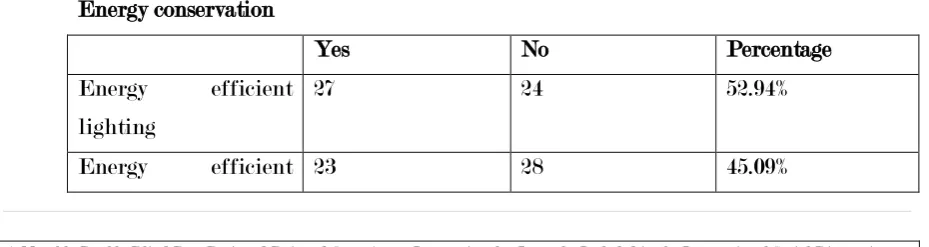
Table No. 2
Energy conservation
Yes No Percentage
Energy efficient lighting
27 24 52.94%
[image:13.595.69.534.646.769.2]equipment
other 10 41 19.6%
Source: Questionnaire
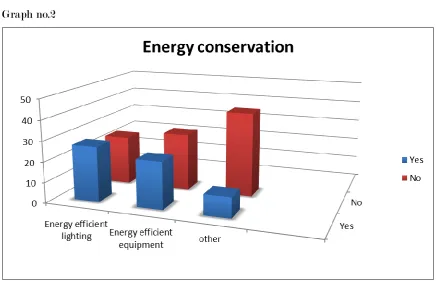
Graph no.2
[image:14.595.106.543.107.388.2]From the above table No.2 and graph No.2 it shows steps taken for energy conservation. 52.94% of the industries are using energy efficient lighting. And further only 45.09% are using energy efficient equipment to conserve energy. Conservation of energy is very important because energy is short supply And our nation is also suffering from it.
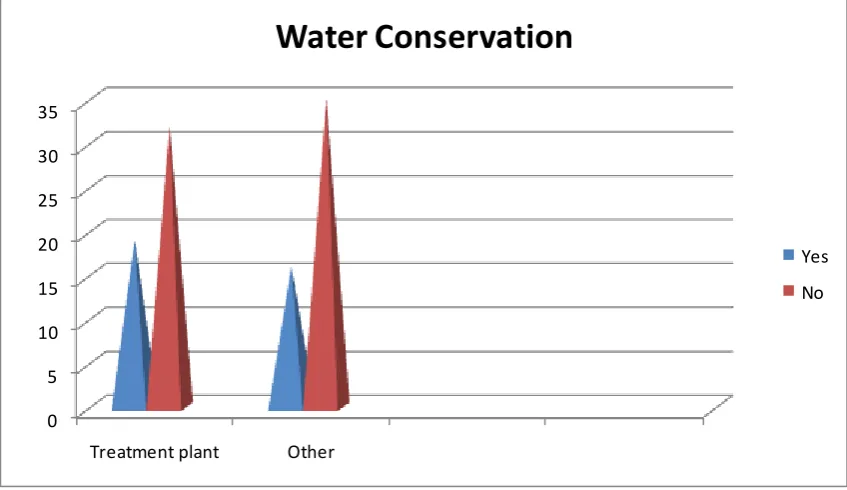
Table No. 3
Water conservation
Yes No Percentage%
Treatment plant 19 32 37.25
Other 16 35 31.37
Graph no.3
0 5 10 15 20 25 30 35
Treatment plant Other
Water Conservation
Yes No
[image:15.595.112.536.60.305.2]From the above table No.3 and graph No.3 it shows steps taken for water conservation. 37.25% of industries have treatment plant in their unit and only 31.37% of them use other like water harvesting, recycling of waste water, reuse of waste water and etc. It is very important to conserve water because in Goa we are suffering from water scarcity especially in summers were well water goes dry and also supply from government is also less so there is a need to conserve water.
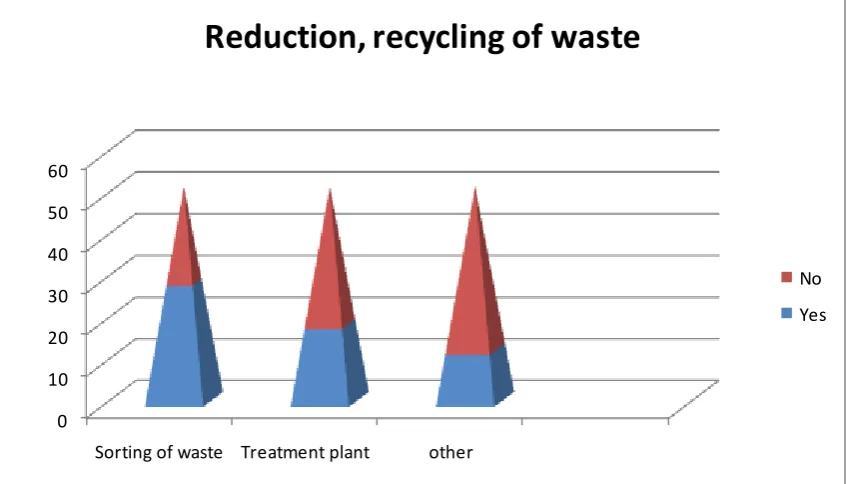
Table No. 4
Reduction, recycling of waste
Yes No Percentage%
Sorting of waste 28 23 54.9
Treatment plant 18 33 35.3
other 12 39 23.52
Graph no.4
0 10 20 30 40 50 60
Sorting of waste Treatment plant other
Reduction, recycling of waste
No Yes
[image:16.595.113.538.60.302.2]From the above table No.4 and graph No.4 it shows that 54.9% of industries are sorting their waste and further only 35.3% have treatment plant in their units. And only 23.52% use other reasons are like selling their waste to registered vendor or recycle. It is very important to recycle and reduce the waste because in future it will affect us in many ways like diseases, garbage problem and etc. And the waste which is biodegradable can be treated and used as manure in plants.
Table No. 5
Environmentally-oriented initiative
Yes No Percentage%
Possibility of reducing operational cost of your company
29 22 56.86
Improving image of your company 18 33 35.29
Graph No.5
0 10 20 30 40 50 60
Possibility of reducing operational cost of your company
Improving image of your
company
Environmentally-oriented initiative
No
From the above table No.5 and graph No.5 it shows that industries are motivated to conduct environmental oriented activities .Possibility of reducing operational cost of their company is highest i.e. 56.86% and further only 35.25% of the industries are conducting environmental oriented activities to improving the image of their company. Environmental oriented activities play an important role in industrial units because it helps the industries to raise their goodwill high in the market.
Table No. 6
Magnitude of the industry influence on the natural environment
Yes No Percentage%
Large 11 40 27.5
Medium 17 34 33.33
Small 9 42 17.64
There is no influence 7 44 13.72
Graph No.6
Yes No 0
20 40 60
Large
Medium
Small
There is no influence
Magnitude of the industries influence on
the natural environment
Yes No
[image:18.595.113.539.61.311.2]From the above table No.6 and graph No.6 it shows that there is a medium i.e. 33.33% have influence on the natural environment by the industries which is higher. And 27.5 % of the industries has large magnitude of the industrial influence on the natural environment and further only 17.64% have small influence on the natural environment And 13.72% has No influence on the natural environment.
Table No.7
Companies registered with environmental certificate
Yes No Percentage%
ISO 9000 22 29 43.13
ISO 14001 18 33 35.29
Other 5 46 9.8
Graph No.7
0 5 10 15 20 25 30 35 40 45 50
ISO 9000 ISO 14001 Other
Companies Registered with Environmental
Certificate
Yes No
The above table No.7 and graph No.7 it shows that industries which are registered under environment certification. Around 43.13% of industries are registered with ISO 9000- a series of standards, developed and published by the International Organization for Standardization (ISO), that define, establish, and maintain an effective quality assurance system for manufacturing and service industries. And further 35.29% of industries are registered with ISO 14001: 2004 – it sets out the criteria for an environmental management system and can be certified to. It does not state requirement for environmental performance, but maps out a framework that a
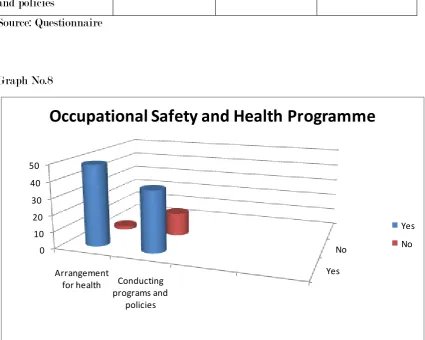
Table No. 8
Occupational safety and programme
Yes No Percentage
Arrangement for health
49 2 96.07
Conducting programs and policies
37 14 72.54
Source: Questionnaire
Graph No.8
Yes No 0
10 20 30 40 50
Arrangement
for health Conducting programs and
policies
Occupational Safety and Health Programme
Yes No
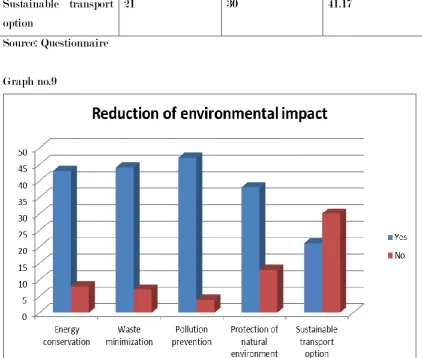
Table No. 9
Enterprise tried to reduce environmental impact in terms of the following
Yes No Percentage
Energy conservation 43 8 84.31
Waste minimization 44 7 86.27
Pollution prevention 47 4 92.15
Protection of natural environment
38 13 74.5
Sustainable transport option
21 30 41.17
Source: Questionnaire
Graph no.9
From the graph no 9 and the table no 9 it is understood that 84.31 % of companies tried to reduce environmental impact in terms of energy conservation, 86.27 % in terms of waste minimization, 92.15 % in terms of pollution prevention,74.5 % in terms of protection of natural environment and 41.17 % in terms of sustainable transport option.
disposal of solid wastes. Pollution prevention and protection of natural environment will sustain environment for future generations to come and Sustainable transport systems make a positive contribution to the environmental.
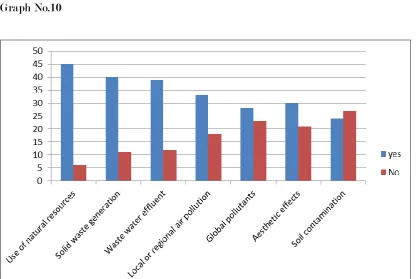
Table No. 10
Actions taken to reduce environmental impact associated with the following:
Yes No Percentage
Use of natural resources
45 6 88.23
Solid waste generation 40 11 78.43
Waste water effluent 39 12 76.47
Local or regional air pollution
33 18 64.7
Global pollutants 28 23 54.9
Aesthetic effects 30 21 58.82
Soil contamination 24 27 47.05
Source: Questionnaire Graph No.10
pollution,54.9% tried to reduce global pollutants,58.82 reduced their aesthetic effects,47.05 % reduced soil contamination by recycling and using safe disposal methods.
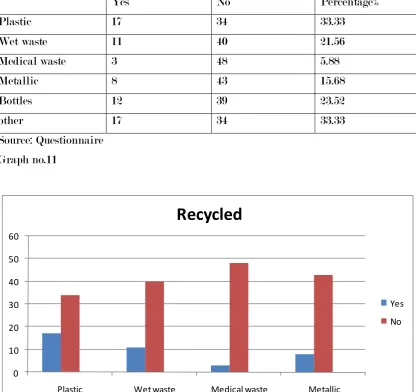
Table No. 11
Recycled
Yes No Percentage%
Plastic 17 34 33.33
Wet waste 11 40 21.56
Medical waste 3 48 5.88
Metallic 8 43 15.68
Bottles 12 39 23.52
other 17 34 33.33
Source: Questionnaire Graph no.11
0 10 20 30 40 50 60
Plastic Wet waste Medical waste Metallic
Recycled
Yes No
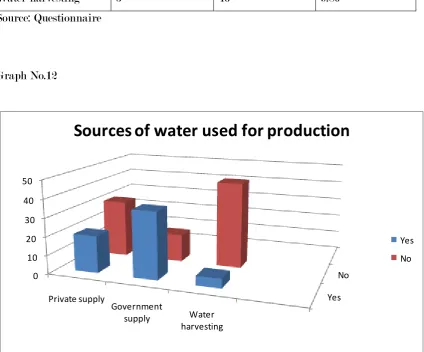
Table No. 12
Source of water used for production
Yes No Percentage
Private supply 20 31 39.21
Government supply 36 15 70.58
Water harvesting 5 46 9.80
Source: Questionnaire
Graph No.12
Yes No 0
10 20 30 40 50
Private supply
Government
supply Water harvesting
Sources of water used for production
Yes No
Table No. 13
Plan for monitoring and protecting environment
Yes No Percentage
Plan for monitoring 19 32 37.25
Waste disposal methods adopted
29 22 56.86
Conducting environmental activities in society
20 31 39.21
Source: Questionnaire
Graph No.13
0 5 10 15 20 25 30 35
Plan for monitoring
Waste disposal methods adopted
Conducting environmental
activities in society
Plans for monitoring and protecting
environment
Yes No
Table No. 14
Care for environment
Yes No Percentage
Comply with existing regulation
31 20 60.78
In a few aspect companies go beyond regulation
6 45 11.76
In many aspect companies go beyond regulation
2 49 3.92
Carrying out regular internal audit
8 43 15.68
Source: Questionnaire
Graph No.14
0 10 20 30 40 50 60
Comply with existing regulation
In a few aspect companies go beyond
regulation
In many aspect companies go beyond
regulation
Carrying out regular internal audit
Yes No
Conclusion
Concern for environment is not a luxury, and not at all avoidable heavy expenditure. The preservation of environment is not only an economic consideration but also moral duty because environment contains gifts of nature, some of which are non-renewable. Environmental concern obligation relates also closely to depletion, restoration and increase of resources. Policy decisions and their implementation must be an attempt to affect balance between present gains with lightly damage in near future. There has to be synthesizing act between environment and development which, at present, is a dilemma. There is as yet no
consensus about the role of accounting in trying to account for the environment.
When disclosing information externally, companies must consider integrity and commonality that enable the system to be a social system for distribution of correct information to users. The challenge of environmental accounting is to deliver meaningful disclosure within accounting practices and standards. Further challenge of environmental accounting is to extend practices to include new accounting procedures for costing out and investigating possible recycling alternatives. Introducing environmental accounting and reporting the organization need to ascertain all environmental impacts from a cost benefit point of view and to measure eco-assets and liabilities for the organization. An accounting standard devoted for the purpose of measurement and reporting of environment must be pronounced. Although a global environmental accounting standard is under consideration by the international accounting standards committee, there is an urgent necessity of a generally accepted environmental accounting standard to keep pace with the sustainability.
A successful environmental management system should have a method for accounting for full environmental costs and should integrate private environmental costs into capital budgeting, cost allocation, process/product design and other forward-looking decisions.
The study reveals that awareness of environmental accounting needs to be implemented in every company. Though GSBPC monitors over production, functioning of different companies. It is found that most of the companies are being certified with the environmental certificate like ISO: 14001; ISO: 9000, OSHAS and others which show that they are very much concern about the environment and are taking various actions in order to reduce environmental pollution. Some companies are even conducting regular environmental audit.
to follow while conducting industrial practices and strict actions are being taken by the Goa State Pollution Control Board (GSPCB) if the companies are violating this rules which are being laid down in these acts.
Analysis shows that few companies are motivated in conducting environmental oriented activities so as to improve the image of their company and to reduce the operational cost, but we feel that every company should engage themselves in conducting programs to spread environmental awareness and sustain the natural resources for future generations to come.
The data shows that many companies tried to reduce their company’s environmental impact in terms of energy conservation, waste minimization and pollution prevention, so based on the information collected by us we can conclude that the magnitude of the industry influence on the natural environment is medium.
Suggestions/ Recommendations:
Healthy and hygienic environment is a pre-requisite of economic development of a country. The seventh Five years plan states that India is fortunate in the richness of its natural resources and better to say the abundance and diversity of its living resources.
The following are the recommendation for better performance and results.
1. The companies should not damage the environment at any stage of its life, including manufacture use and disposal.
2. The companies must consume disproportionate amount of energy and other resources during manufacturing use and disposal
3. Companies should not cause necessary waste, either as a result of excessive packaging or a short useful life.
4. Companies should be honest with consumers and not mislead them by over promising. 5. The industrial units using hazardous chemicals as raw materials in processes,
products and wastes with inflammable, explosive, corrosive, toxic and noxious properties will be required to have on-site and off-site emergency plans in place and put them to test by organizing regular mock drills.
6. The Company should reuse and recycle this is one of the most obvious way to reduce pollution. When you reuse and recycle items, it goes a long way in preserving raw materials. Recycling also minimizes the landfill garbage and the environmental damage caused by manufacturing processes.
8. Should conserve energy when possible this can be done by replacing energy -sucking incandescent bulbs with fluorescent ones, install window fans instead of a/c units, and insulate the water heater, unplugging electrical devices when not in use
9. The analysis reports indicate that treatment facility is not adequate to treat the wastewater generated
10. The treatment plant should be upgraded to treat the waste water generated from the industry.
Key words: Goa State Pollution Control Board, National Air Monitoring Programme, National Water Monitoring Programme, Goa state pollution control board.
BIBLIOGRAPHY
Books referred…..
Goa Economic Survey: 2012-2013, chapter no.9 , Pg.72
Gazette of Union Territory Goa, Daman & Diu - Part 1, Pg.642 Fish Curry Rice , tourism, Pg. 86, Pg. 200-201
Dr. Jose Conceicao Almeida, “Goa Administration & economy before and after 1962”, Chapter 15, Pg.115
Land and People, Karnataka , Volume -13, Pg.355 - Pg. 370 Land and People , Kerala, Volume- 14, Pg.285 - Pg. 308 Land and people, Gujarat, Volume 8, Pg.423 -Pg.459
Land and people, Jammu & Kashmir, Volume 11, Pg.201- Pg.238
Devesh Chaturvedi, “Tourism in India: Insuring Buoyancy & Sustainability”, Volume no.54, May 2010, Pg.5
Dr.Jilak Ranjan Bera, “Goa- a journey & reminiscence”, Pg.78 –Pg.83 “The economy of Goa”, Research project, Pg.56 - Pg.62
“Encyclopedia : Ecotourism & ecotourists”, Pg. 25 – 54
“Encyclopedia :wildlife tourism, prakash voivokar, Pg.208-Pg 238
B.S.Badan, Harish Bhatt “Encyclopedia of Tourism in 21st century” ,Volume.5 , Pg.1 to Pg.3, Pg.73 – Pg.96
Andrew Holden, “Environment and Tourism”, “chapter no. 1 introducing tourism”, page no. 1 – 22
Kunal Chattopadhyay, “Economic Impact of Tourism Development (An Indian Experience)-Definition and Types of tourism”, chapter no. 2, page no. 7 – 21
Smitha Bhandare Kamat,
Prabhakar timble,“more focus is needed for tourism”, The Navhind Times, volume 52, December 2, 2014.
Journals referred
Sandip Das, “Indian Tourism Sector:A Growth Story”,volume no.55, yojana September 2011, Pg. no.49.
P Siva Sankara Reddy.Rural, “Tourism and Handicrafts”, Yojana, Volume no.51, June 2007, Pg. no.29.
Tripti Nath, “Overseas Patients Knocking the Doors of Indian Hospitals”, Yojana, Volume no.54, May 2010, Pg. no.34.
Murali Dhar Majhi, “An Alternative Strategy for Cultural and Economic Development of Orissa”, Yojana, Volume no.54, May 2010, Pg. no.37.
Parama Sinha Palit, “India and China Engage Southeast Asia by cultural Diplomacy”, Yojana, Volume no.54, May 2010, Pg. no.45.
Ritu Galiti,”Tourism in Uttaranchal: Prospects and Problems”, Yojana, volume no.36, October 31st 1993, No.24, Pg. no.17.
Devesh Chaturvedi, “Tourism in India: ensuring buoyancy and sustainability”, Yojana, Volume no. 54 may 2010 Pg.no.5.
Manjula Chaudhary, “Training man to manage tourism”, Yojana, Volume no.54 may 2010 Pg.no.8.
Thinlas Chorol,”Beyond Conventional Tourism”, Yojana, Volume no.54, may 2010 Pg. no. 16.
P P Shrivastav, “Toursim: friend or foe of heritage and local well being?
Eco Tourism : a tool for community upliftment”, Volume No.54, may 2010 Pg. no. 22. Vijay Thakur, “Rural tourism in India”, Volume No.54, may 2010, Pg. no. 31. S P Chamoli, “Adventure Tourism in India”, Volume no.54, may 2010, Pg. no. 43. Swapnil Naik, “Goa: Challenges to tourism”, Volume no.54 may 2010,Pg. no.48.
Website:
www.goa-tourism.com
www.nios.ac.in
www.kerelatourism.gov.in www.tourism.gov.mv
Annuxere:1
NATIONALITY-WISE FOREIGN TOURIST ARRIVALS DURING THE YEAR- 2012 & 2013
Â
Sr.
No. Countries
No. of tourist Arrived
% No. of tourist
Arrived %
    2012 2013
1. U.K. 119891 29.53 145431 29.53
2. Russia 140100 33.05 162746 33.05
3. Germany 31842 9.43 46472 9.43
4. Finland 23787 5.20 25643 5.20
5. France 19907 4.18 20618 4.19
6. Switzerland 12951 2.76 13599 2.77
7. Sweden 18222 3.80 18752 3.81
8. U.S.A. 8970 1.93 9502 1.94
9. Australia 6872 1.55 7635 1.56
10. South Africa 1732 0.60 2972 0.61
11. Brazil 1203 0.44 2204 0.45
12. Italy 3952 0.90 4471 0.91
13. Canada 4507 1.04 5122 1.04
14. Japan 826 0.20 1001 0.21
15. Denmark 1562 0.31 1570 0.32
16. Austria 2201 0.34 1721 0.35
17. Holland 1282 0.40 2001 0.40
18. Portugal 1195 0.51 2559 0.52
19. Ireland 1242 0.27 1360 0.28
20. Belgium 280 0.07 384 0.07
22. Iran 882 0.18 892 0.18
23. U.A.E. 1262 0.40 1999 0.41
24. New Zealand 256 0.05 285 0.06
25. Greek 72 0.01 90 0.01
26. Lithvania 1252 0.30 1506 0.31
27. Czech 852 0.19 942 0.19
28. Others 43248 2.16 10661 2.17
  Total 450530 100 492322 100