http://dx.doi.org/10.4236/jpee.2015.38008
Power Line Monitoring Data Transmission
Using Wireless Sensor Network
Lifen Li1, Huaiyu Zhao2
1School of Control and Computer Engineering, North China Electric Power University, Baoding, China 2School of Electrical & Electronic Engineering, North China Electric Power University, Baoding, China
Email: Lilifen70@163.com
Received 24 June 2015; accepted 18 August 2015; published 21 August 2015
Copyright © 2015 by authors and Scientific Research Publishing Inc.
This work is licensed under the Creative Commons Attribution International License (CC BY).
http://creativecommons.org/licenses/by/4.0/
Abstract
The WSN used in power line monitoring is long chain structure, and the bottleneck near the Sink node is more obvious. In view of this, A Sink nodes’ cooperation mechanism is presented. The Sink nodes from different WSNs are adjacently deployed. Adopting multimode and spatial multiplexing network technology, the network is constructed into multi-mode-level to achieve different levels of data streaming. The network loads are shunted and the network resources are rationally uti-lized. Through the multi-sink nodes cooperation, the bottlenecks at the Sink node and its near several jump nodes are solved and process the competition of communication between nodes by channel adjustment. Finally, the paper analyzed the method and provided simulation experiment results. Simulation results show that the method can solve the funnel effect of the sink node, and get a good QoS.
Keywords
Wireless Sensor Network (WSN), Power Line Monitoring, Data Transmission, Multimode Network
1. Introduction
In our country, power transmission line is all over the land. Overhead lines exposed to the atmosphere are prone to failure, or even lead to disaster, and we need to find a simple method to monitor the line in real-time [1]. Up till the present, the entire state of automatic monitoring of overhead transmission lines is only mentioned in ref-erence [2], it described the insulator leakage of electric current online monitoring system, but its drawback is the transmission of sensor data for monitoring use of the GPRS of telecommunications company.
prac-tical applications of wireless sensor networks are ZigBee [3] wireless sensor networks that base on the IEEE 802.15.4 standard. It is a low complexity, and low power, low-cost wireless network technology. This will pro-vide new ideas for data transmission in some industrial monitoring systems. Using wireless sensor network in power line monitoring and warning system is a promising way [4][5].
2. The Transmission Line Monitoring System Design Based on WSN
The distance between adjacent towers is from dozens of meters to hundreds of meters, even across the valley, rivers and other special cases, it is no more than one thousand meters [6]. Sensor nodes deployed in high or low voltage transmission line tower, which form a long chain structure [7]. These sensor nodes are responsible for data perception, acquisition, computing and communication in real time. Several long chains form a long chain tree topology with the Sink node on the root. Each long chain presents a high voltage or low voltage transmis-sion lines, and the Sink node generally located in the substation. In this way, a transmistransmis-sion line has three chains, as shown in Figure 1.
WSN based power transmission line monitoring system has characteristics as following: 1) The system needs to manage a long chains tree-like topological structures so that transmission is essentially multi-hop. 2) They all periodically collect data and transfer them to a concentrator station connected to a fixed network. 3) From the mobility point of view, all the systems can be considered to be stable. Sensors are not mobile and the network is stationary during the transmission. 4) Nodes are equipped with GPS. And the node localization, time synchroni-zation can be solved by GPS. Each node has a unique ID number, uniformly distributed in the network initiali-zation. 5) The node energy is not restricted. 6) For real-time data transmission, the system have higher demand to the reliability.
3. WSN Based Power Line Monitoring Data Transmission
3.1. Multimode Hierarchical Network Model
To build Multi-mode layer network, the multiple Sink nodes are set in the network. The data collecting sensor network is divided into several levels [8]. Different Sink nodes are responsible for the different levels. Each lev-el uses different band to transmit data. After dividing levlev-els, we can construct a load balancing network to real-ize the multimode traffic distribution, and solve the funnel effect [9].
Network with long chain type as an example, we assume that the node communication coverage 3 units. If the network is not layered, the number of the nodes within a node communication scope is about 20, and the 20 nodes compete wireless channel in the Communication. Through the network Level division, some nodes within the coverage area will be in the level of other bands, and only communicate with the edge nodes. Thus nodes to competition channel will be reduced to eight.
In the distributed coordination of DCF model access control mode [10], the MAC layer using virtual carrier listening to determine what the wireless channel state, based on CSMA/CA protocol, when a node to transmit a packet, it need to pass a interframe spacing DIFS to determine whether the channel free [11]. Twenty nodes un-der the condition of channel competition, will be 20 nodes of network channel caused by the pressure of compe-tition placed within range of a node, each node as forwarding used by a group of average channel listener time to (1 + 2 + 3 + ... + 20)/(2 × 20) ≈ 10 (DIFS), if reducing to eight node average channel the listening time is 4 (DIFS) [12].
3.2. The Implementation of Multimode Hierarchical Network
Sensor network as a graph G = (V, E, SC), among them, the Sink node set, SC said V sensor nodes, the nodes if u and V can direct communication, are contained in the collection of E an edge (u, V). For each node in this paper, the modeling algorithm need the support of four list: NL neighbor node list, the parent node list PL, list of CL and brother child node SL.
In the node deployment, each node set up their own hop count to infinity, the node transmission power control unit is in a jump distance, network connection with probability 1. Then, each node broadcast network news, so that a node can know the existence of all its neighbor nodes, and the information stored in the NL list. Jump and then set the Sink node values, such as network exists in three Sink node, it will Sink node hop count is set to 0, 1, 2 in turn. Then choose the hop of 0 to the Sink node in the network broadcast a hello message, the message con-tained in the Sink node jump numerical and Sink node number value. When a node u v from the node receives a
The Node area number is null
start
Y
Receive and check the node ID set of the information
frame area
Are there the same as the local node ID field?
Y
Frame area field is assigned to the local
node area
Frame field channel is assigned to the local node communication
channel
Local node number area < frame area≤local
area node+ω?
N
Frame area number= local node area+1?
Y
The frame area node ID is set as the ω level local node
routing table
Y
Frame area number= local node area +ω?
N
The frame area node ID set as a level 1 local
node routing table
end initialize
N
[image:3.595.188.443.328.702.2]N
hello message, after get jump numerical Nv, then use your own jump numerical Nu compare the following and perform the corresponding operation:
If Nv < Nu − 1, set the Nu = Nv + 1, broadcast hello message and Nu to the neighbor nodes. If Nu ≠ ∞, the node transmission power will be raised to the largest and the node NL list will be empty.
Again after a certain time delay after each node broadcasting notice sending its neighbor nodes report its ex-istence, the purpose is to obtain the node communication coverage expanded new NL list, then each Sink node to send a hello message in networking on a network, with reference to the number of Sink node modulus value [13]. Using the hop count, obtained from the first step on node hop count as its take over, take the same remainder of nodes of the same level. Sink node is responsible for the different layers, and work with different frequencies. Routing table establishment process is as follows, when a node u v from the node receives a hello message, after get jump numerical Nv, then use your own jump numerical Nu compare the following and perform the corres-ponding operation:
if Nu/Ns = Nv/Ns,Add the node u’s and v’s id number to the NL list.
if Nu/Ns > Nv/Ns and Nu%Ns = Nv%Ns, Add the node u’s and v’s id number to the PL list. if Nu /Ns < Nv/Ns and Nu%Ns = Nv%Ns, Add the node u’s and v’s id number to the CL list. if Nu /Ns= Nv/Ns and Nu%Ns = Nv%Ns, Add the node u’s and v’s id number to the SL list. The uplink process routing table is shown as Figure 2 (descending table creation process).
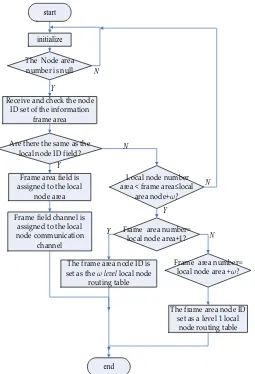
The ω grade in routing table can ensure that there was a fault in the network, the channel adjustment mechan-ism to fault to connect with the other layer, reach the purpose of rapid, complete data transmission, embodied in the local node transmission data channel adjustment algorithm [14], such as in Figure 3.
Buffer queue ≠null
start
Y
Node ID exist in the routing table1
Y
According to the ID number , forwarding data
Level 2 node ID exist in the routing table ?
N
Y
Node communication channel number k-1
N level node ID exist in the routing table?
communication channel number -(k-1) ω
end initialize
N
N
According to the ID number,forwar
ding data
According to the ID number, forwarding data
4. The Simulation Experiment and Analysis
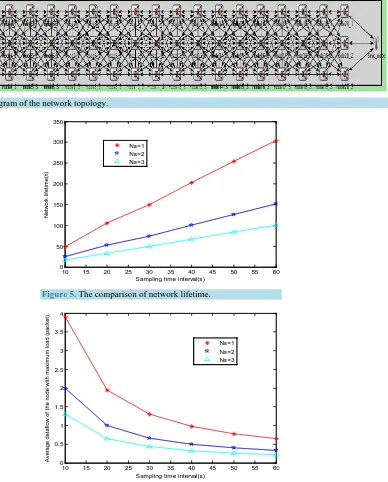
Simulation experiment platform for OMNeT++ of selection will be used in transmission line monitoring wire-less sensor network model is defined as shown in Figure 3 long chain tree structure. One set of sensor nodes coverage for km, by increasing the transmitted power, more increase coverage.
[image:5.595.152.540.225.707.2]According to the method described in this article, We will use the hierarchical network construction of mul-timode hierarchical load balance network, which is shown in Figure 4. Corresponding to different sink node number, the use of 6 kinds of data acquisition time interval: 10, 20, 30, 40, 50, 60 seconds. By the average life-time of sensor networks with the heaviest load node packet traffic. Figure 4 and Figure 5 show the configura-tion different sink node corresponding to the number of network lifetime and network traffic. Ns in the figure represents the number of sink nodes in the network configuration.
Figure 4. The diagram of the network topology.
Figure5. The comparison of network lifetime.
Figure6. The comparison of network dataflow.
10 15 20 25 30 35 40 45 50 55 60 0
50 100 150 200 250 300 350
Sampling time interval(s)
N
et
w
or
k
l
if
et
im
e(
h)
Ns=1 Ns=2 Ns=3
10 15 20 25 30 35 40 45 50 55 60 0
0.5 1 1.5 2 2.5 3 3.5 4
Sampling time interval(s)
A
v
er
age dat
af
low
of
t
he node w
it
h m
ax
im
um
l
oad (
pac
k
et
)
[image:5.595.195.432.337.710.2]In Figure 5, with the increase of sink node number, different layers of the network, the more the shorter the network lifetime. Reflected in order to improve the energy of the price of single hop transmission distance. From Figure 6, you can see that with the increase of number of sink nodes in the network configuration, congestion of the heaviest load node is 1/Ns times to fall, decreases in the packet queuing delay of high efficiency in the net-work. Embodies the algorithm of the thought of distribution of average flow rate, different levels and flow dis-tribution is not affected by other factors only concerned with Ns. Such as adopting multimode network grade, can solve the problem of the bottleneck of sink node place, but a few jump for near the sink node within the scope of the sensor nodes there is still a bottleneck problem, the multimode multi-level model can guarantee the sink node data into 1/Ns times decreased, guaranteeing each layer nodes forward data into 1/Ns times down. Data collected in this experiment with the method of periodic query, query is frequent, rapid energy consump-tion. For the query frequency is low or emergency is mainly used to collect the network packets sensor networks, network lifetime will be much longer.
5. Conclusion
Combined with the characteristics of the transmission system, the long chain tree network structure is put forward. The recent convergence node of sensor network is easy to form a “funnel”, the multimode hierarchical network is built for load balance. Monitoring sensor network was applied to transmission line which has the advantages, and faces many difficulties, however. There are still some technical problems to be studied, mainly including transmis-sion bandwidth, transmistransmis-sion distance, node power supply and electromagnetic compatibility, network security etc.
Acknowledgements
This work is supported by National Natural Science Foundation of China (No. 60974125).
References
[1] Lu, J.-Z., Zhang, H.-X., Fang, Z. and Li, B.(2009) Result and Its Analysis of Ice Disaster Monitoring of Hunan Power System. Power System Protection and Control, 37, 99-105.
[2] Huang, X.B., et al. (2008) Transmission Line On-Line Monitoring and Fault Diagnosis. China Electric Power Press, Beijing.
[3] Lv, Z.-A. (2008) ZigBee Network Theory and Applications Development. Beihang University Press, Beijing.
[4] Wang, Y.-G., Yin, X.-G., You, D.-H., et al. (2009) A Real-Time Monitoring and Warning System for Electric Power Facilities Icing Disaster Based on Wireless Sensor Network. Power System Technology, 33, 14-19.
[5] Zhao, Z.-H., Shi, G.-T., Han, S.-L., et al. (2009) A Heterogeneous Wireless Sensor Network Based Remote District High-Voltage Transmission Line On-Line Monitoring System. Automation of Power System, 33, 80-84.
[6] Hull, B., Jamieson, K. and Balakrishnan, H. (2014) Mitigating Congestion in Wireless Sensor Networks. Proceedings of the 2nd ACM Conference on Embedded Networked Sensor Systems (SenSys), Baltimore, Vol. 3, 556-664.
[7] EI Gamal, H. (2013) On the Scaling Laws of Dense Wireless Sensor Networks. IEEE Transactions on Information Theory, April 2013, Submitted to Publication.
[8] Guo, R.C., Xu, Z.Z. and Li, X.L. (2007) Typical Design of Transmission Lines with Voltage Grades from 110 kV to 500 kV and Its Application. Power System Technology, 31, 56-64.
[9] Gopala, P.K. and EI Gamal, H. (2010) On the Scaling Laws of Multi-Modal Wireless Sensor Networks. Annual Joint Conferences of the IEEE Computer and Communication Societies (INFOCOM), Hong Kong, Vol. 6, 234-243.
[10] Zheng, P., Zheng, G.S., Gong, Z.Y. and He, G.M. (2006) Research for Structure of Wireless Sensor Networks Based on Power Transmission Hallway. Engineering Journal of Wuhan University, 39, 115-118.
[11] Zhang, C.-Q., Li, M.-L. and Wu, M.-Y. (2007) An Approach for Constructing Load-Balancing Networks for Data Ga-thering Wireless Sensor Networks. Journal of Software, 18, 1110-1121. http://dx.doi.org/10.1360/jos181110
[12] Mohamed, R., Fahmy, S. and Pandurangan, G. (2013) Latency-Sensitive Power Control for Wireless Ad Hoc Networks. In: Boukerche, A., Ed., Proc. of the MS-WiM 2005, ACM Press, Montreal, 31-38.
[13] Wang, J.-M. (2009) Energy Level Selection for Wireless Sensor Network with Variable Transmit Power. Computer Engineering, 35, 108-110.