http://dx.doi.org/10.4236/epe.2015.79035
Hydrogen Engine and Numerical
Temperature-Entropy Chart for
Hydrogen/Air Cycle
Analysis
Elsayed M. Marzouk, Hamza A. Ghulman
Mechanical Engineering Department, College of Engineering and Islamic Architecture, Umm Al-Qura University, Makkah, KSA
Email: [email protected]
Received 18 June 2015; accepted 17 August 2015; published 20 August 2015
Copyright © 2015 by authors and Scientific Research Publishing Inc.
This work is licensed under the Creative Commons Attribution International License (CC BY).
http://creativecommons.org/licenses/by/4.0/
Abstract
Fast depletion of fossil fuels with its resources already passed its mid depletion region and the pollution levels already reached unsafe levels which make it utmost necessity to search for alter-native fuels to meet sustainable energy demand with minimum environmental impact. Among al-ternative fuels, hydrogen is considered as the near future, long term renewable, sustainable and non-polluting fuel. In the present paper, hydrogen fueled internal combustion engine fundamen-tals highlighted and presented relating to hydrogen combustion properties. A Mat lab programmed hydrogen temperature-entropy-energy chart is developed and presented for fresh charge and products of combustion at different excess air factors per mole combustion gases. The chart, then, used to represent a SI hydrogen-fueled fuel/air cycle analysis, which proved to be valuable design tool for engine sizing and for prediction of engine performance. Predictions carried out using the hydrogen F/A cycle analysis at different λ show low brake specific fuel consumption and low vo-lume specific power compared with conventional SI engine.
Keywords
Hydrogen Engine, H2-Combustion Properties, H2-Fueled SI Engine,
Temperature-Entropy Chart, Fuel/Air Cycle Analysis
1. Introduction
strin-gent regulations on environment from exhaust emissions and future predictions for depletion of world petroleum reserves give strong impetus for research in the areas of alternative fuels and novel propulsion engines. Various alternative fuels such as LPG (Liquefied Petroleum Gas), Alcohols (Methanol and Ethanol), NG (Natural Gas), Biodiesel and Bio gasoline, and H2 (Hydrogen) have been given as substitutes for conventional hydrocarbon to
reduce exhaust emissions [1]. Report [1] also highlighted and presented the novel propulsion engine at present time. Among these alternative fuels, hydrogen is considered as the near future, the long term renewable, sus-tainable, recyclable and non-polluting fuel [2]. Hydrogen-fueled internal combustion engine (ICE) is considered as the bridging technology from gasoline and diesel engines into the fuel cell engines. Significance is being at-tached to hydrogen in view to its CO2 free combustion, its properties and due to the fact that it can be produced
from various feed stocks including renewable energy sources [3]. Though nitrogen oxides (NOx) emissions are
formed upon hydrogen combustion, it can be minimized to low concentrations compared with hydrocarbon fuels
[4].
2. Combustion Properties of Hydrogen
The following are some important characteristics of hydrogen which affect the technical development of hydro-gen internal combustion engines.
2.1. Flammability Range
Hydrogen has a wide flammability range (4.0% - 75% compared to 1.4% - 7.6% by volume in air for gasoline). This is of utmost importance for safe handling of hydrogen. However, this leads to the suitability for use in lean burn mixture engine. Lean mixture allows for better complete combustion and better thermal efficiency i.e. bet-ter economy. This in turn permits for lower for lower maximum combustion temperature that leads to lower ni-trogen oxides (NOx) [3] [5].
2.2. Quenching Distance
Hydrogen has a small quenching distance of 0.6 mm compared to 2.0 mm for gasoline. This is the distance from the cylinder wall where flame front extinguishes. This means it is more difficult to extinguish the hydrogen flame and implies more susceptibility of the engine to backfire since the hydrogen-air mixture flame more easily passes through valves than the gasoline-air mixture flame [3] [6].
2.3. Flame Speed
Hydrogen burns with high flame front speed. This allows hydrogen engines to thermodynamically more closely approach the constant volume heat addition ideal cycle. This resemblance is adequate for stoichiometric mixture, when hydrogen engine runs lean to improve fuel economy and reduce nitrogen oxides, the flame speed slows down. However, it is still very much higher than the gasoline-air mixture flame speed [3] [6]. Flame speed and maximum combustion temperature are of prime concern for thermal efficiency and emissions.
2.4. Auto-Ignition Temperature
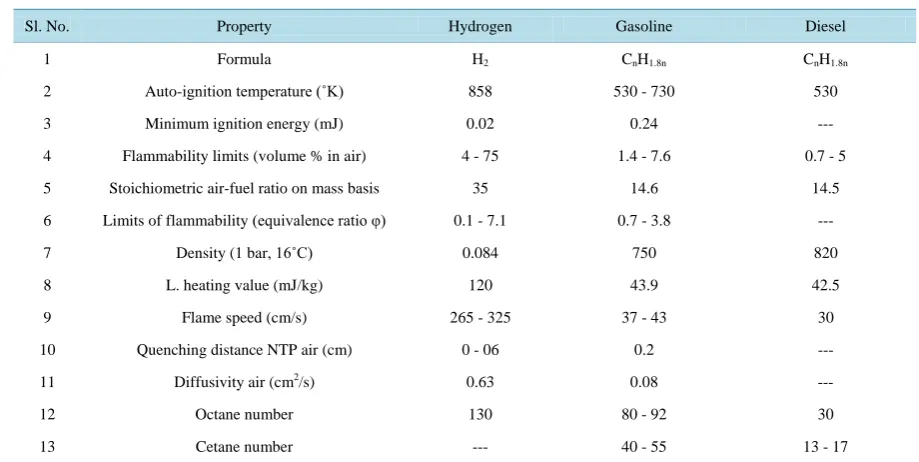
Self-ignition temperature of hydrogen is high as 585˚C. This makes it difficult to ignite the hydrogen-air mixture without an external ignition source. Table 1 shows this temperature compared to gasoline and diesel fuels. The table also summarizes the other important properties. The auto-ignition temperature is an important property in determining the maximum compression ratio (Higher Useful Compression Ratio) that an engine can operate at
[7].
2.5. Minimum Ignition Energy
Table 1. Properties of hydrogen and conventional fuels.
Sl. No. Property Hydrogen Gasoline Diesel
1 Formula H2 CnH1.8n CnH1.8n
2 Auto-ignition temperature (˚K) 858 530 - 730 530
3 Minimum ignition energy (mJ) 0.02 0.24 ---
4 Flammability limits (volume % in air) 4 - 75 1.4 - 7.6 0.7 - 5
5 Stoichiometric air-fuel ratio on mass basis 35 14.6 14.5
6 Limits of flammability (equivalence ratio φ) 0.1 - 7.1 0.7 - 3.8 ---
7 Density (1 bar, 16˚C) 0.084 750 820
8 L. heating value (mJ/kg) 120 43.9 42.5
9 Flame speed (cm/s) 265 - 325 37 - 43 30
10 Quenching distance NTP air (cm) 0 - 06 0.2 ---
11 Diffusivity air (cm2/s) 0.63 0.08 ---
12 Octane number 130 80 - 92 30
13 Cetane number --- 40 - 55 13 - 17
2.6. Stoichiometric Air-Fuel Ratio and Mixture Energy Content The stoichiometric combustion equation for hydrogen in air is:
(
)
2 2 2 2 2
H +1 2 O +3.76N →H +1.88N (1)
Stoichiometric air/fuel ratio is = 8/0.23 = 35
2
air H
kg kg
The excess air factor
(
A F)
35λ= (2)
MOLS of air/MOL of hydrogen for complete combustion = 2.38.
This corresponds to stoichiometric volume percent of hydrogen in air-fuel mixture = 29.5.
For gasoline the volume percent of fuel in stoichiometric fuel-air mixture is only 1.76, with (A/F)st = 14.6.
Despite the lower calorific value of hydrogen is 120 mJ/kg compared to the gasoline as 44 mJ/kg, the energy content per m3 of gas fuel-air mixture under standard atmospheric conditions is lower [8]. Based on flammabili-ty range by volume in air, the flammabiliflammabili-ty limits of hydrogen vary from equivalence ratio φ from 0.1 to 7.1. This enables the engine to run well into the lean mixture and prompts ignition and hence higher thermal effi-ciency [9]. Table 1 compares the properties of hydrogen and gasoline and diesel fuels.
2.7. Low Density
Without significance compression or conversion to liquid hydrogen, a very large volume may be necessary to store enough hydrogen to provide adequate drive range. It also implies the fuel-air mixture has low energy per unit mixture volume which reduces the engine output for carburetor or inlet port fuel induction. Thus, when hy-drogen engine run lean issues of inadequate power arise [3].
2.8. Configurations of Hydrogen Induction in ICE
3. Models for H2 Four Stroke Engine Cycle
The flame speed of hydrogen-air mixture is very high so that the ideal theoretical reference cycle would be the constant volume heat addition cycle. Also, to prevent excessive temperature inside the engine cylinder, the excess air factor λ must be higher than stoichiometric (preferable set to 1.5 - 2). The maximum end temperature Tgobtained upon combustion of H2-air mixture at constant volume, for fuel lower calorific value of 120 mJ/kg
is:
(
F∗L.C.V.) (
+ F C∗ va∗TA) (
= A+F)
∗Cvg∗Tg (3)(
)
120000 35+ λ∗Cva∗Ta= 35λ+ ∗1 Cvg∗Tg (4)
Taking Cva = 0.718 kJ/kg˚K, Cvg = 1.0 kJ/kg˚K is given in the following Table 2.
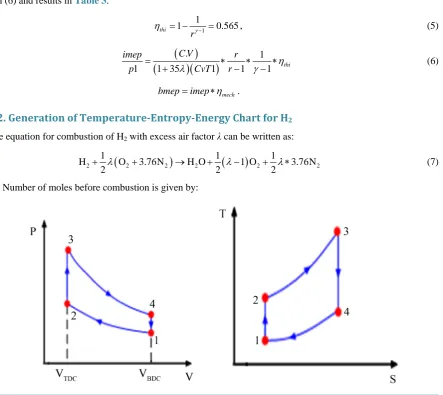
3.1. Ideal Gas Standard Cycle (Figure 1)
The working fluid in this cycle is assumed as air with constant specific heats with no fuel combustion but with equivalent amount of heat transferred through the cylinder wall. The specific heat ratio is taken as 1.4 and the compression ratio is 8. Assuming T1 = 400˚ K, P1 = 1 bar.
The indicated thermal efficiciencyand the indicated mean effective pressure are obtained from Equations (5) and (6) and results in Table 3.
1 1
1 0.565
thi rγ
η = − − = , (5)
(
)
(
)(
)
. 1
1 1 35 1 1 1 thi
C V
imep r
p = + λ CvT ∗r− ∗γ− ∗η (6)
mech
bmep=imep∗η .
3.2. Generation of Temperature-Entropy-Energy Chart for H2 The equation for combustion of H2 with excess air factor λ can be written as:
(
)
(
)
2 2 2 2 2 2
1 1 1
H O 3.76N H O 1 O 3.76N
2λ 2 λ 2λ
+ + → + − + ∗ (7)
[image:4.595.99.543.313.708.2]- Number of moles before combustion is given by:
Table 2. Maximum temperatures for different λ values.
λ A/F Tg, ˚K
1.0 35 3613
1.5 52.5 2525
2 70.0 1973
2.5 87.5 1640
Table 3. Variation of bmep & imep for different λ.
λ P1 T1 P2 T2 P3 T3 P4 T4 imep bmep
1.0 1 400 18.4 919 3613 72.34 1573 3.93 18.74 15.93
1.5 1 400 18.4 919 2525 50.55 1099 2.75 12.60 10.71
2.0 1 400 18.4 919 1973 39.5 859 2.15 7.62 6.46
0.5 1.19 per Kg of Hydr
1 3.76 1
og 2.38
2 2
en
R
n λ λ λ
λ
= +
= + + = +
(8)
- Number of moles after combustion is given by:
(
)
0.25 1.19 1
per Kg of Hy 1 drog 3.76 2 2 en p
n λ λ
λ − + = + + = (9)
The calorific value is then L.C.V. = 120 MJ/kg hydrogen
(
)
cgL.C.V. 120
0.25 1.19 mJ mol
p
n = + λ
The following table shows (Table 4)
cg L.C.V.
mol for different values of (λ).
The products of combustion are shown in Table 5:
The molar specific heat of each constitutes of the combustion gases as function of temperature (T) [8]. This is based on polynomial curve fit to thermodynamic data assuming that the unburned mixture is frozen in composi-tion and the burned mixture is in equillibrium. This is based on the equilibrium NASA program [12].
2 2 2 2 2 2
2 3 4
O O ,1 O ,2 O ,3 O ,4 O ,5
p a a T a T a T a T
C = + + + + (10)
Similar terms for CpH O2 , and CpN2 as function of temperature.
As: ,1 ( )1
5 1
i i i
Cp =
∑
a T − (11) These specific heats of products of combustion are also function of (λ), the combustion gases molar specific heats at every temperature can be obtained in KJ/Kmolcg.˚K as:(
)
2 2 2
H O O N
1
1 3.76
2 2
g
C C C C
ncg ncg
p
cg p
n
p λ− λ∗ p
∗ ∗
= + + (12)
If the reference state for internal energy
( )
u and enthalpy( )
h is taken as u0 =0, h0 at T0 = 0˚ KThe internal energy and enthalpy can be obtained at different temperatures and different excess air factor λ as:
0 d
T g u=
∫
Cv T,0 d
T g
Table 4. (L.C.V. per molcg) for different λ values.
λ 1 1.5 2 4
2
moles
KgH 1.44 2.035 2.63 5.01
. . .
cg
L C V
mol 83.33 58.99 45.63 23.95
Table 5. Products of combustion of hydrogen.
M Number of moles λ = 1 λ = 1.5 λ = 2 λ = 4
O2 32
1 2 λ −
0 0.25 0.5 1.5
N2 28
3.76 2
λ
1.88 2.88 3.76 7.52
H2O 18 1 1.0 1.0 1.0 1.0
Total number of moles 2.88 4.07 5.26 10.02
The entropy at any given temperature and excess air factor λ also can be obtained if the reference state point is taken as:
0 0
S = at P0 = 1 bar, T0 = 300˚ K and v0 =24.94 m kmol3 , so that,
0
0
d ln
T g T
T P
Sp Cp R
T P
=
∫
− (14)0
0
d ln
T g T
T v
Sv Cv R
T v
=
∫
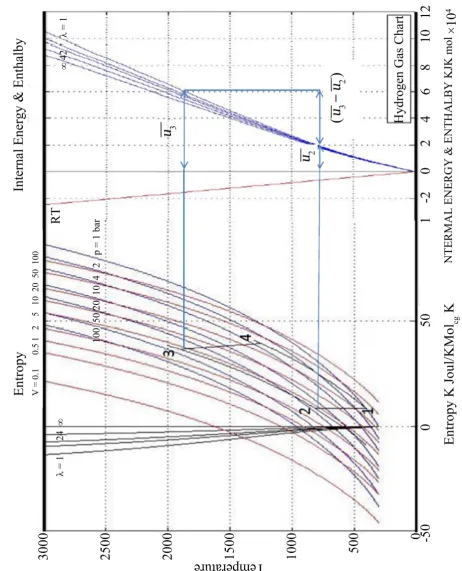
− (15)MATLAB is used in programmed mode to construct the temperature-entropy
( )
T S- chart with constant pressure lines and constant specific volume lines, for different excess air factors λ, s. The temperature-internal energy lines(
T u-)
and the temperature-enthalpy lines( )
T h- are also constructed on the chart for different excess air factors λ, s. All properties are given per mole combustion gases for reactants and products of combus-tion. The constructed temperature-entropy chart is shown in Figure 2 with some selected pressure and specific volumes lines and selected excess air factors.3.3. Fuel-Air Cycle Analysis for Hydrogen
In this analysis, the actual fuel-air working fluid is used and the combustion is assumed to occur instantaneous at TDC. The change of specific heat of the reactants and products of combustion is taken into the analysis. The change of the number of molecules and dissociation effects are taken into account. However, as the mixture excess air factor is 1.5 or more, the effects of dissociation are minimal. As a demonstration to the numerical procedure, the hydrogen SI four stroke engine cycles is applied to the generated
( )
T S- chart. The engine is four stroke, water cooled engine having compression ratio r of 8 with hydrogen mixture excess air factor λ of 1.5. The in cylinder gases condition at start of compression stroke is taken as P1 = 1 bar and T1 = 400˚ K. Theisen-tropic compression from the known state point (1) to state point (2) with the known specific volume v2 from the specified engine compression ratio, is iterated using Equation (15) for an excess air factor λ = ∞ and initial guess of T2. The temperature T2 is incremented until Sv2 =Sv1+0.001. At state (2) combustion carried out
in-stantaneous and the working fluid changes into products of combustion at λ = 1.5. The lower calorific value is =
cg 120000
diesel fuel/air cycles , all heat of combustion is added at constant volume due excessively high flame speed. The internal energy of combustion gases u3 is obtained from qeffective =u3−u2. The maximum cycle
tem-perature is determined from u3 and the internal energy vector of combustion gases at different temperatures
for λ = 1.5 generated from Equation (13). For the constant specific volume line and known temperature deter-mine the specific entropy per mole combustion gases at state (3). Isentropic expansion from state (3) to state (4) with known specific volume v4 is iterated using Equation (15) for excess air factor λ = 1.5 and an initial guess
lower than T4 lower than T3. With the temperature T4 progressively decreased until Sv4=Sv3±0.001. The
properties of gases at state (4) is determined to obtain the exhaust gas loss, from which then, the indicated work done per cycle is determined. Engine sizing and performance parameters are predicted.
The hydrogen/air cycle numerical representation is shown in the Figure 2 for engine compression ratio of 8 and λ = 1.5. The procedure is summerized as follows:
Point (1)
P1 =1bar, T1=400˚ K,
3 1 33.26 m molcg
v =
1 8572 kJ molcg
u =
Point (2) Compression is isentroic from state (1) to (2) where v2=4.16 m mol3 cg
P2 = 13.75 bar, T2 = 767˚ K, Then, qeffective =u3−u2 =38919 kJ molcg
T3 = 1883˚ K 4 35238 kJ molcg
u =
Heat lost in exhaust = 35,238 – 8572 = 26,666 kJ/molcg
IWD = 38,919 – 26,666 = 12,253 kJ/molcg
The indicated thermal efficiency:
12253
20.8% 58968
thi
η = = , η =bth 18.1%, the indicated mean effective pressure
(
1 2)
. cycle 12253
33.25 421.1 kpa
W D
v v
imep =
−
= = , brake mean effective pressure.
bmep = 421.1 * 0.87 = 366.33 kpa, where ηmechanical = 0.87
brake specific fuel consumption (bsfc) = 3600
0.181 12000× 0 =0.166 kg kw h⋅ r
If the engine develops 50 kW @ N = 5000 rpm, L/D = 1 bmep =
2
b
s
P N V ∗
, Vs = 3.27 liters with L = D =
10.1 cm. Pb/liters = 15.3 (which is low compared to modern gasoline engines).
The fuel/air cycle analysis of performance predictions compares very well with the actual engine cycles for petrol and diesel engine using hydrocarbon fuels [8]. The results obtained in the present work for hydrogen/air cycle analysis show a good estimate of engine sizing power developed and bsfc compared to that of actual en-gine. Also peak pressures and exhaust temperatures that affect engine structure and design can be closely pre-dicted. The effect of many variables on hydrogen engine performance can also be understood.
For a certain engine configuration, CFD code Fluent which include the turbulence and detailed combustion processes that are modeled with sufficient generality to include delay period, chemical kinetics and flame prop-agation is then required. This simulation will give good understanding of in cylinder gas motion with detailed combustion process that are essential to improve performance and reduce emissions without sacrificing fuel economy and to study the effects of using different hydrogen fuel induction methods [13].
4. Conclusion
Figure 2. F/A cycle representation on temperature-entropy chart.
References
[image:8.595.76.539.81.653.2]Report Department of Mechanical Engineering, Report No. 9, Makah, KSA.
[2] Antunes Gomes, M.J., Mikalsen, R. and Roskilly, A.P. (2008) An Investigation of Hydrogen Fuelled HCCI Engine Performance and Operation. International Journal of Hydrogen Energy, 33, 5823-5828.
http://dx.doi.org/10.1016/j.ijhydene.2008.07.121
[3] Gillingham, K. (2007) Hydrogen Internal Combustion Engine Vehicles: A Prudent Intermediate Step or Step in the Wrong Direction. Department of Management and Engineering, Global Climate and Energy Project, Precourt Institute for Energy Efficiency, Stanford University.
[4] Saravanan, N., Najarajan, G., Sanjay, G. and Dhanassekaran, C. (2008) Combustion Analysis of a DI Diesel Engine with Hydrogen in Dual Fuel Mode. Fuel, 87, 3591-3599. http://dx.doi.org/10.1016/j.fuel.2008.07.011
[5] Ciniviz, M. and Kose, H. (2012) Hydrogen Use in Internal Combustion Engine: A Review. International Journal of Automotive Engineering and Technologies, 1, 1-15.
[6] Wahab, A. and Aswad, M. (2009) Addition of H2 to Gasoline Fuelled 4-Stroke SI Engine Using 1-Dimensional
Analy-sis. Faculty of Mechanical Engineering, University of Malaysia Pahang, 1-68.
[7] Gupta, B.R. (2008) Hydrogen Fuel Production, Transport and Storage. CRC Press, Boca Raton, 1-603.
[8] Heywood, J.B. (1988) Internal Combustion Engine Fundamentals. McGraw-Hill Co., New York
[9] White, M.C. and Lutz, E.A. (2006) The Hydrogen Fuelled ICE: A Technical Review. International Journal of Hydro-gen Energy, 31, 1292-1305. http://dx.doi.org/10.1016/j.ijhydene.2005.12.001
[10] Saravanan, N., Najarajan, G., Sanjay, G. and Dhanassekaran, C. (2007) Experimental Investigation of Hydrogen Port Fuel Injection in DI Diesel Engine. International Journal of Hydrogen Energy, 32, 4071-4080.
http://dx.doi.org/10.1016/j.ijhydene.2007.03.036
[11] Das, M.L. (2002) Hydrogen Engine: Research and Development (R&D) Programmers in Indian Institute of Technolo-gy, Delhi. International Journal of Hydrogen Energy, 27, 953-965.
http://dx.doi.org/10.1016/S0360-3199(01)00178-1
[12] Svehla, R.A. and McBride, B.J. (1973) Fortran VI Computer Program for Calculation of Thermodynamic and Trans-port Properties of Complex Chemical Systems. NASA Technical ReTrans-port TND-7056.
[13] Belal, T.M., Marzouk, E.M. and Osman M.N. (2013) Investigating Diesel Engine Performance and Emissions Using CFD. Journal of Energy and Power Engineering, 5, 171-180. http://dx.doi.org/10.4236/epe.2013.52017
Nomenclature
,1,2,3, ,5
i
a : Polynomial coefficients for i-gas constituents.
A: Fuel flow rate (kg/hr).
i
Cp , Cpcg, Cpa: Molar specific heat at constant pressure of i-gas constituents, combustion gases and air
(kJ/mol.˚K).
i
Cv , Cvcg, Cva: Molar specific heat at constant pressure of i-gas constituents, combustion gases and air
(kJ/mol·˚K).
D: Cylinder bore (cm).
F: Fuel flow rate (kg/hr). (A/F): Mass air-fuel ratio.
h: Molar specific enthalpy (kJ/mol·˚K). L: Piston stroke (cm).
L.C.V.: Lower calorific value (kJ/kg). N: Engine rotation speed (rpm).
P: Absolute pressure (bar, kPa).
R Universal gas constant (8.314 kJ/mol·˚K).
S Molar specific entropy (kJ/mol·˚K).
T: Absolute temperature (˚K).
u: Molar specific internal energy (kJ/mol·˚K). v: Molar specific volume (m3/mol).
ɣ: Specific heat ratio.