A Model for Computer Worm Detection in a
Computer Network
Adebayo O.T
Department of Computer Science
Federal University of Technology Akure,Nigeria
Alese B.K
Department of Computer Science
Federal University of Technology Akure,Nigeria
Gabriel A.J
Department of Computer Science
Federal University of Technology Akure,Nigeria
ABSTRACT
This research presents a novel approach to detecting computer worms in Computer Networks by making use of detection based on the network behavior through the collection of various parameters such as: network latency, throughput, bandwidth, response time, network utilization, packet loss and reliability. Infected hosts were tracked using an algorithm developed. Documentation of network measurements (behavior) metrics for the purpose of detecting unknown worm infection using instance-based technique was achieved by taking note of the changes in the network parameters and their values were logged in the database, as worm propagated through the network. a model for calculating network performance characteristic was developed. Network Worm Simulator (NWS) was used to perform the scanning activities of worms on the network. Jpcap was used to captured network packet. In the database model, the Packets table store network packet captured, the time of capture and every packets stored is given a unique number as id. The network_metric table store the network parameter values for the packets identified by Packet_id related to the Packets table, each set of network parameter value is identified by a unique number called ID. The simulation of the model was implemented using Java programming language.
Keywords
Activity, Behavior, Network_metric, Packet_id, Propagate,
1.
INTRODUCTION
Security has been one of the primary concerns since the advent of computers. Computer networks are continually been plagued with myriads of security threats [5]. They are under attack every day, and thwarting the attacks is the basic challenge of network security researchers. Despite impressive advances in defensive measures, malicious software continues to pose a major threat to information security [2].
Computer networks (such as the Internet), are persistently threatened by many types of attacks such as viruses, and worms. Among various malware, worms interest computer security researchers immensely due to their ability to infect millions of computers in a short period of time and cause hundreds of millions of dollars in damage[9]. Unlike other malware, worms can replicate themselves over the Internet without requiring any human involvement, which makes their damage potential very high.
Computer worms are self-propagating program that spreads over a network, usually the internet. Worms spread by locating other vulnerable potential hosts on the network (e.g.,
via scanning or topological analysis), then copying their program Instructions to those hosts. The scanning process is required to search and find the next attack target in the propagated worm. The host infected by the worm is characterized by accesses from a large number of IP address, occurring rapidly over a short duration [6].
2. REVIEW OF RELATED WORKS
In (Staniford et al,2002) a proposal was made for establishing a cyber “Center for Disease Control” that took leading roles of identifying worms, counter measuring worm propagation, analyzing new vectors and new worms.[8] proposed to set up distributed “network telescopes” using a reasonable large fraction of IP space to observe security events occurring on the Internet. In practice, SANS established an “Internet Storm Center” that collects security logs from distributed intrusion detection systems (IDS) around the globe. The nature of some of the approaches is to take advantages of distributed security sensors to gather security information from wide cyber territories. Correlation techniques are then applied to analyze information and identify worms. [12] proposed a Kalman filter-based detection algorithm. This approach detects the trend of illegitimate scans to a large unused IP space.[11] proposed a victim counter-based detection algorithm that tracks the increased rate of new infected hosts. Worm alerts are output when anomaly events occur consecutively over a certain number of times.[3] proposed to use ICMP “Destination Unreachable” messages collected at border routers to infer worm activities. This approach is based on threshold-based anomaly detection. Researchers have also used honeypots to distract attackers, early warnings about new attack techniques and in-depth analysis of an adversary’s strategies [1].In [7], researchers used honeypots inside a university to detect infected machines behind a firewall. This augmented an existing IDS and sometimes provided earlier warnings of compromised machines.
3. SYSTEM MODELING AND DESIGN
The system is designed to achieve the following:
Creation of an isolated local network of computers, which provided the needed internet network environment.
injection and propagation of computer worm within the network, using Network Worm Simulator( NWS)
Track infected host using an algorithm
Documentation of network
The goal is to detect worm spread by monitoring the behaviour of the network.In order to measure network performance, a local area network of computers to depict a normal network environment for the propagation of worm was simulated. This setup enabled the measurement of some network parameters and their values were saved in the database, as worm is allowed to propagated through the network. Network worm was simulated using NWS and allowed to propagate through the network .In order for worm to find the next target host, it must scan. Three different scanning techniques were applied namely : random, routable and divide-conquer.
3.1 SIMULATING NETWORK WORMS
In order for to propagate worn in the network, Network Worm Simulator (NWS) system was used to model real world worms .NWS simulations model fully-connected networks, using "network" in a more graph theoretic sense similar to a TCP/IP sense. Every network-connected entity can send a message to any other entity in the simulation. Each network-connected entity has an address consisting of a single number. Writing a simulation requires a NWS system to set the address space size, the largest number that gets used as an address.NWS is designed using Perl programming language. The available framework provides the application programming interface (API) for writing a Perl program using NWS objects and their methods. A network links are connected to nodes called hosts. A host can contain instances of software that the host executes consistently or periodically. The network allows hosts to communicate with each other via messages or streams of messages.
3.2
SYSTEM ALGORITHM FOR WORM
DETECTION BASED ON NETWORK
BEHAVIOR
Procedure System-Check-X(host)
host:hits 0 host:scans 0
while Should-Halt(host) = No do . Iterate while loop once per unit of time(10sec)
for i 1 tohitListdo Propagate(host)
end for end while end procedure
procedure Propagate(host)
target a host chosen by a (random | routable | divide and conquer) scan
if target is vulnerable and uninfected then host infects target
target runs System-Check-X(target) Communicate(host; target) host:hitshost:hits + 1
calculateNetworkParam(host, target)
else if target is vulnerable & infected then Communicate(host, target) host:hitshost:hits + 1
end if
host:scanshost:scans + 1
end procedure
function Should-Halt(host) ifhost:scans> 0 then
host:hits=host:scans V =infected
N= available
if N != Vand V < N then
return Yes //more target
end if end if
return No //no target
end function
procedure Communicate(hostA,hostB)
//hostA share sumHits and sumScan with hostB sumHitshostA:hits + hostB:hits
sumScanshostA:scans + hostB:scans hostA:hitssumHits
hostA:scanssumScans hostB:hitssumHits hostB:scanssumScans
end procedure
procedure calculateNetworkParam(host, target)
opennewlogFile:netLog
while time <= 60 do .
netService:calculateParameters lognetLog:networkLatency lognetLog:throughput lognetLog:Bandwidth lognetLog:responseTime lognetLog:networkUtilization lognetLog:packetLoss lognetLog:Reliability waitTime(10sec)
end while end procedure
3.3 Formulas Adopted For Calculating the
Various
Network
Performance
Characteristics
This section provides the model for calculating the following parameters model for network performance characteristic: network latency, throughput, bandwidth, response time, network utilization, packet loss and reliability.
3.3.1 Network Latency
The total latency , observable in a network with N number of switches is defined as:
For the maximum size Ethernet frame (1500 bytes) at 100 Mbps the latency is 120 µs. For comparison, the minimum size frame (64 bytes) at Gigabit speeds has a latency of just 0.5 µs.
is the store and forward Latency of a switch, FS is the
frame size in bit and BR is the bit rate in bits/s.
Switch Fabric Latency (LSW) refers to the delay observed in
Wire line Latency (LWL) : refers to delay experience along a
transmission media. Bits transmitted along a fiber optic link travel at about ⅔ of the speed of light (3x10⁸
m/s).
LWL = D / (0.67 × 3×108 m/s) 3.10
For distances (D) involved in local area networks, delay becomes trivial compared with the other contributions to latency.
Queuing Latency (LQ): Ethernet switches use queues in
conjunction with the store and forward mechanism to eliminate the problem of frame collisions that used to exist on broadcast Ethernet networks. For a network with no traffic load, the queuing latency for a frame will be nil. For a loaded network, the likelihood of a frame already in the queue is proportional to the network load. The average queuing latency can then be estimated as:
LQ = (Network Load) × LSF(max) 3.11
3.3.2 Throughput
Genrally, throughput is usually measured in bits per second (bit/s or bps), and sometimes in data packets per second or data packets per time slot.
is the throughput;WS is the window size (maximum amount of received data, in bytes, that can be buffered at one time on the receiving side of a connection, usually in kilobyte) and
is the latency of transmission.
3.3.3
Bandwidth
Bandwidth in computer networking refers to the data rate supported by a network connection or interface. It is measured in bits per second (bps)
is the bandwidth measurement, BS is the base file size being transferred across the network and V is the number of times the file is accessed
3.3.4
Response Time
Response time is the elapsed time between the end of an inquiry or demand on a computer system and the beginning of a response.
Average response time is the sum of round trip response (RTT) for n requested packets.
3.3.5
Network Utilization
Network utilization is the amount of traffic on the network compared to the peak amount that the network can support. This is generally specified as a percentage (the ratio of current network traffic to the maximum traffic that the port can handle).
is the network utilization value measured in percentage.
is the number of bytes that are sent in a specified duration.
the number of bytes that are received in a specified duration. is the Network card bandwidth which is usually 10Mbps, 100Mbps and 1Gbps, and M The duration time in seconds that we did our tests to calculate the number of bytes that are sent or received.
3.3.6
Packet Loss
Packet loss occurs when one or more packets of data travelling across a computer network fail to reach their destination. Calculate the packet loss ratio using the following formula to determine your packet loss ratio
Where is the number of lost packet and is the number of packets received successfully
3.3.7
Reliability
Reliability is an attribute of network that consistently performs according to its specifications, ensuring that each segment that the source sendsdata arrives at the destination. Each element in a network is represented as a two terminal device, the state of each element I of the network is either good (operating) with a probability pi or bad (failed) with
probability qi. such that, pi + qi =1. Typically, the probability
is obtained as
Where refers to the mean time to repair and is the mean time between failures of a component i.
4.1 SYSTEM INTERFACE DESIGN
The network design chosen for the implementation of this system is a simple architecture. This is to ensure a manageable and secure environment for the implementation. However, it can still be achieved with more systems because the topology is scalable.
4.2
SYSTEM APPLICATION
The application is executed on one of the systems that forms the VM ware team while the worm-scan-activities is ongoing on the net due to the execution of NWS on the same machine or another. The controls and menu in the application system is disabled when it is started, to enable the control click on the FILE menu and select the ENABLE option. The EXIT option terminates the application. To keep record of all network parameter at specific time interval select the Save Activities
option from Activity menu. The Network Summary control found in the group of activity control; display the list of available network interface in the system (operating system level) for creating a network connection. The names of the interfaces are displayed on the activity analysis panel, while the characteristics of each interface are displayed in the
displayed on the activity analysis panel. Throughput control determines the throughput of the network before the worm activity on the network. The host the request is sent to and the average throughput is displayed on the activity analysis
panel, while the packet sent and reply information is displayed on the Network Packet Flow panel. To display the network packet traffic and other parameter of the network, use the Net Packet control, the packet traffic is given a number and it’s
displayed on Network Packet Flow panel and the details (such as source/destination IP, checksum, protocol version, hop limit ) of each shown in activity analysis panel. Figure 4.2 a shows the interface of the system application on startup with all the menus and controls disabled. Figure 4.2 b is a screen shot of the system interface showing the network traffic captured in network packet flow panel and the list of available network interface
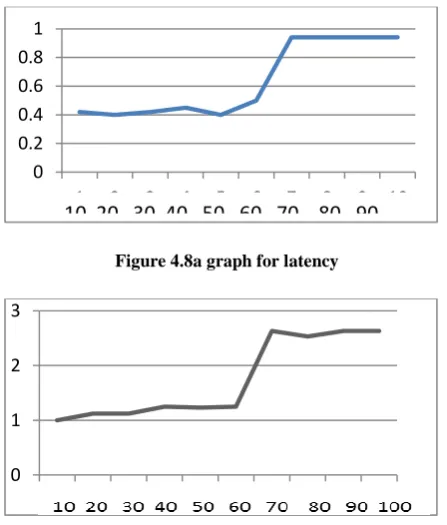
[image:4.595.316.538.60.502.2]The Graphs (figures 4.8a-4.8f) below show the results of network parameters for random scan
Figure 4.8a graph for latency
Figure 4.8b graph for response time
[image:4.595.317.536.71.177.2]Figure 4.8c graph for throughput
Figure 4.8d graph for network utilization
Figure 4.8e graph for packet loss
Figure 4.8f graph for reliability
The Graphs(figures 4.9a-4.9f) below show the results of
[image:4.595.53.277.283.546.2]network parameters for routable scan
Figure 4.9a graph for latency
0 0.2 0.4 0.6 0.8 1
1 2 3 4 5 6 7 8 9 10
10 20 30 40 50 60 70 80 90
0 1 2 3
1 2 3 4 5 6 7 8 9 10
0 0.5 1 1.5 2
1 2 3 4 5 6 7 8 9 10
0 20 40 60 80
1 2 3 4 5 6 7 8 9 10
0 5 10 15 20 25
1 2 3 4 5 6 7 8 9 10
0 0.2 0.4 0.6 0.8 1
1 2 3 4 5 6 7 8 9 10
0 0.2 0.4 0.6 0.8 1
[image:4.595.316.540.567.708.2]Figure 4.9b graph for throughput
Figure 4.9c graph for response time
Figure 4.9d graph for network utilization
Figure 4.9e graph for packet loss
Figure 4.9f graph for reliability
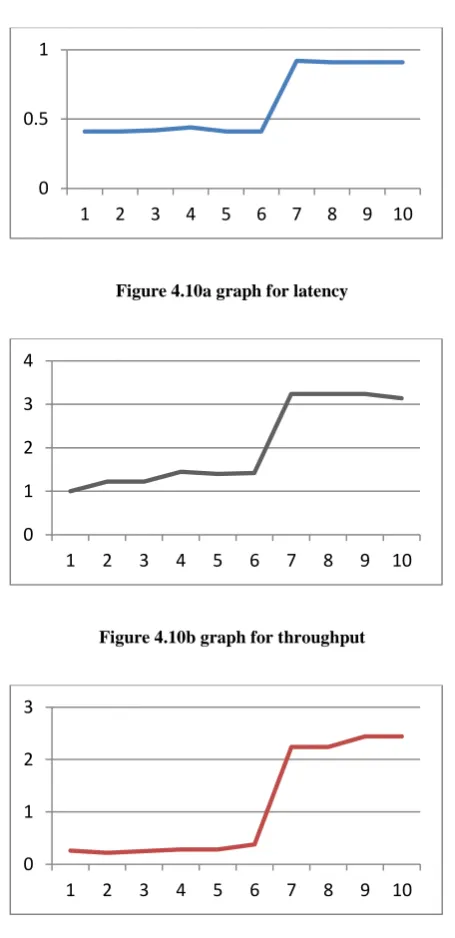
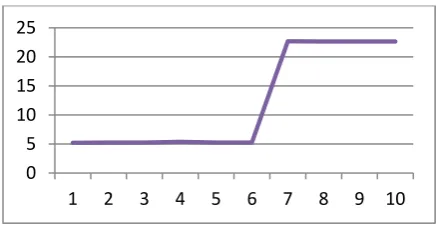
The Graphs(figures 4.10a-4.10f) below show the results of
[image:5.595.53.278.71.493.2]network parameters for divide-conquer scan
Figure 4.10a graph for latency
Figure 4.10b graph for throughput
Figure 4.10c graph for response time
0 1 2 3
1 2 3 4 5 6 7 8 9 10
0 0.5 1 1.5 2
1 2 3 4 5 6 7 8 9 10
0 20 40 60 80
1 2 3 4 5 6 7 8 9 10
0 10 20 30
1 2 3 4 5 6 7 8 9 10
0 0.2 0.4 0.6 0.8 1
1 2 3 4 5 6 7 8 9 10
0 0.5 1
1 2 3 4 5 6 7 8 9 10
0 1 2 3 4
1 2 3 4 5 6 7 8 9 10
0 1 2 3
[image:5.595.53.275.74.213.2] [image:5.595.312.540.264.734.2]Figure 4.10d graph for network utilization
Figure 4.10e graph for packet loss
Figure 4.10f graph for reliability
5. CONCLUSION
Excellent technology (i.e., anti-worms software packages) exists for detecting and eliminating known worms. Typically, anti-worms software packages inspect each file that enters the system, looking for known signs (signatures) which uniquely identify an instance of known malicious codes. Nevertheless, anti-worms technology is based on prior explicit knowledge of worm code signatures and cannot be used for detecting unknown worm codes. The goal of the research work, (which is to detect worm spread by monitoring the behaviour of the network) was achieved.
In the course of conducting this research work, it was noted that some of the existing computer worm detection models and systems are computationally inefficient, complex and resource consuming. Therefore, the following
recommendations have been made:
It is essentially not only enough to detect worm attacks with a high accuracy and low positive rate, but also to detect new computer worms quickly before a large number of hosts are infected.
A good worm detection system for computer network security requires effective focus on suspicious traffic while ignoring normal traffic. This has the effect of reducing the number of false alarms.
It is necessary to detect abnormal traffic patterns in a computationally efficient manner, especially under high traffic loads.
The presence of worm in a network can be detected through the collection of various parameters. Worm patterns are reflected by the infected computer network behavior which can be measured using various parameters.
Therefore, in this research work, a worm detection model for network security administrators to detect the presence of unknown computer worms by documenting network measurements (behavior) metrics using instance-based techniques, taking note of the changes in some network parameters has been developed.
6.
ACKNOWLEDGMENTS
Special thanks to the H.O.D Computer Science department FUTA, Prof S.O Falaki for the enabling environment provided in the period carrying out this research.
7. REFERENCES
[1] Addison, W.,Lance S. 2003. Honeypots: Tracking Hackers.
[2] Alese and Falaki, 2005 Malicious Codes and Computer Network Security. Journal of Research in Physical Sciences, Volume 1, Number 1, 2005.
[3] Berk ,V.H., Gray, R.S., and Bakos G.2003.Using sensor networks and data fusion for early detection of active worms. In Proceedings of the SPIE AeroSense,2003.
[4] Chen, Z., Gao, L., and Kwiat K 2003. Modeling the spread of active worms”. In Proceedings of The IEEE INFOCOM 2003, March 2003.
[5] Ibidunmoye E.O 2012 Design of a Stochastic Game Model of the Attacker-Deffender Interraction in a Network Environment, M.Tech Thesis,Federal University of Technology, Akure, Nigeria.
[6] Jangwon, C., Jaewook,L., Jahwan,K.,Byungyeon,P., Wonhyuk L., and Seongjin A.2005. Efficient Method for Detecting Worm Virus based Bloomlike Connection Behavior, GESTS Int’l Trans. Computer Science and Engr., Vol.18, No.1
[7] John, L., Richard, L., Henry, O., Didier,C., and
[8] Brian C.2003.The use of honeynets to detect exploited systems across large enterprise networks”. In 0
20 40 60 80
1 2 3 4 5 6 7 8 9 10
0 5 10 15 20 25
1 2 3 4 5 6 7 8 9 10
0 0.2 0.4 0.6 0.8 1
[image:6.595.54.275.219.345.2]Proceedings of the 2003 IEEE Workshop on Information Assurance.
[9] Moore,D.2002. Network telescopes: Observing small or distant security events.
[10]Parbati,K.M 2008 Detection, Propagation
[11]Modeling and Designing of Advanced Internet Worms”, a dissertation presented to the graduate school of the university of Florida in partial fulfillment of the requirements for the degree of doctor of philosophy university of Florida
[12]Suresh.R and Sieteng. S 2007 Telecommunication Systems and Technologies-volume II Telecommunication Network Reliability, 2007
[13]Wu J, Vangala S, Gao L, and Kwiat K 2004.An efficient architecture and algorithm for detecting worms with various scan techniques. In Proceedings of the 11th Annual Network and Distributed System
[14]Security Symposium (NDSS’04), February 2004.