http://dx.doi.org/10.4236/msa.2015.610086
How to cite this paper: Narita, C., Shimode, Y. and Yamada, K. (2015) Study on Characteristics of Gold Powder with Round Shape for Maki-e. Materials Sciences and Applications, 6, 841-849. http://dx.doi.org/10.4236/msa.2015.610086
Study on Characteristics of Gold Powder
with Round Shape for Maki-e
Chieko Narita
1, Yutaro Shimode
2, Kazushi Yamada
1*1Department of Advanced Fibro-Science, Kyoto Institute of Technology, Kyoto, Japan 2Faculty of Cultural Studies, Kyoto Sangyo University, Kyoto, Japan
Email: *[email protected]
Received 1 September 2015; accepted 27 September 2015; published 30 September 2015
Copyright © 2015 by authors and Scientific Research Publishing Inc.
This work is licensed under the Creative Commons Attribution International License (CC BY).
http://creativecommons.org/licenses/by/4.0/
Abstract
Maki-e is a traditional Japanese decorative technique that uses the natural lacquer Urushi and metal powders. Currently, there exist only two companies that manufacture metal powder for the purpose of Maki-e, and this research focuses on comparing the material characteristics of the gold powders with round shape manufactured by them. EDS (energy-dispersive X-ray spectroscopy) analysis, image analysis of particle shape before and after Maki-e processing, and color analysis of samples after Maki-e processing were carried out in this research. The study revealed that current gold powders with round shape had almost the same content ratio regardless of the manufactur-ing company and the powder diameter. In addition, spherical shape and irregular shape were ob-served in any gold powders, and the aggregates were obob-served in powder with increasing the powder diameter, while the shape of the aggregates differed with manufacturing companies. There-fore, it was indicated that the aggregates in the powder made by Asano Co., Ltd. had an influence on the particle diameter and its deviation after Maki-e processing. Moreover, the powder in Urushi resin has an influence on the Maki-e appearance because there is a color difference in polished powder, powder in Urushi resin, and Urushi resin.
Keywords
Urushi, Natural Lacquer, Maki-e, Gold Powder with Round Shape, Traditional Crafts
1. Introduction
used as the main material of Maki-e.
The materials used as Maki-e powder commonly are gold and silver powders, while Raden (mother-of-pearl) and eggshell are also used instead of metal powders. Additionally, there are several tens kinds of Maki-e powd-ers depending on materials, shapes, and size. Especially, the shapes of metal powdpowd-ers, such as gold and silver, are different depending on the period or craftspeople who have made them, because these powders have been made by craftspeople for a long time [15]. Therefore, it is important for the restoration of Maki-e lacquerwares to grasp the properties of both old and current metal powders. However, there are a few researches on the cur-rent metal powders though researches on the cultural properties which have been carried out [16] [17]. This point is the problem identification, so that basic research on metal powders for Maki-e is needed to preserve cultural properties in the future.
Currently, only two Japanese companies manufacture metal powders for Maki-e in the world. However, the material properties of both companies’ metal powders are not investigated enough. Therefore, gold powder with round shape, which is called “Kin-Maru-Fun” in Japanese, is used for this research, because it has been most commonly used for cultural properties as compared with other powders. EDS analysis, image analysis of particle shape before and after Maki-e processing, and color analysis of the samples after Maki-e processing were car-ried out in this study to compare and examine the material characteristics of both companies’ gold powders with round shape.
2. Experimental
2.1. Samples
Gold powders with round shape from No. 1 to No. 15 made by Asano Co., Ltd. (Series A) and Yoshii Co., Ltd. (Series Y), were used as samples. The number means the index of the particle size. The smallest powder is named No. 1, and the number increases with increasing the particle size.
Firstly, both companies’ gold powders from No. 1 to No. 15 before Maki-e processing were analyzed. After that, Maki-e samples were made with both companies’ No. 1, No. 8, and No. 15 as the representative value. Correspondence between powder number and sample names is shown in Table 1. The powder was sprinkled densely to the maximum. E-Urushi, which is mixture of Suke-Urushi (refined Urushi with high transparency) and red oxide, was used bond Maki-e powder to the sample board.
[image:2.595.89.540.649.724.2]Generally, the powders with smaller particle from No. 1 to No. 3, called “Migaki-fun”, are coated with Uwa-zuri Urushi, while larger particle more than No.4, called “Togi-fun”, are coated with Nashiji Urushi. Accor-dingly, the surface of the sample No.1 was coated with Uwazuri Urushi, and the sample No. 8 and No. 15 were coated with Nashiji Urushi. Both Uwazuri Urushi and Nashiji Urushi are refined Urushi with high transparency. The surface of the samples was polished and coated with the coating Urushi repeatedly until it became flat. Sample preparation is schematized in Figure 1.
Table 1. Correspondence table between powder number and sample name.
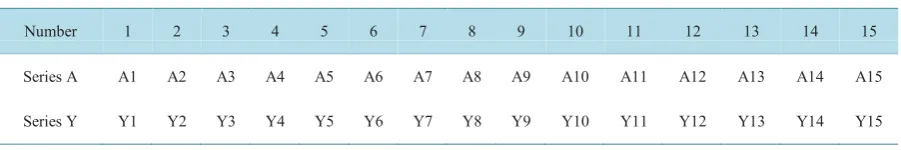
Number 1 2 3 4 5 6 7 8 9 10 11 12 13 14 15
Series A A1 A2 A3 A4 A5 A6 A7 A8 A9 A10 A11 A12 A13 A14 A15
Figure 1. Scheme of sample preparation.
2.2. Measurement Methods
EDS (Energy dispersive X-ray spectrometry) analysis and SEM (Scanning electron microscope) observation of the powders before Maki-e processing was performed using a system coupled with a scanning electron micro-scope (JSM-6010LA, JEOL Ltd.). Image processing and analysis were performed by using IGOR Pro (6.37 A, Wave Metrics, Inc.). Average circularity and diameter of each powder before Maki-e processing were calculated. Circularity (C) was calculated with following Equation (1).
2
= 4
C
π
A P (1) where, A is area of each particle and P is perimeter of each particle. The value of circularity is between 0 and 1, and if it approaches 1 for a perfect circle.A digital microscope (VHX-900, KEYENCE Japan, resolution; 1600 × 1200 px) was used for surface obser-vation of Maki-e samples at 500× magnification. Two obserobser-vation images were taken. One was including reflec-tion from the powder and the other was not including reflecreflec-tion because of the threshold change by white bal-ance processing. Average diameter after Maki-e processing was calculated and color analysis of the sample sur-face was also performed by using IGOR Pro.
3. Results and Discussions
3.1. EDS Analysis
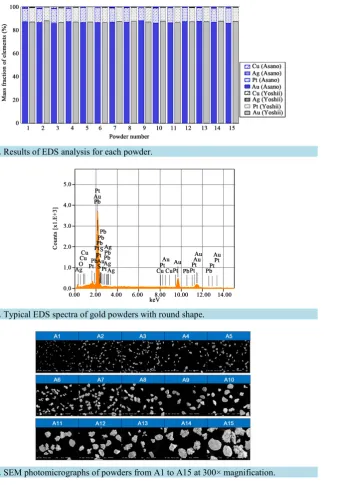
Firstly, EDS analysis was performed to identify elements in each powder. The results of EDS analysis for each powder are shown in Figure 2, and the typical EDS spectra for powder is shown in Figure 3. As the results, Au, Pt, Ag, and Cu were detected in all powders. Content ratio was approximately 90% Au, 10% Pt, and the other elements were only a few Ag and Cu, so that this content ratio was same as 22 K Gold. These results showed that the current gold powders with round shape have almost the same content ratio regardless of the company and powder number. The shape and size of each powder may have influence on properties if the content ratio is not different, so that the shape observation and measurement for each particle were performed.
3.2. SEM Observation
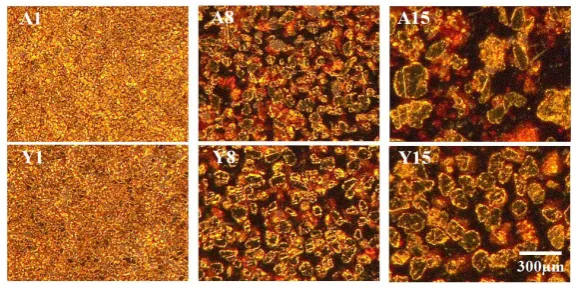
The SEM photomicrographs of powders from A1 to A15 are shown in Figure 4, and the SEM photomicro-graphs of powders from Y1 to Y15 are shown in Figure 5. The scheme of observed particle shape is shown in
Figure 6.
As shown in Figure 4 and Figure 5, spherical shape (Figure 6-①) and irregular shape (Figure 6-②) were
observed in any powder, while the aggregates (Figure 6-③) that was consisted of some small particles were
Figure 2. Results of EDS analysis for each powder.
[image:4.595.205.426.571.706.2]Figure 3. Typical EDS spectra of gold powders with round shape.
Figure 4. SEM photomicrographs of powders from A1 to A15 at 300× magnification.
Figure 6.Scheme of gold powder with round shape in Series A and Series Y.
in spherical shape and irregular shape in both companies’ powders, although the shape of the aggregates was quite different. The aggregates in Series A were consisted of larger particles than the aggregates in Series Y, while the aggregates in Series Y have rounder shape than the aggregates in Series A.
The average circularity of each powder is shown in Figure 7. The average circularity of Series Y was ap-proximately constant without depending on powder number, while the average circularity of Series A was dif-ferent with depending on the powder number. Moreover, the standard deviation was larger and the circularity decreased in the case of the powder from A13 to A15. Thus, it was indicated that the circularity of Series Y was totally higher than Series A.
The average diameter of each powder is shown in Figure 8. The average diameter of both Series A and Y in-creased with increasing of powder number. The average diameter of both Series A and Y from No. 1 to No. 10 showed approximately same values. In the case of more than No. 11, however, Series A was larger than Series Y. Besides, the standard deviation more than No. 10 in Series A was larger in particular.
It is considered that the reason why the circularity decreased from No. 13 to No. 15 in Series A was there were some aggregates with irregular shape as shown in Figure 6. Moreover, the average diameter more than No. 10 in Series A with larger standard deviation may be influenced by small particles which came from the aggre-gates. On the other hand, there were not small particles like Series A in Series Y. Furthermore, the aggregates in Series Y had comparatively spherical shape, so that it is considered that the circularity did not decrease.
3.3. Digital Microscope Observation
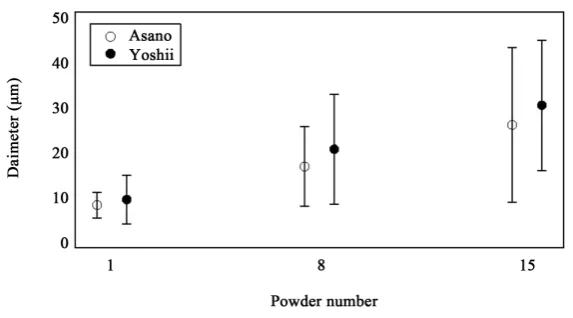
The photomicrographs of No. 1, No. 8, and No. 15 after Maki-e processing are shown in Figure 9 and Figure 10. Figure 9includes the reflection from the gold powder, and Figure 10 doesn’t include the reflection from the gold powder.
Surface of polished powder and powder in Urushi resin were observed in the sample surface as shown in
Figure 9 and Figure 10. Moreover, the Urushi resin part where powder was not included was also observed in
Figure 9. The particle size after Maki-e processing also became larger seemingly with increasing of the powder number. Difference in No. 1 and No. 8 after Maki-e processing was not observed, however, small powder and large powder were observed in A15 remarkably compared with Y15.
As analysis procedures, the average diameter after Maki-e processing was calculated firstly by using Figure 10 to compare the particle diameter before and after Maki-e processing. Analysis object for the particle diameter was only polished powder but powder in Urushi resin. The average diameter after Maki-e processing is shown in
Figure 11.
Of all No. 1, No. 8, and No. 15, the average diameter after Maki-e processing of Series Y was larger than Se-ries A. Regarding the standard deviation, only A15 was larger than Y15. Thus, only A15 was different from the results before Maki-e processing shown in Figure 8 as for polished powder. This reason is considered that the existence of the aggregates have an influence on the A15 result.
Figure 7.Average circularity of each gold powder with round shape before Ma-ki-e processing.
Figure 8.Average diameter of each gold powder with round shape before Ma-ki-e processing.
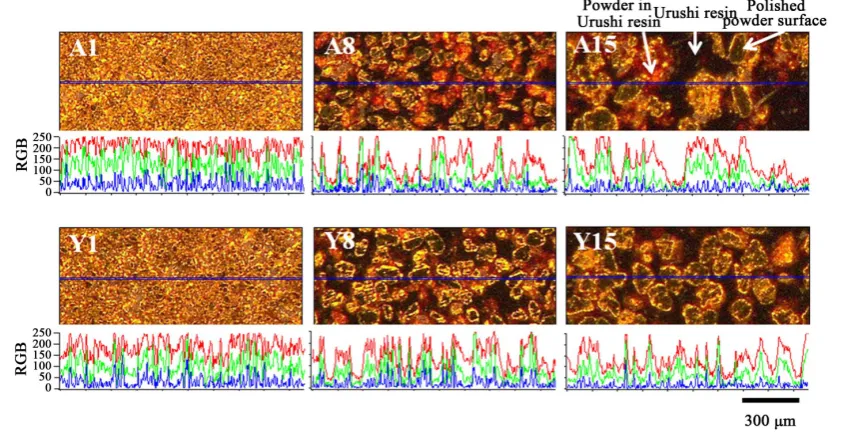
Figure 9. CCD photomicrographs of No. 1, No. 8, and No. 15 after Maki-e processing including the reflection from the gold powder; A1, A8, and A15 are shown in upper column, and Y1, Y8, and Y15 are shown in lower column.
[image:6.595.169.457.492.636.2]Figure 10. CCD photomicrographs of No. 1, No. 8, and No. 15 after Maki-e processing excluding the reflection from the gold powder; A1, A8, and A15 are shown in upper column, and Y1, Y8, and Y15 are shown in lower column.
Figure 11. Average diameter after Maki-e processing of No. 1, No. 8, and No. 15.
Secondly, the color analysis was performed to the photomicrographs of Figure 9. The results of the color analysis are shown in Figure 12. The blue lines in Figure 12 are analytical range, and each result is shown un-der the photomicrographs. Moreover, the part of powun-der in Urushi resin, Urushi resin, and polished powun-der are shown in Figure 12.
Any part of Urushi resin showed low value as shown in Figure 12. The central part of polished powders showed higher R and G values than the part of Urushi resin. Besides, the peripheral part of polished powders showed higher RGB values than the central part. This may be caused by light scattering. There were two color types of powder in Urushi resin, one was only R value was high and the other was both R and G values were high. This difference is considered that it depends on the difference in depth of powder in Urushi resin.
On the other hand, the average diameter of the A15 was influenced by the condition of polished aggregate, however, not only polished powder has an influence on the appearance after Maki-e processing because it was shown that powder in Urushi resin have a different color information with Urushi resin from the results of color analysis. However, the difference of RGB values in polished powder, powder in Urushi resin, and Urushi resin was not detected clearly in the case of No. 1 compared with No. 8 and No. 15, because the particle of No. 1 was small and the sample No. 1 was filled up closely with those particles as shown in Figure 12.
[image:7.595.171.458.273.432.2]Figure 12.Results of color analysis for No. 1, No. 8, and No. 15; A1, A8, and A15 are shown in upper column, and Y1, Y8, and Y15 are shown in lower column.
4. Conclusion
This study clarified that current gold powders with round shape had almost the same content ratio regardless of the manufacturing company and powder number. In addition, spherical shape and irregular shape were observed in powders with any powder number, and the aggregates were observed in powder with increasing powder number; however, the shape of the aggregates in Series A and Series Y was different. The aggregates in Series A consisted of some larger particles compared with the aggregates in Series Y. Therefore, it was indicated that the aggregates in Series A had an influence on the particle diameter and its deviation after Maki-e processing. Moreover, the results of color analysis for the sample surface after Maki-e processing indicated that powder in Urushi resin had an influence on the Maki-e appearance because there was a color difference in polished powder, powder in Urushi resin, and Urushi resin.
Acknowledgements
The authors wish to thank sincerely Prof. H. Hamada of the Kyoto Institute of Technology for his contribution to this research. The authors express their gratitude to the members of Shimode Maki-e studio for their kind supply of samples for this study.
This research was financially supported by the Sasakawa Scientific Research Grant from The Japan Science Society (Grant Number 26-142).
References
[1] Kopplin, M., Ed. (2002) Lacquerware in Asia, Today and Yesterday. United Nations Educational, 19-76.
[2] Coueignoux, C. and Rivers, S. (2015) Conservation of Photodegraded Asian Lacquer Surfaces: Four Case Studies.
Journal of the American Institute for Conservation, 54, 14-28. http://dx.doi.org/10.1179/1945233014Y.0000000032
[3] Tamburini, D., Bonaduce, I. and Colombini, M.P. (2015) Characterization and Identification of Urushi Using in Situ
Pyrolysis/Silylation-Gas Chromatography-Mass Spectrometry. Journal of Analytical and Applied Pyrolysis, 111, 33- 40. http://dx.doi.org/10.1016/j.jaap.2014.12.018
[4] Colomban, P. and Mancini, D. (2013) Lacquerware Pigment Identification with Fixed and Mobile Raman Microspec-trometers: A Potential Technique to Differentiate Original/Fake Artworks. Arts, 2, 111-123.
http://dx.doi.org/10.3390/arts2030111
http://dx.doi.org/10.1179/sic.2007.52.Supplement-1.29
[6] Lu, R., Honda, T., Kamiya, Y., Yoshida, K. and Miyakoshi, T. (2013) Analysis of Japanese Jōmon Lacquer-Ware by Pyrolysis-Gas Chromatography/Mass Spectrometry. Journal of Analytical and Applied Pyrolysis, 103, 68-72.
http://dx.doi.org/10.1016/j.jaap.2012.09.017
[7] Santo, R. (2014) Legacy of Milka Trnina in the Collection of Non-European Cultures of the Ethnographic Museum.
Etnološka istraživanja, 18/19, 245-262.
[8] Victoria and Albert Museum (2015) Lacquer at the V&A.
http://www.vam.ac.uk/content/articles/l/lacquer-at-the-v-and-a/
[9] Kato, H. (1999) Japanese Urushi Ware Abroad. Science for Conservation, 38, 60-67.
[10] Canepa, T. (2009) Namban Lacquer for the Portuguese and Spanish Missionaries. Bulletin of Portuguese-Japanese Studies, 18-19, 253-290.
[11] Franke, A. (1978) The Use of Beeswax and Resin in the Restoration of East Asian Lacquer Work. Studies in Conser-vation, 23, 45-47. http://dx.doi.org/10.1179/sic.1978.s012
[12] Webb, M. (1998) Methods and Materials for Filling Losses on Lacquer Objects. Journal of the American Institute for Conservation, 37, 117-133. http://dx.doi.org/10.2307/3179915
[13] Bincsik, M., Maezaki, S. and Hattori, K. (2012) Digital Archive Project to Catalogue Exported Japanese Decorative Arts. International Journal of Humanities and Arts Computing, 6, 42-56.
[14] Bratasz, L., Kozlowski, R., Kozlowska, A. and Rivers, S. (2008) Conservation of the Mazarin Chest: Structural Re-sponse of Japanese Lacquer to Variations in Relative Humidity. Conference Preprints of ICOM-CC 15th Triennial Meeting, II, 933-940.
[15] Gakkai, S., Ed. (2012) Shitsugeijiten. Kadokawa Co., Ltd., Tokyo.
[16] Nakasato, T. (1972) Study of Metal Particles Used in Ancient Lacquer Arts. Science for Conservation, 9, 63-98. [17] Narita, C., Shimode, Y. and Yamada, K. (2015) Study on Properties of Silver Powder for Maki-e. Materials Sciences