27
Comparative Study of Classification Techniques with
Labeled Data in Wireless Sensor Network
Bhawana Parbat
School of Studies in C.Sc. & I.T., Pt. Ravishankar Shukla University,
Raipur (C.G.), India – 492010
R. K. Dhuware
Department of Computer Science, Dhote Bandhu Science College,
Gondia (M.S.), India-441614
ABSTRACT
The wireless sensor nodes are getting smaller, but Wireless Sensor Networks (WSNs) are getting larger with the technological developments, currently containing thousands of nodes and possibly millions of nodes in the future. To deal with the large volume of data produced by these special kinds of wireless networks, one approach is use of Data Mining techniques. Classification is an important task in data mining. Classification of sensory data is a major research problem in WSNs and it can be widely used in reducing the data transmission in WSNs effectively and also in process monitoring. In this paper, Labelled Wireless Sensor Network Data is used for mining. This multihop data consist of humidity and temperature measurements. To mine the sensor data three classification techniques J48(Decision Tree), Naive Bayes, and ZeroR are considered in this study. Experimental investigation yields a significant output in terms of the correctly classified instances. At the end it has been found that Naïve Bayes is a suitable method to classify the large amount of data considered is made finally according to the mining result.
General Terms
Wireless Sensor Networks, Data Mining.
Keyword list
Wireless Sensor Networks, Classification, Decision Trees et. al.
1.
INTRODUCTION
The miniature autonomous devices with sensors embedded in them are known as sensor nodes. These sensor nodes are battery powered and equipped with a wireless radio transceiver, small CPU, actuators, memory, and one or more sensors that can measure temperature, light, humidity, pressure, sound, vibration, etc. WSNs have been successfully applied for national security and military applications [1, 2], data collection [3, 4], monitoring and surveillance [5, 6] and medical care [7, 8]. In WSN, sensor nodes are deployed in open and unsupervised environment where physical communication is not possible. It operated on an unattended mode area. WSN produces a large dataset. The capabilities for collecting and storing data have far outpaced someone’s abilities to analyze, summarize, and extract knowledge from these data. So, the transmission of all sensory data to the sink can be reduced by using data mining techniques. When each sensor node only selects important data, which is usually the fault data, to send to the fusion center, then energy consumption, network traffic can be reduced, and it can extend the lifetime of sensor networks. It happens in in-network scheme [9, 10]. In this paper, classes of the WSN database used have examined. And it also examines the role of different types of data mining techniques to
distinguish these classes automatically in order to reduce the non-important ones.
The remainder of this paper is organized as follows: In Section 2, the related works on sensor data is presented. In Section 3, Classification of WSN data is described in brief. In Section 4, the experimental investigation is reported and this study is concluded in Section 5
2.
RELATED WORK
Sensor data mining is emerging as a novel area of research and it offers wide application areas. The availability of sensors creates exciting new opportunities for data mining and data mining application.
Khushboo Sharma et. al., [11], used Nearest Neighbour Classification technique to classify the Wireless Sensor Network data. Their experimental investigation yielded a significant output in terms of the correctly classified success rate being 92.3%.
28 P.Garrity et. al., [14], presented a research that has been
conducted for deploying a WSN package at a runway for the general aviation to differentiate flight landing from vehicle movement. In this paper authors demonstrated the use of Wireless Sensor Network (WSN) to detect seismic/vibration activity integrated with real time alert software to classify the category of vehicle. In their work, WEKA J48 algorithm (equivalent to C4.5 algorithm [13].) for classification was used on the data collected by experiments to classify vehicle based on vibration. Authors used cluster algorithm to identify the range of vibrations.
3.
CLASSIFICATION OF WSN DATA
Classification is one of the primary tasks in data mining. It represents the task of learning a target function (classification model) that maps each attribute set to one of the predefined class labels [15]. By applying classification to the WSN data only required data will be sent to the sink. To solve above said problem, we have tested J48(Decision Tree), Naive Bayes and ZeroR classifiers have been tested in order to conclude which is more suitable to selected dataset.
4.
EXPERIMENTAL
AND
RESULTS
ANALYSIS
4.1 The Dataset
The experiments performed in this paper evaluate the datasets obtained from Labelled Wireless Sensor Network Data Repository (LWSNDR) [16]. For experimental purpose, datasets obtained from Multi-hop wireless sensor network deployment are used. The data consists of humidity and temperature measurements collected during 6 hour period at interval of 5 seconds. Label ‘0’ denotes normal data and label ‘1’ denotes an introduced event. Two datasets have been used one of mote id 3 and another of Mote id 1.
4.2 The Classification Results
Algorithms J48, Naïve Bayes and ZeroR have been chosen to implement classifications. It has been tried to obtain results by choosing a 30% split percentage, that means about 30% records were used as test data in the pre-implemented training process before classification. The three classifiers were evaluated on how well these clssifiers predicted the percentage of the data held out for testing. It has been tried to determine one of these three classifiers which classifier was suitable for chosen datasets. To determine this, it has been tried to show the performance of each five technique for both datasets in the terms of Summary of Accuracy and Classifier Error. Here also showing the confusion matrix for each of them. These terms are:
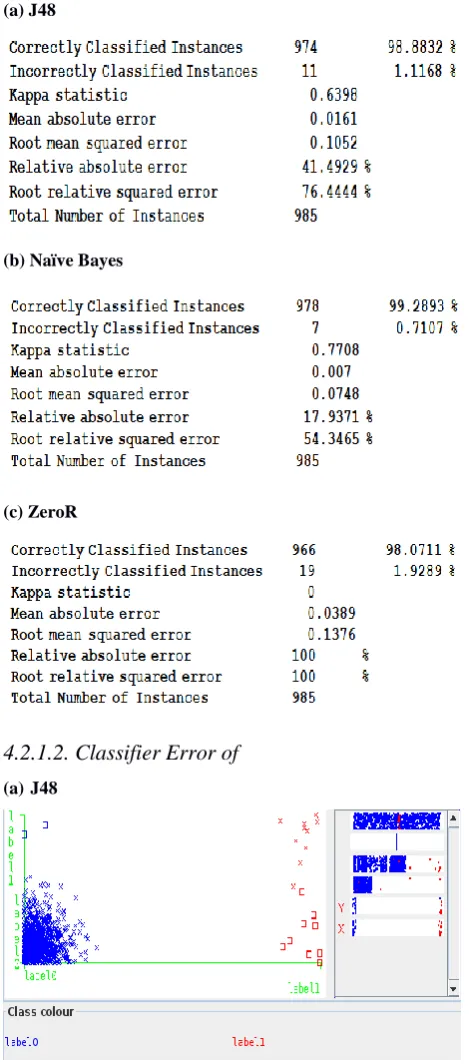
(a) Summary of accuracy: A list of statistics summarizing how accurately the classifier was able to predict the true class of the instances under the chosen test mode.
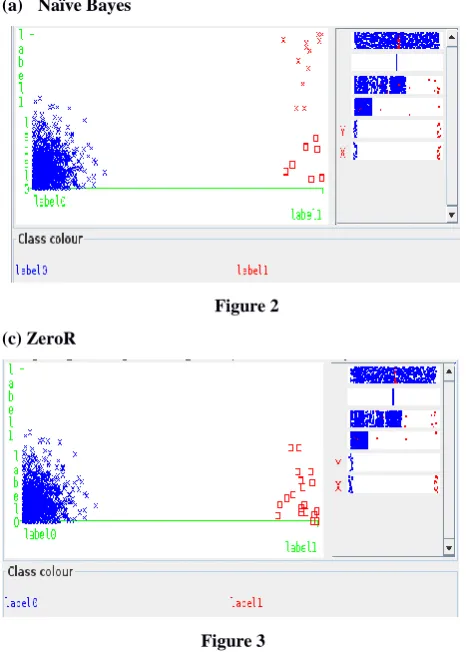
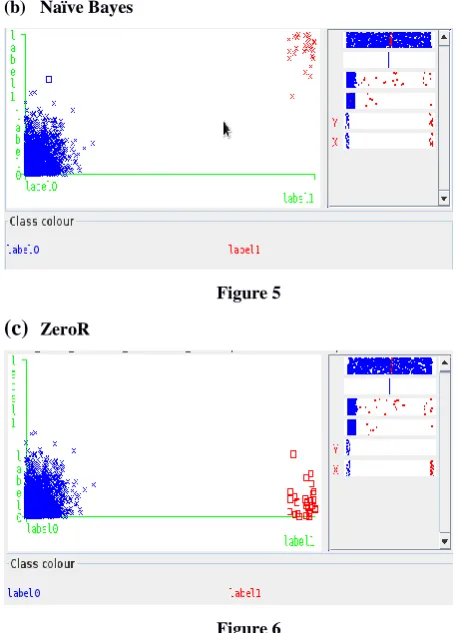
(b) Classifier Error: Brings up a visualization window that plots the result of classification. Here crosses represent correctly classified instances whereas incorrectly classified ones show up as squares. In this plot X and Y- axis denote class and predicted class respectively.
(c)
Confusion Matrix: Shows how many instances have been assigned to each class. The number of test examples are shown by elements whose actual class is the row and whose predicted class is the column.4.2.1 Result of Mote ID 1
4.2.1.1. Summary of Accuracy for
(a) J48
(b) Naïve Bayes
(c) ZeroR
4.2.1.2. Classifier Error of
[image:2.595.308.543.159.692.2](a)J48
29
[image:3.595.53.287.75.403.2](a) Naïve Bayes
Figure 2
(c) ZeroR
Figure 3
4.2.1.3. Confusion Matrix
The Confusion Matrices for the two classes of first dataset are shown as follows :
(a) For J48
(b) For Naïve Bayes
(c) For ZeroR
4.2.2 Result of Mote ID 3
4.2.2.1 Summary of Accuracy for
(a) J48
(b) Naïve Bayes
-(b) ZeroR
4.2.2.2
Classifier Error of
[image:3.595.310.545.101.622.2](a) J48
30
[image:4.595.52.281.74.391.2](b) Naïve Bayes
Figure 5
(c)
ZeroRFigure 6
4.2.2.3
Confusion Matrix
The Confusion Matrices for the two classes of second dataset are shown as follows:
(a) For J48
(b) For Naïve Bayes
(c) For ZeroR
5. CONCLUSIONS
[image:4.595.53.182.443.664.2]From the above classification results, tables of classification techniques for both datasets could be concluded as follows:
Table 1. The accuracy of the classification techniques
(First Dataset : of Mote ID 1) J48 Classifier
(%)
NB Classifier (%)
ZeroR Classifier (%)
98.88 99.29 98.07
Table 2. The accuracy of the classification techniques
(Second Dataset : of Mote ID 3)
J48 Classifier (%)
NB Classifier (%)
ZeroR Classifier (%)
99.93 99.93 98.08
From both the tables it has been concluded that J48 Tree classifier model have a higher level of classification accuracy than the ZeroR classifier models for the both datasets. The Naïve Bayes algorithm is more adequate to first data set and Naïve Bayes & J48 both are adequate for second dataset. So it has been concluded that Naïve Bayes is adequate for both datasets. The results attained by experiments show that the Naïve Bayes algorithm is more suitable to reduce the data transmission in WSN effectively and to implement classification simply. By classifying the large dataset at the sensor nodes level, normal values can be discarded and transmit only the anomaly values to the central server.
6.
ACKNOWLEDGMENTS
Authors gratefully acknowledge the immense contribution of the researchers whose work is thankfully cited in this paper. Their zest for scientific exploration and hard work in conducting various simulation studies had given a new insight to the community and paved way for many product developments.
7. REFERENCES
[1] T. Clouqueur, V. Phipatanasuphorn, P. Ramanathan, and K. K. Saluja 2002 Sensor deployment strategy for target detection. In Proceedings of the 1st ACM international workshop on Wireless sensor networks and applications, Atlanta, Georgia, USA, pp. 42–48.
[2] G. Simon et al., 2004. Sensor network-based counter sniper system. In Proceedings of the 2nd International conference on Embedded networked sensor systems, Baltimore, MD, USA, pp. 1– 12.
[3] P. Zhang, C. M. Sadler, S. A. Lyon, and M. Martonosi 2004 Hardware design experiences in ZebraNet,” in Proceedings of the 2nd international conference on Embedded networked sensor systems, Baltimore, MD, USA, pp. 227–238.
[4] G. Werner-Allen et al. 2006 Deploying a wireless sensor network on an active volcano, IEEE Internet Computing, vol. 10, no. 2 (Apr.2006), pp. 18- 25.
31 [6] Jiawei Han and MichelineKamber 2006 Data Mining
Concepts and Techniques. San Francisco, CA: Elsevier Inc,.
[7] Tia Gao, D. Greenspan, M. Welsh, R. Juang, and A. Alm, 2006 Vital Signs Monitoring and Patient Tracking Over a Wireless Network. In Engineering in Medicine and Biology Society,. IEEEEMBS 2005. 27th Annual International Conference of the, 2006, pp. 102-105. [8] K. Lorincz et al. 2004 Sensor networks for emergency
response: challenges and opportunities. IEEE Pervasive Computing, vol. 3, no. 4 (Dec. 2004), pp. 16- 23.
[9] M. Demirbas, X. Lu, and P. Singla, 2009 An In-Network Querying Framework for Wireless Sensor Networks. IEEE Transactions on Parallel and Distributed Systems, Vol. 20, No. 8 (August 2009).
[10] C. Zhang, C. Wang, D. Li, X. Zhou, C. Gad 2009 Unspecific Event Detection in Wireless Sensor Networks. International Conference on Communication Software and Networks, Shanghai, China (February 2009) pp.243-246. [11] Khushboo Sharma, Manisha Rajpoot, Lokesh Kumar
Sharma, “Nearest Neighbour Classification for Wireless Sensor Network Data”, International Journal of Computer Trends and Technology- volume2Issue2- 2011, pp. 41-43. [12] Y. Gao, E. Tumwesigye, L. Allan, B. Cahill, K. Menze
2010 Using Data Mining in Optimisation of Building Energy Consumption and Thermal Comfort Management.
In Proc.2nd International Conference on Software Engineering and Data Mining, IEEE,.
[13] Maria Muntean, HonoriuVălean, Adrian Tulbure, IoanIleană, Manuella Kadar, “Data mining algorithms for wireless sensor network’s data”, Advanced Topics in Optoelectronics, Microelectronics, and Nanotechnologies V, edited by Paul Schiopu, George Caruntu, Proc. of SPIE Vol. 7821, 78212G © 2010 SPIE · CCC code: 0277-786X/10/$18 · doi: 10.1117/12.882215, Proc. of SPIE Vol. 7821 78212G-1.
[14] P.Garrity, S. Bhattacharyya, C. Shen, D. Dawadi, B. Panja Vibration Monitoring And Analysis Using A Wireless Sensor Network (Wsn) To Classify Vehicle. http://patrickgarrity.com/files/VIBRATION_MONITORI NG_AND_ANALYSIS_USING_A_WSN_TO_CLASSI FY_VEHICLES_FINAL.pdf
[15] C. Nadal, R. Legault, and C. Y. Suen, 1990 Complementary algorithms for the recognition of totally uncontrained handwritten numerals. In Proceedings of the 10th International Conference on Pattern Recognition, volume A (June 1990) , pages 434–449.
[16] Shan Suthaharan, Mohammed Alzahrani, Sutharshan
Rajasegarar, Christopher Leckie and Marimuthu