Munich Personal RePEc Archive
The Outcome of Patent Applications
-Does Experience Matter?
Schneider, Cédric
CEBR, Copenhagen Business School
2007
Online at
https://mpra.ub.uni-muenchen.de/8625/
The outcome of patent applications - Does experience
matter?
Cédric Schneider
KU Leuven, Belgium
and Copenhagen Business School, Denmark
October 30, 2007
Abstract
The aim of this paper is to study the determinants of the outcome of patent applications (withdrawal, refusal or grant). The application process at the European Patent O¢ce (EPO) is modelled in three stages, using a Trivariate Probit model with double selectivity correction in order to test whether the applicant’s patenting history has an e¤ect on the outcome of the current application. I investigate the behavior of the applicant after the patent o¢ce has established the "state of the art", a precondition to an invention being patentable. The main results of the paper are that (i) Experienced applicants behave di¤erently than unexperienced ones. Firms having large patent portfolios follow a "trial and error" strategy by applying for large numbers of patents and stay the course only when the expected probability of grant is high, (ii) there is no evidence for declining quality of patent examination once observable characteristics related to the "quality", the value or the cost of applications are controlled for and (iii) the outcome of prior art search by the EPO is a critical driver of applicants’ behavior and of the propensity of the patent o¢ce to grant the patent or not.
Keywords: patents, intellectual property rights JEL: O31, O32, O34
1
Introduction
A surge in patenting took place in the early 1990s in the three main patent o¢ces, the U.S. Patent and Trademark O¢ce (USPTO), the European Patent O¢ce (EPO) and the Japanese Patent O¢ce (JPO). This increased volume of patent applications, documented in e.g. OECD (2004), raises doubts about patent o¢ces’ capacity to maintain high ex-amination standards. This issue is crucial, given the impact of patents on innovation and on …rms’ competitive strategy.
However, very little is known about the inner workings of patent o¢ces and even less about the behavior of patent applicants throughout the procedure. There are at least two reasons. First, before the 2000 reform in the US, only granted patents were disclosed at the USPTO whereas all patents that were withdrawn by the applicant or refused a grant by the patent o¢ce remained secret. The second reason is the di¢culty to access procedural data and speci…c patent-based information. In this paper I take advantage of a newly created dataset recently made available by the EPO and the OECD containing detailed information on the allocation of citations to all patents applied for at the EPO, that I merged with procedural data of patents applied for by Danish …rms at the EPO.
Recent research shows that the use of patents has changed dramatically in the past decade (see for example, Hall and Ziedonis, 2001, 2007 or Lerner, 2007), with …rms apply-ing for an increasapply-ing share of marginal inventions. There is also a good deal of anecdotal evidence suggesting that some applicants try to obtain patents of dubious merit1, and given the possible impact of these changes on the overall "quality" of patent examination, one can legitimately wonder what the consequences for applicants and patent o¢ces are. The aim of this paper is twofold. The …rst more general objective is to identify the main factor that determine the outcome of a patent application at the EPO. The second motivation is to conduct an exploratory investigation the behavior of patent applicants at the di¤erent stages of the application procedure in order to test whether experienced applicants behave di¤erently throughout the procedure.
Within the EPO procedure, the patent o¢ce establishes the state of the art by issuing a search report that contains a list of prior art. The applicants then have the possibility to withdraw their applications if they consider that the search report is negative, i.e. if it contains evidence that the claimed invention is not novel or does not involve an inventive step, or to maintain it if their expected probability of getting a grant is high. Substantial examination follows if the application is maintained until the patent o¢ce makes its …nal decision. The EPO procedure di¤ers from the USPTO and the JPO, in which the search and substantive examination are undertaken in one phase.
In this paper, the outcomes of the patent procedure are modeled by taking into account
the sequential aspect of the applicant’s and patent o¢ce’s decisions within an econometric framework using a Trivariate Probit Model with double selection. In addition, applicants heterogeneity and patent citation measures are taken into account by using a database linking patents, citations and …rms data, where earlier work only studied the e¤ect of patent-based variables.
The main results of the paper are that (i) Experienced applicants behave di¤erently than unexperienced ones. Firms having large patent portfolios follow a "trial and error" strategy by applying for large numbers of patents and stay the course only when the expected probability of grant is high, (ii) there is no evidence for declining quality of patent examination once observable characteristics related to the "quality", the value or the cost of applications are controlled for and (iii) the outcome of prior art search by the EPO is a critical driver of applicants’ behavior and of the propensity of the patent o¢ce to grant the patent or not.
Section 2 brie‡y summarizes the application process at the EPO. Section 3 presents the economic background; the data are introduced in Section 4, while Section 5 describes the variables used and Section 6 provides summary statistics. The empirical model and the results are presented in Section 7, which is followed by concluding remarks.
2
Application process, outcomes and cost of patenting
at the EPO
I …rst describe the application procedure at the EPO and then the associated costs.
2.1
The patent application process
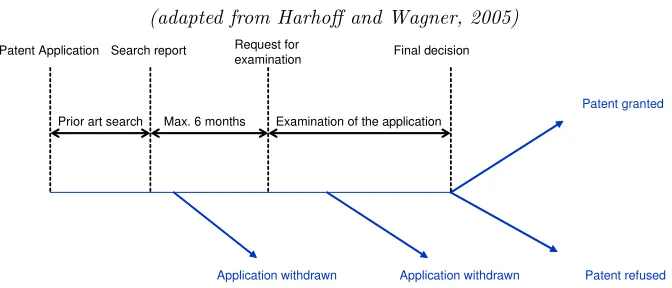
Figure 1: Examination of patent applications at the EPO (adapted from Harho¤ and Wagner, 2005)
Prior art search Examination of the application
Patent Application Final decision
Application withdrawn Patent refused Patent granted
Request for examination
Application withdrawn
Search report
Max. 6 months
Figure 1 provides a simple presentation of the application process at the EPO. The application is published 18 months after the European or national priority application was …led. A search report describing the state of the art is published either with the application or later on. It contains references to prior patents or scienti…c publications, classi…ed in di¤erent categories according to their relevance for the …nal decision. After the search report is published, applicants have six months to decide whether or not to pursue their application by requesting substantive examination. If no request for examination is …led within the six months, or the renewal fee or any other fee were not paid in due time the application is deemed to be withdrawn. The withdrawal of the application can also be explicit, under the form of written correspondence between the applicant and the patent o¢ce, at any time before or during the examination process. A withdrawal
typically takes place when the search report issued by the patent o¢ce contains evidence that the claimed invention is not novel, or does not involve an inventive step, in the sense that the applicant expects the patent not to be granted.
If examination was requested by the applicant, the application is examined by the patent o¢ce according to three criteria: novelty, inventive step and industrial applicabil-ity. The application then may end up with agrant or a refusal to grant. Yet, a request for examination does not necessarily lead to a …nalgrant/refusaldecision by the EPO, in the sense that the applicants still have the possibility to withdraw their application after having requested examination2. Under examination, applicants receive additional
infor-mation on the patentability of the invention and can then choose whether to withdraw the application, or to wait until the EPO’s …nal decision.
According to the EPC, if a European patent is granted, competence is transferred to the designated contracting states, where it a¤ords the same level of legal protection as a national patent and is valid for 20 years from the date of …ling, if it is consecutively renewed.
If the applicants seek patent protection in several countries, they have the possibility to …le an application under the Patent Cooperation Treaty (PCT, e¤ective since the early 1980s), to be …led at the World Intellectual Property Organization (WIPO). Since a large share of applications in this study are …led under the PCT, it is worth describing the procedure brie‡y. The PCT is an international agreement for …ling patent applications having e¤ect in all designated countries. Although the PCT system does not provide for the grant of an international patent, it does simplify the process of …ling patent applications. Under the PCT, an inventor can …le a single international patent application in one language, with one patent o¢ce in order to simultaneously seek protection for an invention in up to 183 countries. Such a procedure gives the applicant more time to decide whether or not to apply for the patent and in which of the 183 PCT member countries. Our database contains PCT applications in which the applicants have designated the EPO, so called "Euro-PCT" applications.
Chapter I of the PCT procedure consists of sending the application to an International Searching Authority (ISA), which is a national or regional patent agency, for carrying out the search on the state of the art. The EPO is responsible for more than half of the searches. Once the report is provided by the ISA, the applicant has three possibilities (1) transfer the application to national or regional patent o¢ces among those designated in his application, (2) elect an International Preliminary Examination, or (3) withdraw the application.
Chapter II of the PCT procedure comes into play once the international preliminary examination is chosen by the applicants. If the Euro-PCT application is transferred to the EPO, the outcome of the preliminary search report is taken into account.
As indicated by Harho¤ and Wagner (2005), a PCT …ling can be advantageous for the following reasons: (1) it allows the expansion of patent protection to a large number of countries without incurring the full costs and complexity of national application paths, (2) the applicant receives an international search report within a relatively short time period, informing them about prior art that may be relevant for the own application’s likelihood of being granted and (3) it allows the applicant to delay decisions about the number of designated countries up to 30 months after the priority date, which is helpful if the value of the invention is uncertain for the applicant.
2.2
The cost of patent applications
cost of a patent application at the EPO. However, given the variety of situations an ap-plicant can face and the complexity of the procedure, this cost can hardly be summarized with a single …gure. In this subsection, I give a brief overview of the fees an applicant will have to pay at the di¤erent stages of the application procedure.
The nature of the fees and costs can be divided into three categories:
Pre-…ling costs comprise all the elements related to the drafting of the …rst ap-plication.
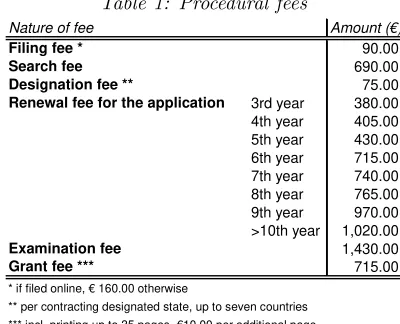
[image:8.612.204.404.320.482.2]Procedural fees have to be paid once the application has been …led at the EPO. These costs are summarized in Table 1 and do not include the administrative costs an applicant can be asked to pay.
Table 1: Procedural fees
Nature of fee Amount (€)
Filing fee * 90.00
Search fee 690.00
Designation fee ** 75.00
Renewal fee for the application 3rd year 380.00 4th year 405.00 5th year 430.00 6th year 715.00 7th year 740.00 8th year 765.00 9th year 970.00 >10th year 1,020.00
Examination fee 1,430.00
Grant fee *** 715.00
* if filed online, € 160.00 otherwise
** per contracting designated state, up to seven countries *** incl. printing up to 35 pages, €10.00 per additional page source: "Schedule of fees and costs", supplement to official Journal OJ EPO 2/2005
Notice that this schedule only applies to "Euro-direct" applications. If the application has been applied through the PCT route, additional fees have to be paid. For example, the fee for the preliminary examination of an international application is e1;530. The same applies if the patent was applied for at a national patent o¢ce prior to the EPO application. The applicant also has the possibility to hire a patent attorney or a legal representative for guidance throughout the procedure which leads to additional expenses.
enforced and maintained in each jurisdiction by paying the renewal fees in each of them.3
Van Pottelsberghe and François (2006) estimate that the procedural and transla-tion cost of the "average" patent that designates three countries (the UK, Germany and France) is e 8;070. The same patent that designates 13 countries will cost about e
20;175. These …gures can be compared to the cost of application (excluding renewal fees) at the USPTO (e1;856) and at the JPO (e1;541).
It is di¢cult to quantify the cost of application at the EPO with accuracy. Thus, in the analysis, I will use indirect measures such as the number of designated states, PCT applications, number of claims or if a patent attorney acted as a legal representative.
3
Background
3.1
Literature background
As mentioned in the introduction, literature on the inner workings of patent o¢ces is scarce. Van Dijk and Duysters (1998) …nd that, not surprisingly, basic research, which explores more novel and unknown paths, meets the patentability requirement more often, whereas Guellec and Van Pottelsberghe (2000, 2002) show that some patent speci…c characteristics like for example application ways can partly explain the probability to get a grant. Harho¤ and Wagner (2005), Popp et al. (2004) as well as Régibeau and Rockett (2007) study the duration of patent examination, in order to test whether "important" patent are processed faster by the patent o¢ce and …nd contradictory results. Cockburn et al. (2002) study the relationship between patent examiners characteristics and litigation outcomes. One of their main …nding is that there is no e¤ect of examiners experience or workload on the probability that the patent will be found invalid in lawsuit.
The usual way to model patenting behavior in economic theory is to consider two or more …rms "racing" for an invention. The winner of the race will then patent the invention, that is assumed to be granted with probability one. However, the outcome of a patent application is essentially the result of a strategic interaction between the patent o¢ce and the applicant. Literature on the strategic interaction between applicants and patent o¢ces in the theoretical literature is meager too. For example, Langinier and Marcoul (2007) study such a model allowing the applicant not to reveal all prior art in order to increase the probability to be granted a patent, whereas Caillaud and Duchêne
3These renewal fees have to be paid separately in each designated state after a grant by the EPO in
(2006) assume that the overload problem of the patent o¢ce leads examiners to make erroneous judgment, issuing patent on low quality inventions. Régibeau and Rockett (2007) assume that the applicant maximizes its private pro…t, while the patent o¢ce maximizes a social welfare function. In their model, the decision made by the patent o¢ce is imperfect, in the sense that there is a probability of erroneous judgement, i.e., that the patent o¢ce confers patent protection to a invention that is not novel or that the patent o¢ce rejects an application that meets the patentability requirements. The probability of error is a decreasing function of time, as longer examination periods enable more thorough reviews, lowering the probability of error that will enter the …rm’s pro…t function.
To explain early or late withdrawals, one could think that the distance between the actual quality of the invention and the quality standard set by the patent o¢ce enters the erroneous judgement function. The higher this distance is, the easier it is for the patent o¢ce to demonstrate lack of novelty or inventive step. The actual quality of the application is however observed with some noise by the patent o¢ce, which might be in‡uenced by its capability to perform e¢cient searches and examinations or by the desire of the applicant to hide the true potential of the application. In some cases, unexperienced applicants might even be unaware of the quality of their own inventions, compared to the quality standard of the patent o¢ce.
In that event, applicants might withdraw their applications because the search report demonstrates that con‡icting prior art exists. These early withdrawals take place when the quality of the invention is low compared to the patent o¢ce’s standard.
If the lack of novelty is more di¢cult to demonstrate, possibly because the appli-cant tries to hide the true quality of the application, substantial examination will be requested, where the …rm gets additional information on the patentability of the inven-tion and updates the expected probability of grant. In this scenario, the applicainven-tion will be maintained as long as the probability of erroneous judgment enables positive private pro…ts.
3.2
Uncovering the process through which experience in
patent-ing a¤ects the current outcome
Does this type of reasoning also apply to patenting activity? Are experienced ap-plicants more successful with their current applications? Given the complexity of the patenting procedure and the cost of a patent application one could hypothesize that ex-perienced applicants can bene…t from prior patent applications. As any new economic activity, applying for a patent can be "learned" and implies speci…c costs. A common explanation for the e¤ect of experience on any type of economic activity is the presence of sunk costs. Theory predicts that in the presence of sunk investments, current per-formance is a¤ected by prior experience (Dixit, 1989). If a …rm decides to start some patenting activity, it has to incur costs that cannot be recovered, by, for example setting up an IP department, or by training and hiring IPR personnel (lawyers, representatives, etc). Thus, these sunk costs will represent risky investments for unexperienced …rms since success is uncertain.
Other explanations of the e¤ect of past applications, might be that applicants have learned how to draft the documents well, if only due to a greater familiarity with the application procedure which increases the chances of future success, or that they have created informal networks at the patent o¢ce and are receiving a favorable treatment due to these social ties to the patent o¢ce. Finally, experienced applicants might be more successful because they know the relevant prior art in the area they are active in.
4
Data sources
The data was compiled from four main sources:
1. TheCEBR patent database contains all the patents applied for by at least one Danish …rm at the EPO since the creation of the EPO in 1978 and up to 2003. The initial database contains 12,109 patent applications. A major advantage of this database is that a unique …rm identi…er has been attached to the patent assignees, the so-called “CVR” number (central …rm registry number) to …nd exact matches between the …rm names and addresses in the patent data and the …rm name and addresses in the …nancial data (the KOB data, see below).
2. TheEPO/OECD citations databasecontains information on citations made in the patent applications, as well as information on the citations received by all EPO patents applied before October 2004. More information on the citation database can be found in Webb et al. (2005)
3. TheKOB data provides us with …rm level data. KOB A/S is a private …rm that has specialized in collecting and processing data on Danish businesses. Our dataset is an image of the data that can be found on http://www.kob.dk/. This dataset is described in detail in Bennedsen et al. (2006)
4. Finally, thenumber of claimshas been searched manually for each patent appli-cation via http://ep.espacenet.com/
In order to include the number of forward citations (the number of citations received from subsequent patents) within …ve years after the patent application and allow for ample examination time, I restrict the dataset to patents that were applied for before January 1st 1998.
5
Variables
The dependent variables and explanatory variables are described in turn.
5.1
Dependent variables
All dependent variables are binary. The purpose is to explain both the decision to with-draw an application, after search report and during examination, or to maintain it, and the subsequent decision made by the patent o¢ce to grant the patent or not. The appli-cation procedure outlined in Section 2 shows that withdrawals can take place before or during the substantial examination phase. These decisions might be driven by di¤erent factors, thus they are going to be analyzed in di¤erent equations.
My empirical model considers three dependent variables of which the …nal decision by the EPO is observed if the application has not been withdrawn during examination, which in turn is conditional upon a request for examination after the search report has been received by the applicant.
Request for Examination/withdrawal after search report. This variables takes the value 1 if the applicants have requested for examination and 0 if the application was withdrawn before examination.
withdraw it. The variable takes the value1 if the application is maintained and0if it is withdrawn during examination.
Decision of the EPO. If the applicant indeed decided to maintain the application, we observe the decision by the EPO to grant (= 1) or to refuse (= 0) the patent.
5.2
Explanatory variables
This section introduces the explanatory variables used in the multivariate analysis, as well as the expected e¤ects of experience and control variables on the outcome of patent applications.
5.2.1 Experience variable
The purpose of this paper is to evaluate the e¤ect of patenting history on the outcome of current applications. In particular, I would like to test …rst whether applicants with a bigger patent applications portfolio have a higher probability to be successful. Second, I want to assess whether experienced applicants have di¤erent strategies than unexperi-enced ones throughout the procedure. Thus, the main explanatory variable will be:
Stock of patent applications. The e¤ect of this (lagged) stock variable with declin-ing balance depreciation will be tested. The variable is constructed usdeclin-ing the perpetual inventory method and is de…ned as:
Ait= (1 )Ait 1+Nit (1)
WhereAitis the stock of applications of …rmiat timet,Nitis the number of patents
applied for by …rm i at time t and is the depreciation rate of the patent stock from year t 1to yeart. As noted by Czarnitzki et al. (2005), the use of a depreciation rate is justi…ed by the fact that knowledge tends to decay or become obsolescent over time, losing economic value due to advances in technology. We will make the usual assumption that = 15%, see for example Hall (1990). In case of multiple applicants, the sum of the stocks of the collaborating …rms is taken.
A similar variable has been used in Lanjouw and Schankerman (2004) in an empirical model of patent litigation in the US. The authors use the portfolio of granted patents, while in this paper I use the stock of all patent applications made by a given …rm, since the hypothesis is that something can be learned even from unsuccessful prior applications.
5.2.2 Control variables
quality should have better chances to be granted and if not, should be abandoned less quickly by the applicant as shown by Harho¤ and Wagner (2005). I only include "time-zero" value correlates in the analysis in order to avoid endogeneity problems. "Time-"time-zero" variables re‡ect either the perception of the value of the invention that the applicant has or the assessment of the "quality" of the invention that the patent o¢ce makes at the time of the application. These variables are:
Number of citations made (backward citations). The search report issued by the EPO lists all the documents regarding prior art that are relevant for the examiner’s decision on patentability. Harho¤ et al. (2005) describe in detail how to use citations as-signed to EPO patents. Empirical evidence tend to con…rm a positive impact of backward citations on the "quality" or the private value of a patent (Gambardella et al, 2006).
For our purpose, an interesting feature of the search report made by the EPO is that the patent references are classi…ed in di¤erent categories by the examiner according to their relevance. Thus, in addition to the total number of backward patent citations, I will use:
The number of "type X" citations. References classi…ed in this category indicate that the claimed invention cannot be considered to be novel or cannot be considered to involve an inventive step when the referenced document is taken alone.
The number of "type Y" citations, indicating that the claimed invention cannot be considered to involve an inventive step when the referenced document is combined with one or more other documents of the same category, such a combination being obvious to a person skilled in the art.
The number of "type D" citations, referring to patent references already mentioned in the description of the patent application and approved by the examiner. Harho¤ et al. (2006) report that only7:5%of all citations are classi…ed in this category.
It is obvious that a high number of type X and type Y citations re‡ects a negative search report, since they imply that the invention is not novel or less "radical", which is expected to lead the applicant to withdraw the application or the patent o¢ce to refuse the grant.
Type D citations are references already mentioned by the applicant when the appli-cation was submitted. This type of citations could re‡ect the fact that the applicant has a good command of prior art. The probability to maintain the application up to the …nal decision is expected to increase with the number of type D citations.
to its applicability for di¤erent technology areas. Lerner (1994) interprets the number of (IPC) assignments of a patent as the "scope" of this patent, whereas other authors prefer to take it as a measure of the complexity of the invention (Harho¤ and Wagner, 2005).
Number of claims. In the same way as the number of IPC assignments, the number of claims, which delimit the boundaries of a patent by describing precise features of the invention, can be interpreted as the "scope" or "breadth" of a patent as well as an indicator of complexity, see Harho¤ and Reitzig (2004) or Lanjouw and Schankerman (2004).
Both these variables can thus be interpreted in contradictory ways, as each additional claim and/or IPC assignments could either mirror a broad patent by increasing its scope or breadth, or make the description of the invention more precise, narrow and speci…c, thus reducing the scope of the patent. However, theses two variables have been found to be "time-zero" value indicators.
Number of designated states. The "Family size" is the number of jurisdictions in which patent protection is sought for. We do not, however, observe the entire patent family, thus I use the number of designated states member of the European Patent Con-vention (EPC)4. Harho¤ et al. (2003) and Lanjouw et al. (1998) show that family size is
a patent value correlate.
The total number of designated states has been found to be a "time-zero" value correlate (like the number of IPC assignments and the number of claims, see above). This is very intuitive, since applicants have to pay an additional fee for each jurisdiction in which protection is sought for, thereby increasing the geographical scope of protection.
PCT application. A dummy variable indicates whether PCT Chapter I or II appli-cations have been …led for the invention.
Guellec and Van Pottelsberghe (2002) give arguments for and against a positive role of PCT applications. The PCT procedure provides the applicants with a longer period to decide whether to apply for a patent or not, which enables them to assess the market potential of their invention more thoroughly. The decision to transfer the applications to the EPO might therefore be an indicator of higher quality. On the other hand, the PCT procedure might be a sign of inventions with unclear market potential. In their analysis, Guellec and Van Pottelsberghe (2000, 2002) …nd that applications that went
4The EPO members are Belgium, Federal Republic of Germany, France, Luxemburg, the Netherlands,
trough the …rst part of the PCT application procedure only (PCT I for short) have a lower grant rate, which they interpret as an unclear market potential. They argue that applicants only want to bene…t from the longer delay to decide in which jurisdictions to apply, whereas applicants going through the whole PCT procedure (PCT II) are more aware of the value of their inventions.
Legal Representative. Any applicant at the EPO may be represented by a profes-sional representative on the list maintained to this purpose by the EPO (Art. 134(1) of the EPC), a legal practitioner (Art. 134(7) EPC)5, or an employee (Art. 133(3) EPC),
typically from the IP department. The employee(s) must work for the applicant and not for an economically connected company.
I introduce a dummy variable indicating wether the applicant had any legal representa-tion. Although the e¤ect of legal representation has not been investigated in the economic literature, it is expected to have a positive in‡uence on the probability to maintain an application, as legal representatives are familiar with the procedure.
Ownership structure. I introduce dummy variables which indicate the legal form of each …rm involved in the application, in order to control for this type of …rm speci…c heterogeneity. These dummies can, to some extent, also be interpreted as a proxy for …rm size, but there are strong within di¤erences.
Large …rms, in our case stock listed …rms, are expected to have a higher propensity to pursue their applications, since such …rms have more resources and typically have an IP department.
6
Descriptive statistics
6.1
Outcomes of the patent applications
The number of Danish patent applications has been steadily increasing since 1978, fol-lowing a trend at the EPO level, see Kaiser et al. (2005). A major challenge related to this unprecedented increase in patent applications and increasing workload is to maintain high quality in patent examination.
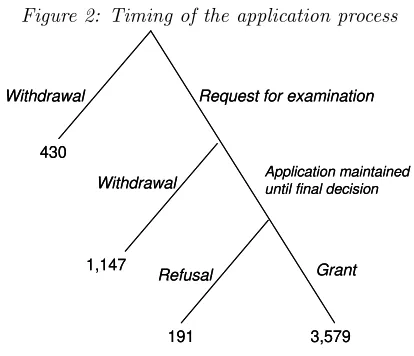
Figure 2 presents the timing of the application process with the number of occurrences at the di¤erent stages. A patent grant is the most frequent outcome, followed by with-drawals during examination. Relatively few applications are directly refused a grant by the EPO.
5A legal practioner may act as representative if he/she full…ls the following criteria:
1. is quali…ed in one of the Contracting States, 2. has his place of business within such State, and
Figure 2: Timing of the application process
Withdrawal
430
Request for examination
Withdrawal
1,147
Refusal
191
Application maintained until final decision
Grant
3,579
Withdrawal
430
Request for examination
Withdrawal
1,147
Refusal
191
Application maintained until final decision
Grant
3,579
[image:17.612.156.458.467.634.2]Figure 3 displays the distribution of the outcomes of the patent examinations by ap-plication years from the beginning of 1978 to the end of 1997. A majority of patent applications, 66%, is granted in the time window covering the application years of this study, from 1978 to 1997, while a relatively high number of applications,29%, are with-drawn by the applicants. As pointed out by Harho¤ and Wagner (2005), the withdrawal of a patent application generally occurs after the applicant received a "su¢ciently negative search report or skeptical communication from the examiner". In addition, about3:6%of all applications end up with a refusal. The316 pending applications (for which the out-come is not known yet) are discarded from the analysis. The sample under consideration contains5;347observations.
Figure 3: Distribution of outcomes
0% 20% 40% 60% 80% 100%
1978 1980 1982 1984 1986 1988 1990 1992 1994 1996 Application year
REFUSED WITHDRAWN GRANTED
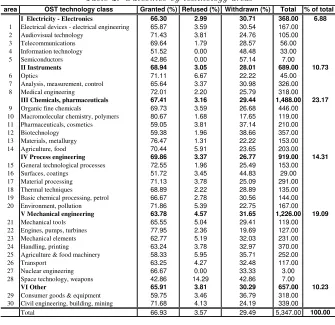
et Techniques”, the French Patent O¢ce (INPI) and the Fraunhofer ISI Institute, which is based on a concordance with IPC classes. The table shows an uneven distribution of outcomes across technology classes. When considering the six aggregated technology classes, one can see that the grant rate varies from 63:8% in "mechanical engineering" (technology class V) to69:9%in "Processing Engineering" (technology class IV). In the 30 more narrow areas, the di¤erences are even stronger, but the low number of applications in some of the areas makes it di¢cult to compare them. Notice, however, the relatively high grant rate,69:7%, in "organic …ne chemicals" (area 9), which is the area where the Danish patent applicants are most active in (446 applications) and in "Macromolecular chemistry, polymers" (area 10) in which the grant rate is80:7%with 119 applications.
Table 2: Outcomes by technology areas
area OST technology class Granted (%) Refused (%) Withdrawn (%) Total % of total I Electricity - Electronics 66.30 2.99 30.71 368.00 6.88
1 Electrical devices - electrical engineering 65.87 3.59 30.54 167.00
2 Audiovisual technology 71.43 3.81 24.76 105.00
3 Telecommunications 69.64 1.79 28.57 56.00
4 Information technology 51.52 0.00 48.48 33.00
5 Semiconductors 42.86 0.00 57.14 7.00
II Instruments 68.94 3.05 28.01 689.00 10.73
6 Optics 71.11 6.67 22.22 45.00
7 Analysis, measurement, control 65.64 3.37 30.98 326.00
8 Medical engineering 72.01 2.20 25.79 318.00 III Chemicals, pharmaceuticals 67.41 3.16 29.44 1,488.00 23.17
9 Organic fine chemicals 69.73 3.59 26.68 446.00
10 Macromolecular chemistry, polymers 80.67 1.68 17.65 119.00
11 Pharmaceuticals, cosmetics 59.05 3.81 37.14 210.00
12 Biotechnology 59.38 1.96 38.66 357.00
13 Materials, metallurgy 76.47 1.31 22.22 153.00
14 Agriculture, food 70.44 5.91 23.65 203.00 IV Process engineering 69.86 3.37 26.77 919.00 14.31
15 General technological processes 72.55 1.96 25.49 153.00
16 Surfaces, coatings 51.72 3.45 44.83 29.00
17 Material processing 71.13 3.78 25.09 291.00
18 Thermal techniques 68.89 2.22 28.89 135.00
19 Basic chemical processing, petrol 66.67 2.78 30.56 144.00
20 Environment, pollution 71.86 5.39 22.75 167.00 V Mechanical engineering 63.78 4.57 31.65 1,226.00 19.09
21 Mechanical tools 65.55 5.04 29.41 119.00
22 Engines, pumps, turbines 77.95 2.36 19.69 127.00
23 Mechanical elements 62.77 5.19 32.03 231.00
24 Handling, printing 63.24 3.78 32.97 370.00
25 Agriculture & food machinery 58.33 5.95 35.71 252.00
26 Transport 63.25 4.27 32.48 117.00
27 Nuclear engineering 66.67 0.00 33.33 3.00
28 Space technology, weapons 42.86 14.29 42.86 7.00
VI Other 65.91 3.81 30.29 657.00 10.23
29 Consumer goods & equipment 59.75 3.46 36.79 318.00
30 Civil engineering, building, mining 71.68 4.13 24.19 339.00
Total 66.93 3.57 29.49 5,347.00 100.00
6.2
Firm-level data
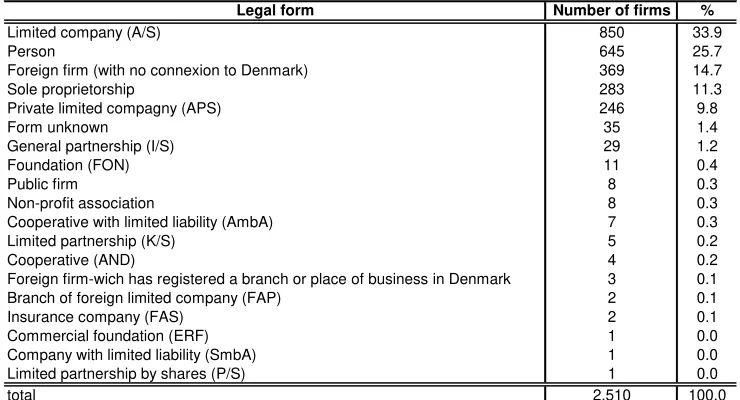
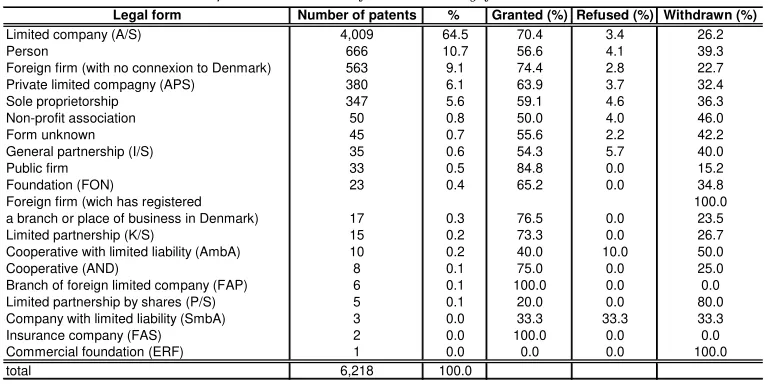
the dataset are stock listed limited companies (A/S), accounting for64% of the patents applied. The database counts a high number of "persons" or private applicants (25:7%of the applicants) which are involved in10:7%of the applications. An applicant is de…ned as being “private” if (i) there is no indication that the applicant is non-private (for example there is no “A/S” for stock listed …rms), (ii) the applicant name is a family name followed by …rst names or (iii) the applicant could neither be found by our manual nor by our automatic searches. Sole proprietorships, foreign (co-) applicants and private limited companies (ApS) follow. Notice that the legal form could not be determined for 1:4% of the applicants, corresponding to 0:7% of the applications. These …rms were typically out of business by the time we made the search and we were not able to …nd information about them. The other company forms account for less than1%of the applications. The table shows that the grant rate is rather high for applications in which foreign …rms are involved, as well as for applications by public …rms or stock listed companies. The grant rate is lower than the average for applications involving private applicants (persons) and sole proprietorships.
Table 3: Firm structures - Number of unique applicants
Legal form Number of firms %
Limited company (A/S) 850 33.9
Person 645 25.7
Foreign firm (with no connexion to Denmark) 369 14.7 Sole proprietorship 283 11.3 Private limited compagny (APS) 246 9.8
Form unknown 35 1.4
General partnership (I/S) 29 1.2 Foundation (FON) 11 0.4
Public firm 8 0.3
Non-profit association 8 0.3 Cooperative with limited liability (AmbA) 7 0.3 Limited partnership (K/S) 5 0.2 Cooperative (AND) 4 0.2 Foreign firm-wich has registered a branch or place of business in Denmark 3 0.1 Branch of foreign limited company (FAP) 2 0.1 Insurance company (FAS) 2 0.1 Commercial foundation (ERF) 1 0.0 Company with limited liability (SmbA) 1 0.0 Limited partnership by shares (P/S) 1 0.0
Table 4: Distribution of outcomes by …rm structure
Legal form Number of patents % Granted (%) Refused (%) Withdrawn (%)
Limited company (A/S) 4,009 64.5 70.4 3.4 26.2
Person 666 10.7 56.6 4.1 39.3
Foreign firm (with no connexion to Denmark) 563 9.1 74.4 2.8 22.7 Private limited compagny (APS) 380 6.1 63.9 3.7 32.4
Sole proprietorship 347 5.6 59.1 4.6 36.3
Non-profit association 50 0.8 50.0 4.0 46.0
Form unknown 45 0.7 55.6 2.2 42.2
General partnership (I/S) 35 0.6 54.3 5.7 40.0
Public firm 33 0.5 84.8 0.0 15.2
Foundation (FON) 23 0.4 65.2 0.0 34.8
Foreign firm (wich has registered 100.0
a branch or place of business in Denmark) 17 0.3 76.5 0.0 23.5
Limited partnership (K/S) 15 0.2 73.3 0.0 26.7
Cooperative with limited liability (AmbA) 10 0.2 40.0 10.0 50.0
Cooperative (AND) 8 0.1 75.0 0.0 25.0
Branch of foreign limited company (FAP) 6 0.1 100.0 0.0 0.0 Limited partnership by shares (P/S) 5 0.1 20.0 0.0 80.0 Company with limited liability (SmbA) 3 0.0 33.3 33.3 33.3
Insurance company (FAS) 2 0.0 100.0 0.0 0.0
Commercial foundation (ERF) 1 0.0 0.0 0.0 100.0
total 6,218 100.0
6.3
Experience and outcome of the patent application: non-parametric
evidence
Since the relationship between experience and outcome of the patent application is central in our analysis, it deserves further attention. An advantage from having applied for patents at the EPO in the past is expected. One may therefore expect patenting history to a¤ect the applicants’ chances of getting their patents granted. I will study the e¤ect of application portfolios, as a measure of …rms’ experience.
The relationship between the stock of applications and the outcome in Table 5 is not clear. The grant rate increases with the stock of applications up to a certain threshold and then decreases, while the refusal rate decreases steadily. This issue will be discussed in Section 7.2, together with the other results.
Table 5: Applications stock and incidence on outcomes
Application stock Grant Refusal Withdrawal Total
0 1,083 77 695 1,855
58.4% 4.2% 37.5% 100.0%
(0, 10] 1,242 69 431 1,742
71.3% 4.0% 24.8% 100.0%
(10, 100] 846 29 189 1,064
79.5% 2.7% 17.7% 100.0%
>100 408 16 262 688
59.5% 2.3% 38.2% 100.0%
Total 3,579 191 1,577 5,347
66.9% 3.6% 29.5% 100.0%
Pearson chi2(6) =184.1900 Pr = 0.000
Outcome
independence between applications stock and outcomes. Thus, there seems to be a rela-tionship between applicants’ patenting history and the outcome of the focal application.
6.4
Explanatory variables
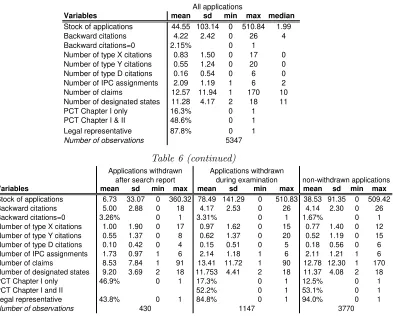
Summary statistics for all variables used in the analysis are presented in Table 6. Firms have, on average, 44:5 applications in their stock. However, the median, 1:99, indicates that the distribution is highly skewed and that large application portfolios are owned by few …rms. The number of patent references ranges from 0 to 26, with, on average, 0:83type X citations, 0:55 type Y citations, and 0:16 type D citations per patent. The patents have on average two IPC assignments and12:57claims. The applicants typically designate about eleven states. 16:3%of all applications went through the PCT Chapter I procedure and48:6%through Chapter I and II. The number of claims ranges from one to170.
Table 6: Descriptive statistics
Variables mean sd min max median
Stock of applications 44.55 103.14 0 510.84 1.99 Backward citations 4.22 2.42 0 26 4 Backward citations=0 2.15% 0 1 Number of type X citations 0.83 1.50 0 17 0 Number of type Y citations 0.55 1.24 0 20 0 Number of type D citations 0.16 0.54 0 6 0 Number of IPC assignments 2.09 1.19 1 6 2 Number of claims 12.57 11.94 1 170 10 Number of designated states 11.28 4.17 2 18 11 PCT Chapter I only 16.3% 0 1 PCT Chapter I & II 48.6% 0 1 Legal representative 87.8% 0 1
Number of observations
All applications
5347
Table 6 (continued)
Variables mean sd min max mean sd min max mean sd min max
Stock of applications 6.73 33.07 0 360.32 78.49 141.29 0 510.83 38.53 91.35 0 509.42 Backward citations 5.00 2.88 0 18 4.17 2.53 0 26 4.14 2.30 0 26
Backward citations=0 3.26% 0 1 3.31% 0 1 1.67% 0 1
Number of type X citations 1.00 1.90 0 17 0.97 1.62 0 15 0.77 1.40 0 12 Number of type Y citations 0.55 1.37 0 8 0.62 1.37 0 20 0.52 1.19 0 15 Number of type D citations 0.10 0.42 0 4 0.15 0.51 0 5 0.18 0.56 0 6 Number of IPC assignments 1.73 0.97 1 6 2.14 1.18 1 6 2.11 1.21 1 6 Number of claims 8.53 7.84 1 91 13.41 11.72 1 90 12.78 12.30 1 170 Number of designated states 9.20 3.69 2 18 11.753 4.41 2 18 11.37 4.08 2 18
PCT Chapter I only 46.9% 0 1 17.3% 0 1 12.5% 0 1
PCT Chapter I and II 52.2% 0 1 53.1% 0 1
Legal representative 43.8% 0 1 84.8% 0 1 94.0% 0 1
Number of observations
non-withdrawn applications
430 3770
Applications withdrawn during examination
1147 after search report
Applications withdrawn
[image:21.612.125.518.331.648.2]for non-withdrawn applications compared to the ones withdrawn under examination. A possible explanation is that there are strategic decisions involved. One could think that applicants with large applications portfolios apply for a high number of patents, possibly for the same invention, and wait for a …nal decision by the patent o¢ce only when the probability of grant is high, that is, when no con‡icting prior art has been found and when positive information has been received from the examiner.
The average number of "type X" and "type Y" references are higher for withdrawn applications, whereas the number or forward citations is much higher for non-withdrawn applications.
Two other important variables seem to be the presence of a legal representative and PCT Chapter II applications. The number of IPC assignments, the number of claims and the number of designated states are higher for non-withdrawn applications, but the di¤erence is very small.
7
Empirical analysis
7.1
Econometric speci…cation
Supposeyi1 and yi2 are latent variables representing the expected net present (private)
pro…ts to the …rms (or individuals) applying for patenti, after receiving the search report and during examination respectively. Moreover, assume thatyi3is the social welfare
func-tion that the patent o¢ce seeks to maximize. These variables are not directly observable. However, we can observe whether the applications are withdrawn or not and whether they are granted or refused by the patent o¢ce. Suppose that the latent variables are functions of observable value and quality characteristics of the patent (xi) and an unobserved part
( i) assumed to be jointly normally distributed, which leads to a Trivariate Probit Model
with Double Selection, an extension of the Bivariate Probit Model with Sample Selection due to Van de Ven and Van Praag (1981). The choice of this model is motivated by the fact that it may not be appropriate to analyze the patent o¢ce’s decision to grant the patent or to refuse the grant by using a single-equation model, since this decision is also related to the applicants’ choice to withdraw the application or not, prior to the patent o¢ce’s decision. In this model, data on a variable y3 (the EPO’s decision to grant the
patent or not) are observed only when another variable, y2 (the applicants decision to
request for the EPO’s …nal decision or to withdraw the application) is equal to one, which in turn, is only observed when the third binary variabley1 (the applicants decision to
yi1= 1xi1+ i1; yi1= 1ifyi1>0,0otherwise
yi2= 2xi2+ i2; yi2= 1ifyi2>0,0otherwise
yi3= 3xi3+ i3; yi3= 1ifyi3>0,0otherwise (2)
0 B @ i1 i2 i3 1 C AsN
2 6 4 0 B @ 0 0 0 1 C A; 0 B @
1 12 13
: 1 23
: : 1 1 C A 3 7 5
(yi2; xi2)is observed only when yi1= 1
(yi3; xi3)is observed only when yi2= 1
Thus, there are four types of observations with unconditional probabilities that need to be taken into account in the construction of the log-likelihood function:
L = X y1=0
ln ( 1xi1) +
X
y1=1;y2=0
ln 2( 1xi1; 2xi2; 12)
+X
y1=1;y2=1;y3=0
ln 3( 1xi1; 2xi2; 3xi3; 12; 23; 31) (3)
+X
y1=1;y2=1;y3=1
ln 3( 1xi1; 2xi2; 3xi3; 12; 23; 31),
where , 2 and 3denote, respectively, the univariate, bivariate and trivariate
nor-mal cumulative distribution functions, and the ijare the correlation coe¢cients between
the error terms. The likelihood function is maximized with respect to the k and ij (k; i; j= 1;2;3; i6=j).
As Equation 2 suggests, sample selection arises because the observation of y3 (the
patent is granted or refused) is not random, but conditional on the observation ofy2= 1
(the applicants do not withdraw the application under examination) and y1 = 1 (the
applicants request for examination). If the correction was not speci…ed, the model would take into account the outcomes that are not feasible.
If all the ij = 0, the model can be estimated using three independent probit
re-gressions. However, if the ij are signi…cantly di¤erent from zero, using single equation
estimates will generate inconsistent coe¢cients.
simulator is based on the Cholesky factorization of the covariance matrix, therefore, the only restriction that needs to be made is that the latter be positive de…nite.
In order to render the bias and noise induced by simulation negligible, I use 100 Halton draws. Draws derived from Halton sequences have the advantage of both improving coverage of the domain of integration and inducing a negative correlation between the draws from di¤erent observations, which are two desirable properties (see Train, 2003). Starting values were derived from three independent probit regressions.
Identi…cation of the model requires exclusion restrictions. The grant/refusal equation is identi…ed by excluding the "legal representative" dummy. Strictly speaking, the role of a representative is to help the applicant write the application document and to guide him/her through the application process, but a patent attorney cannot in‡uence the …nal decision of the examiner.6 In principle we cannot rationally exclude any other
patent-based variable from the selected equations, since each of them might potentially a¤ect the outcome at each stage of the model. The only variables that can be excluded from the …nal decision/withdrawal and grant/refusal equations but not from the …rst selection equation are the 30 technology dummies presented in Table 2. These variables account for di¤erences across sub-…elds and heterogeneity across these sub-…elds might be relatively strong in the …rst stage, because of the di¤erent practices with respect to patent activity and di¤erent strategies and motives for …lling an application. But once the application enters the substantive examination phase, this heterogeneity is expected to be much lower because examiners and applicants follow a standardized procedure. That’s why, I only insert the 6 aggregated technology classes (also presented in Table 2) in the last two stages of the model.
Before turning to the results, I will discuss a potential caveat of this speci…cation. The …rst decision (y1) is fully tied to the payment of the examination fee (see table 1).
However, the second decision (y2;withdraw during examination or stay the course) does
not only depend on the payment of a given fee. Table 1 shows that if the procedure takes more than three years, renewal fees have to be paid yearly, provided that exam-ination was requested. Thus the decision problem of the applicant is not discrete and is in reality more complex than the one presented here. However, unreported results of an unconditional survival model give similar results to the ones discussed below.7 The
discrete modelling of this equation is favoured in order to keep the model tractable, thus the corresponding coe¢cients of the second equation should be interpreted as "overall" probabilities. Nevertheless, this speci…cation is su¢cient to answer the main question of this paper (does experience matter?) and the results of the di¤erent robustness checks
6In speci…cations in which this variable is included in the grant/refusal equation, the corresponding
coe¢cient is indeed not signi…cant.
provided in Section 7.3 corroborate those of this speci…cation.
7.2
Results
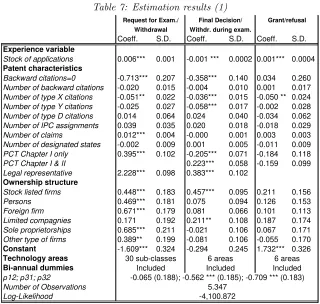
Table 7 shows the result of the Trivariate Probit estimation. In this section, I discuss the implication of the estimation results for the set of hypotheses discussed in Section 5.2.
The stock of applications has a positive e¤ect on the probability to request for exami-nation in Table 7, while the e¤ect is negative on the probability to pursue the application under examination and then positive again on the grant rate8. The intuition of this result is that …rms with large portfolios proceed by "trial and error", meaning that they apply for a high number of patents (in the hopes of some issuing), maintain the applications until they receive full information on the patentability of the invention through the search report and informal communications (or negotiations) with the examiner and thereafter wait for a …nal decision only when the probability of grant is high. This is fully re‡ected by the positive e¤ect of the variable in the third stage. The results suggest that experi-enced …rms push the application as far as possible in the procedure and only wait for a …nal decision by the EPO when the chances to be granted a patent are high. From a social welfare perspective, this result does not suggest that experienced …rms are able to obtain patents of dubious validity. My interpretation of this result is that experienced …rms have an optimal application strategy in order to minimize their costs. In other words, they know better than unexperienced …rms when the probability of grant of their applications is closer to one or to zero. This result shows that experience does indeed matter in the patent application process and that experienced applicants behave di¤erently than less experienced ones.
Applications containing high numbers of type X citations tend to be withdrawn more often. This result is intuitive, given that this type of citations is potentially damaging to the novelty requirement of the claimed invention. This mirrors a scenario in which …rms withdraw their applications after receiving a negative search report. During examination the e¤ect of X references is also negative (…nal decision/withdrawal under examination
equation), as well as the Y references, which were insigni…cant at the …rst stage. This result suggests that applicants withdraw their applications after they receive the search report only when the existence of con‡icting prior art is obvious (X references). On the other hand, applications for which the demonstration of the existence of damaging prior art is more subtle (Y references, that have to be combined with each other in order to
8A quadratic speci…cation of the stock of applications leads to similar results, i.e., the squared term
demonstrate con‡ict with prior art) are more likely to be withdrawn during examination, possibly because of communications between the examiner and the applicants. This means that information given to the applicant by the examiner is consistent with the results of the search report. In the Grant/Refusal equation, the number of type X citations, the most harmful to the novelty requirement, has a negative impact on the probability of grant, as expected.
D references (those already mentioned in the application) do not have a signi…cant impact on any of the stages of the procedure. One reason, could be that, unlike at the USPTO, applicants do not have the legal "Duty of Candor" in disclosing prior art information. In other words, inclusion of references to prior art by the applicant is not mandatory, thus interpretation of the e¤ect of this variable is not straightforward.
The technical characteristics (number of claims and number of IPC assignments) are insigni…cant in the grant/refusal stage, suggesting that the breadth of the application and/or the precision of the description of the claimed invention has no e¤ect on the outcome.9 However, applications containing more claims have a higher probability to go
through examination, which suggests that these applications are abandoned less quickly.
Regarding the number of designated states, no signi…cant e¤ect is observed.10
Time-zero value correlates have in general almost no e¤ect on the application process. This result has strong managerial implications, since it could be a sign that applicants are either unaware of the potential value of their invention, or if they are aware, they do not act consequently.
This presumption is reinforced by the result on applications that went through the PCT procedure. PCT Chapter I applications are more likely to be withdrawn during examination, while PCT Chapter I & II applications have a positive impact at this stage. This con…rms the results found by Guellec and Van Pottelsberghe (2002). PCT I applica-tions have unclear market potential given that it provides the applicants with more time to decide whether to extend the right of the patents, whereas applicants who wait until their application reaches the Chapter II procedure are usually more aware of the market potential of the invention.
Professional representatives are found to be successful in pushing the application as far as possible in the procedure.
9A linear relationship between the number of claims and the outcome gave the same result.
1 0Di¤erent non-linear speci…cations have been tested regarding the designated states, following Guellec
Finally, regarding the ownership structures, the stock listed …rms, typically big …rms, are the only ones to carry a positive and signi…cant e¤ect, on the probability to wait until the grant/refusal decision. Publicly traded …rms have typically less …nancial constraints and can thus be assumed to be less risk averse than other type of applicants.
These results highlight another interesting point. The year e¤ects are not signi…cant in the grant/refusal equation, which means that after controlling for observable …rm and patent characteristics the average propensity to grant a patent did not vary over time.11 This is a crucial question from a policy point of view, since concerns are currently
expressed about the "quality" of the examination procedure given the rising workload of patent o¢ces worldwide. There are empirical evidence suggesting that the USPTO has reacted to this increase in the demand for patents by allowing low quality patents to slip through the procedure (see Lemley, 2001), which led to an increase in the overall grant rate, while the (actual) grant rate at the EPO decreased from 1980 to 1989 and then remained fairly constant (see Martinez and Guellec, 2003). A variety of studies suggest that there is a decline in the standard of patent applications at the USPTO (see for example Harho¤ and Hall, 2004 for a detailed discussion on this issue). On the basis of my results, one cannot conclude that the examination standards at the EPO weakened over time.
1 1The year dummies are signi…cantlty positive in the …rst two equations from 1988 onwards in the
Table 7: Estimation results (1)
Coeff. S.D. Coeff. S.D. Coeff. S.D.
Experience variable
Stock of applications 0.006*** 0.001 -0.001 *** 0.0002 0.001*** 0.0004
Patent characteristics
Backward citations=0 -0.713*** 0.207 -0.358*** 0.140 0.034 0.260
Number of backward citations -0.020 0.015 -0.004 0.010 0.001 0.017
Number of type X citations -0.051** 0.022 -0.036*** 0.015 -0.050 ** 0.024
Number of type Y citations -0.025 0.027 -0.058*** 0.017 -0.002 0.028
Number of type D citations 0.014 0.064 0.024 0.040 -0.034 0.062
Number of IPC assignments 0.039 0.035 0.020 0.018 -0.018 0.029
Number of claims 0.012*** 0.004 -0.000 0.001 0.003 0.003
Number of designated states -0.002 0.009 0.001 0.005 -0.011 0.009
PCT Chapter I only 0.395*** 0.102 -0.205*** 0.071 -0.184 0.118
PCT Chapter I & II 0.223*** 0.058 -0.159 0.099
Legal representative 2.228*** 0.098 0.383*** 0.102
Ownership structure
Stock listed firms 0.448*** 0.183 0.457*** 0.095 0.211 0.156
Persons 0.469*** 0.181 0.075 0.094 0.126 0.153
Foreign firm 0.671*** 0.179 0.081 0.066 0.101 0.113
Limited compagnies 0.171 0.192 0.211** 0.108 0.187 0.174
Sole proprietorships 0.685*** 0.211 -0.021 0.106 0.067 0.171
Other type of firms 0.389** 0.199 -0.081 0.106 -0.055 0.170
Constant -1.609*** 0.324 -0.294 0.245 1.732*** 0.326
Technology areas Bi-annual dummies ρ12; ρ31; ρ32
Number of Observations Log-Likelihood
*** p<0.01, ** p<0.05, * p<0.1
Grant/refusal Withdrawal Withdr. during exam.
Request for Exam./ Final Decision/
-0.065 (0.188); -0.562 *** (0.185); -0.709 *** (0.183) 5.347
-4,100.872
30 sub-classes 6 areas 6 areas Included Included
Included
7.3
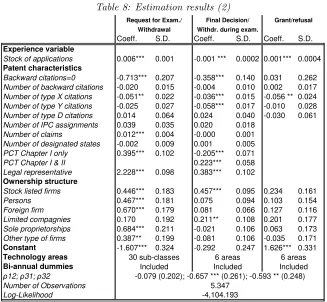
Sensitivity analysis and robustness checks
Table 8: Estimation results (2)
Coeff. S.D. Coeff. S.D. Coeff. S.D.
Experience variable
Stock of applications 0.006*** 0.001 -0.001 *** 0.0002 0.001*** 0.0004
Patent characteristics
Backward citations=0 -0.713*** 0.207 -0.358*** 0.140 0.031 0.262
Number of backward citations -0.020 0.015 -0.004 0.010 0.002 0.017
Number of type X citations -0.051** 0.022 -0.036*** 0.015 -0.056 ** 0.024
Number of type Y citations -0.025 0.027 -0.058*** 0.017 -0.010 0.028
Number of type D citations 0.014 0.064 0.024 0.040 -0.030 0.061
Number of IPC assignments 0.039 0.035 0.020 0.018
Number of claims 0.012*** 0.004 -0.000 0.001
Number of designated states -0.002 0.009 0.001 0.005
PCT Chapter I only 0.395*** 0.102 -0.205*** 0.071
PCT Chapter I & II 0.223*** 0.058
Legal representative 2.228*** 0.098 0.383*** 0.102
Ownership structure
Stock listed firms 0.446*** 0.183 0.457*** 0.095 0.234 0.161
Persons 0.467*** 0.181 0.075 0.094 0.103 0.154
Foreign firm 0.670*** 0.179 0.081 0.066 0.127 0.116
Limited compagnies 0.170 0.192 0.211** 0.108 0.201 0.177
Sole proprietorships 0.684*** 0.211 -0.021 0.106 0.063 0.173
Other type of firms 0.387** 0.199 -0.081 0.106 -0.035 0.171
Constant -1.607*** 0.324 -0.292 0.247 1.626*** 0.331
Technology areas Bi-annual dummies ρ12; ρ31; ρ32
Number of Observations Log-Likelihood
*** p<0.01, ** p<0.05, * p<0.1
Request for Exam./ Final Decision/ Grant/refusal Withdrawal Withdr. during exam.
30 sub-classes 6 areas 6 areas Included Included Included -0.079 (0.202); -0.657 *** (0.261); -0.593 ** (0.248)
5.347 -4,104.193
I also perform several robustness checks. Appendix C reports the result of a probit model of the probability to grant against the other outcomes (i.e. the two types of withdrawals and the refusals are pooled), one can see that it is much more di¢cult to de…ne which e¤ect is induced by which player and at which stage. Moreover, the application stock has an overall negative e¤ect, which is di¢cult to interpret.
refusals and withdrawals should be treated separately.
In Appendix E, I report the estimation results of an ordered probit model. The dependent variable is assumed to be ordered, because outcomes can be ranked with respect to their implications for the pro…ts of the applicant, i.e., a refusal is assumed to be the worst outcome possible for the applicants followed by a withdrawal and a grant. There is no major di¤erence with the models previously estimated, but again, the stock of applications carries a negative sign.
8
Conclusion
The aim of this paper was to analyze the determinants of the outcomes of patents applied for by Danish …rms at the EPO and to study the impact of the …rms’ experience on these outcomes. I used a database of 5,347 patent applications over the period 1978-1998 and applied a Trivariate probit model accounting for self-selection.
The applicants’ patenting history, as measured by the stock of applications, is found to be an important factor in all stages of the application process, which shows that expe-rienced applicants indeed behave di¤erently than unexpeexpe-rienced ones. It seems that …rms having large patents portfolios act following a "trial and error" strategy, by applying for large numbers of patents and thereafter maintain the application only when the expected probability of grant is high, leading to a positive e¤ect of the size of the applications portfolio on the probability of grant.
The paper also investigates the determinants of the withdrawal decision of patent applications. The results show that the outcome of the search report is a crucial driver of the applicant and patent o¢ce’s behaviors. Applicants tend to withdraw their applications when the result of the preliminary search report issued by the patent o¢ce is negative. Thus, the applicants update their information set after receiving the search report and if the expected probability of grant is low, that is, the search report shows evidence that the claimed invention is not novel, they tend to withdraw their application. Withdrawals also occur during examination, where the applicant can obtain additional information from the examiner regarding the patentability of the invention. The results show that this information is consistent with the results of the search report, since withdrawals are more likely to occur when con‡icting prior art exists. A withdrawal can then be viewed as an expected refusal.
Other important results of the paper are the following:
Time-zero value correlates have little explanatory power.
the grant/refusal decision made by the patent o¢ce is more di¢cult to predict than earlier studies using an unconditional grant/other outcomes suggest.
References
[1] Bennedsen, M., Nielsen, K. M., Perez-Gonzalez, F. and Wolfenzon, D. (2006) "Inside the Family Firm:The Role of Families in Succession Decisions and Performance", forthcoming inQuarterly Journal of Economics.
[2] Caillaud, B. and Duchêne, A. (2006) "Patent O¢ce in Innovation Policy: Nobody’s Perfect", mimeo, Paris School of Economics.
[3] Cockburn, I., Kortum, S. and Stern, S. (2002) "Are all patent Examiners Equal? Examiners, Patent Characteristics and Litigation Outcomes" in Cohen, W. and Merrill, S. (eds.)Patents in the Knowledge-Based Economy, National Academies Press, Washington DC, 2003.
[4] Czarnitzki, D., Hall, B. and Oriani, R. (2005) “The Market Value of Knowledge Assets in U.S. and European Firms,” in D. Bosworth and E. Webster (eds.),The Management Of Intellectual Property.
[5] Delmar, F. and Shane, S. (2006) "Does Experience Matter? The E¤ect of Founding Team Experience on the Sales of Newly Founded Firms",Strategic Organization, 4(3), 215-247.
[6] Dixit, A. (1989) "Entry and Exit Decision under Uncertainty",Journal of Political Economy, 97 (3), 620-638.
[7] Gambardella, A., Harho¤, D. and Verspagen, B. (2006) "The Value of Patents", mimeo.
[8] Gourieroux, C. and Monfort, A. (1996). "Simulation-Based Econometric Methods", Oxford: Oxford University Press.
[9] Guellec D. and van Pottelsberghe, B. (2000) "Applications, grants and the value of patents", Economic Letters, 69 (1), pp. 109-114.
[10] Guellec and Van Pottelsberghe (2002) "The Geographical and Technological Speci-…cities of Patenting Strategies" Economics of Innovation and New Technology.
[11] Hall, B. H. (1990), “The Manufacturing Sector Master File: 1959-1987.” NBER
Working Paper No. 3366
[12] Hall, B. H. and Harho¤, D. (2004) "PostGrant Reviews in the US Patent System -Design Choices and Expected Impact"Berkeley Technology Law Journal, 19 (1).
[13] Hall, B. H. and Ziedonis, R. H. (2001), "The Determinants of Patenting in the US Semiconductor Industry, 1980-1994",Rand Journal of Economics, 32 (), 101-128.
[15] Harho¤, D. and Reitzig (2004) "Determinants of Opposition against EPO Patent Grants - the Case of Biotechnology and Pharmaceuticals" International Journal of Industrial Organization, 22(4) 443-480
[16] Harho¤, D. and Wagner, S. (2005), "Modelling the Duration of Patent Examination at the European Patent O¢ce"CEPR Discussion Paper No. 5283.
[17] Harho¤, D., Hoisl, K. & Webb, C. (2005), "European Patent Citations – How to count and how to interpret them", Unpublished Discussion paper,University of Munich.
[18] Harho¤, D., Scherer, F. & Vopel, K. (2003), "Citations, Family Size, Opposition and the of Value of Patent Rights", Research Policy32(8), 1343–1363.
[19] Kaiser, U. and Kongsted, H. C. (2007) "True versus Spurious State Dependence in Firm Performance: The Case of West-German Exports" Empirical Economics, forthcoming.
[20] Kaiser, U. & Schneider, C. (2004), The CEBR Matched Patent/Patent Appli-cant/Employee Data Base: Part 1 – Patent Data and Applicant data, miméo,
Centre for Economic and Business Research.
[21] Kaiser, U., Licht, G., Rønde, T. & Schneider, C. (2005) "Patent Activity in Den-mark" Discussion Paper No 2005-09,Centre for Economic and Business Research.
[22] Langinier, C. and Marcoul, P. (2007) "Patents, Search of Prior Art and Revelation of Information", Working Paper, Iowa State University.
[23] Lanjouw, J. & Schankerman, M. (2004), "Patent Quality and Research Productivity: Measuring Innovation with Multiple Indicators", The Economic Journal, 114(), 441-465.
[24] Lanjouw, J. & Schankerman, M. (2004), "Protecting Intellectual Property Rights: Are Small Firms Handicapped?"The Journal of Law and Economics, XLVII (1), 45-74.
[25] Lanjouw, J. Pakes, A. and Putnam, J.(1998) "How to Value Patents and Intellec-tual Property: Uses of patent Renewals and Application Data" The Journal of Industrial Economics, XLVI (4), 405-433.
[26] Lemley, M. A. (2001) "Rational Ignorance at the Patent O¢ce",Northwestern Uni-versity Law Review, 95 (4), 21-56.
[27] Lerner, J.(1994) "The Importance of Patent Scope: an Empirical Analysis" Rand Journal of Economics, 25 (2), 319-333.
[29] Martinez, C. and Guellec, D. (2003) "Overview of Recent Trends in Patent Regimes in United States, Japan and Europe",OECD, DSTI/STP/TIP(2003)6.
[30] OECD (2004), "Compendium of Patent Statistics",OECD.
[31] Regibeau, P. and Rockett, K. (2007), Are More Important Patents Approved more Slowly and Should They?,CEPR Discussion Paper No 6178
[32] Peters, B. (2007) "Persistence of Innovation: Stylized Facts and Panel Data Evi-dence"Journal of Technology Transfer, forthcoming.
[33] Popp, D., Juhl, T. and Johnson, D. (2003) "Time in Purgatory: Determinants of the Grant Lag for US Patent Applications",Topics in Economic Analysis & Policy, 4(1)
[34] Roberts, M. J. and Tybout, J. R. (1997), "The Decision to Export in Colombia: An Empirical Model of Entry with Sunk Costs", The American Economic Review, 87 (4), 545-564.
[35] Train, K. (2003), "Discrete Choice Methods with Simulations", Cambridge Univer-sity Press.
[36] Van de Ven, W.P.M.M., and Van Praag, B.M.S. (1981), "The Demand For De-ductibles in Private Health Insurance, a Probit Model with Sample Selection,
Journal of Econometrics, 17(), 229-252.
[37] Van Dijk, T. and Duysters, G. (1998), "Passing the European Patent O¢ce: Evi-dence from the Data-Processing Industry",Research Policy, 27, 937-946.
[38] Webb, C., Dernis, H., Harho¤, D. and Hoisl, K. (2005), "Analyzing European and International Patent Citations: A Set of EPO Patent Database Building Blocks",