An Enhanced DCT based Image Fusion using Adaptive
Histogram Equalization
Jagdeep Singh
Amritsar College of Engg. & Tech., Amritsar, Punjab, India.
Vijay Kumar Banga, Ph.D
Amritsar College of Engg. & Tech.,Amritsar, Punjab, India.
ABSTRACT
Image fusion fuses the information from several images of one scene to obtain a precise, complete and reliable image which is more appropriate for human visual perception or additional vision processing. The quality of an image is closely related to image focus. The discrete cosine transforms (DCT) based methods of image fusion are more suitable and time-saving in real-time systems using DCT based standards of still image or video. DCT based image fusion produced results but with lesser clarity, less PSNR value and more Mean square error. This paper proposes a new algorithm whose overall objective is to improve the results by combining DCT with adaptive histogram equalization. The experimental results and comparison has shown that the proposed algorithm provides a significant improvement over the existing DCT based fusion techniques.
General Terms
Image Processing, Image Fusion
Keywords
Discrete Cosine Transformation (DCT), Image Fusion, Principle Component Analysis, Adaptive histogram equalization
1. INTRODUCTION
Image fusion is a way of merging relevant information from several images into a single image. The resultant fused image will be useful for computer processing task than any of the input images. Image fusion takes information of interest from several images of same scene and integrate it into one useful image; information of interest varies with area under consideration. The image fusion objective is to extract all the valuable information from input images without the addition of artifacts or discrepancies [5]. Image fusion is a proper method for integration of similar sensor and multi-sensor images to develop an image with enhanced information. The image fusion goal is to convey only the worthwhile information by uniting appropriate information from several images of the same scene [3]. The image fusion methods using discrete cosine transform (DCT) are considered to be more appropriate and time-saving for real-time systems using standards of still image or video based on DCT [3]. A visual sensor network (VSN) is a network consists of several smart camera or sensor devices distributed spatially. They are capable of handling and fusing images of a scene from different viewpoints into a single and more useful image than the individual images. Visual sensors or cameras generate a great amount of data. This needs additional local processing to convey only the useful information in a concise and appropriate form. Visual sensor networks (VSNs) are suitable for area surveillance, tracking, and environmental monitoring
[image:1.595.314.550.262.437.2]applications. Image fusion is a process of finding the appropriate information from each of the several input images and combine to form an image whose quality is superior to every input images [13].
Figure 1. Image fusion process [16]
Figure 1 is demonstrating the complete process of the image fusion with respect to resolution concept. It is clearly shown that the intensity of low resolution image is substituted with the intensity component of high resolution image. Image fusion is a suitable option for many applications which require high spatial and spectral resolution in a single image. The Image fusion techniques are also used in medical science. Medical image fusion helps to do an accurate disease diagnosis [10]. Medical fusion image generally combine functional image and anatomical image to produce one image with plenty of information for an accurate diagnose of disease [11].
2. EXISTING IMAGE FUSION
METHODS
Image fusion algorithms can be categorized into three levels. They are referred to as pixel, feature and decision level of representation depending on the level at which fusion occur [8]. These fusion methods can be generally categorized into spatial domain and transform domain fusion. Brovey method, Principal Component analysis (PCA), IHS (intensity hue saturation) and High pass filtering methods fall in the spatial domain fusion techniques. Spatial image fusion work by combining the pixel values of the two or more images.
2.1
Fusion Methods Based on Averaging
are some more fusion methods such as select maximum, select minimum etc. that works on corresponding pixels of input images to get pixel of output image. But they produce less quality images as output.
2.2 Discrete Cosine Transform (DCT)
[image:2.595.55.306.267.422.2]Discrete Cosine Transformation (DCT) is important to numerous applications in science, engineering and in image compression like MPEG etc. [2]. For simplicity, Discrete Cosine Transformation (DCT) can convert the spatial domain image to frequency domain image [8]. Figure 2 shows the process flow diagram for Discrete Cosine Transformation (DCT) fusion. Large DCT coefficients are concentrated in the low frequency regions; hence, it is known to have excellent energy compactness properties [13]. The images to be fused are divided into blocks of size NxN. DCT Coefficients are computed and fusion rules are applied to get fused DCT Coefficients. IDCT is applied to produce the fused image [13].
Figure 2. Image fusion process using DCT [13]
The definition of the two-dimensional DCT for an input image A and output image B is
Where
And
M and N are the row and column size of A, respectively [17]. If you apply the DCT to real data, the result is also real. The DCT tends to concentrate information, making it useful for image processing applications. There are several circumstances in image processing where high spatial and high spectral resolution in one image is required. The main
application of image fusion is merging the grey level high resolution panchromatic image and the coloured low resolution multispectral image. The image fusion techniques permit the integration of different information sources [2]. Both spatial and spectral resolution characteristics can be present in a fused image.
2.3 Principal Component Analysis (PCA)
[image:2.595.56.275.499.691.2]Principal component analysis (PCA) is an important statistical tool that transforms multivariate data with correlated variables into one with uncorrelated variables [5]. PCA is used amply in all forms of analysis - from neuroscience to computer graphics - because it is a simple, non-parametric method of extracting relevant information from mystifying data sets. For images, it creates an uncorrelated feature space which can be used for further analysis instead of the original multispectral feature space. This technique is applied to the multispectral bands. The PCA converts inter correlated MS bands into a new set of uncorrelated components. The first component is replaced by a high-resolution PAN for the fusion. The reverse PCA transform is performed to bring fused dataset back into the original multispectral feature space.
Figure 3. Image fusion using PCA [13]
Steps involved in PCA Fusion are:
a) Input images size checking is done to ensure that source images are of same size.
b) Then input images are arranged into column vectors. Let Z is the resulting column vector of dimension 2*N.
c) Calculate the empirical mean along each column. The dimension of Empirical mean vector Ev is 1*2.
d) Subtract Ev from each column of matrix Z. The resulting
matrix X has dimension 2*N.
e) Find covariance matrix C of matrix X.
f) Compute the eigenvector and eigenvalue of C and sort them in decreasing eigenvalue.
g) Consider first column of vector which correspond to larger Eigen value to compute normalized component P1 and P2.
The fused image is
If (x, y) = P1I1(x, y) + P2I2 (x, y) where P1 and P2 are the normalized components such as P1 = V(1)/∑V and P2 =
V(2)/∑V where V is eigenvector and P1 + P2 = 1.
The methods such as PCA, IHS Transform, and Brovey Transform have been generating good quality fused images but suffer from some limitations. The most significant
P
1I
1+ P
2I
2Fused Image
I
1I
2I
fPrincipal Component
Analysis
P
1P
2problem is color distortion. Wavelet transform and Laplacian transform are some of the other fusion techniques [7]. In the transform domain method the multi-scale decomposition of the images is done and the composite image is constructed by using the fusion rule. Then inverse multi-scale transform is applied to achieve the fused image. These methods produce fusion results suffering from blocking effects problem. The wavelet transform has been used more extensively than other methods. The wavelet transform is having a restricted ability to handle curved structure images. To overcome this curve let image fusion is suggested [4]. These techniques display an improved performance in spatial and spectral quality of the output fused image than any other spatial fusion techniques.
3. PROPOSED ALGORITHM
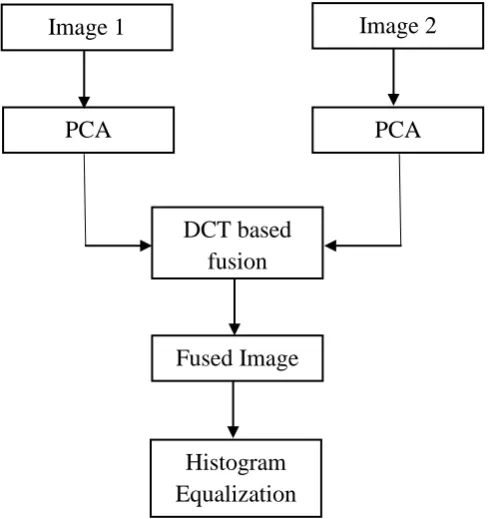
The image fusion methods using discrete cosine transform (DCT) are considered to be more appropriate and time-saving in real-time systems. An efficient method for multi-focus images fusion is proposed. The proposed algorithm will integrate PCA and DCT to achieve the fusion process. In order to enhance the results histogram equalization on the output image is used. The overall objective is to improve the visibility of fused images. The figure 4 shows the flowchart of proposed algorithm.
The proposed algorithm includes the following steps:
1.First of all two images which are partially blurred are passed to the system.
2.Apply RGB2PCA to convert given image in PCA plane. 3.Now differentiate PCA of image1 and image2 into their 3
planes as image is assumed to be in RGB.
4.For PCA(:,:,1) of image 1 and image 2 will be passed for fusion using DCT and PCA(:.:.2) & PCA(:.:.3) of image 1 and image 2 will determine new components by taking their averages respectively.
5.Now concatenation of each output of step 4 will be done. 6.Now PCA2RGB will be applied to get original fused
image.
7. Now Histogram equalization will be applied to get clearer image.
[image:3.595.315.560.71.331.2]
Figure 4. Flowchart of proposed algorithm
4. EVALUATION OF IMAGE FUSION
Quality is a characteristic that measures perceived image degradation i.e., in comparison with ideal or perfect image [15]. The evaluation plays a major role in the development of efficient image fusion techniques. The basic requirement for quality assessment of fusion image is to keep the useful information of source images at the best effort and reduce distortion [1]. The objective image quality metrics are categorized according to the availability of a reference (original) image, with which the modified (or fused) image is to be compared. The most important are with reference and no reference approach. With reference methods are those where quality is measured in comparison with ideal image and no reference methods, which have no reference image. Here we have used full reference methods to evaluate our proposed algorithm. The most extensively used full reference image quality measures are Mean Square Error (MSE) and Peak Signal to Noise Ratio (PSNR). In the following equations A is the perfect image and B is the resultant fused image. The pixel row and column index are represented by i and j respectively.
1) Mean Square Error (MSE)
MSE is zero when Ai j = Bi j
2) Peak Signal to Noise Ratio (PSNR)
In the previous equation MAX represent the maximum fluctuation in the input image data type.
5. EXPERIMENTAL RESULTS
The proposed algorithm has been implemented in MATLAB using image processing toolbox. This section contains the experimental results. By taking different partially blurred images, we have conducted some experiments by using
Image 2
PCA
Image 1
PCA
DCT based
fusion
Fused Image
existing DCT based fusion and proposed algorithm. It is found that the integrated approach of DCT based fusion with adaptive histogram equalization produce quite better results than existing DCT based fusion.
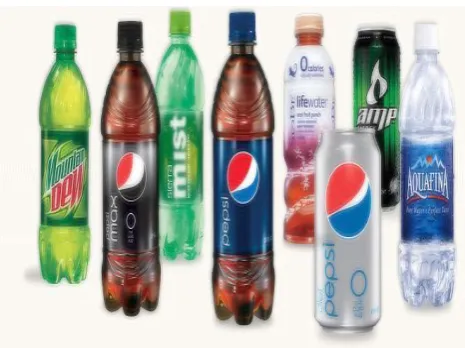
[image:4.595.54.284.166.339.2]Figure 5 and Figure 6 are showing the input images which are partially blurred. Both images are of the same size and of the same scene and also as per the assumptions they are of the same scene.
Figure 5. Left blurred image of bottles
Figure 6. Right blurred image of bottles
Figure 7 is showing the result of the DCT based fusion. It is clearly shown from the figure that the output image is fused but has some artefact as well as some random noise is also present in the images.
[image:4.595.316.549.285.449.2]Figure 7. Fused image using existing DCT fusion
Figure 8. Fused images using proposed algorithm
Figure 8 is showing the result of the proposed algorithm. It is clearly shown from the figure that the output image is fused as well as there exist no artefact as well as no random noise as both problems are presented in the output image of DCT based fusion.
6. PERFORMANCE ANALYSIS
[image:4.595.54.295.375.546.2]Figure 9. Plot of MSE readings for 15 image sets
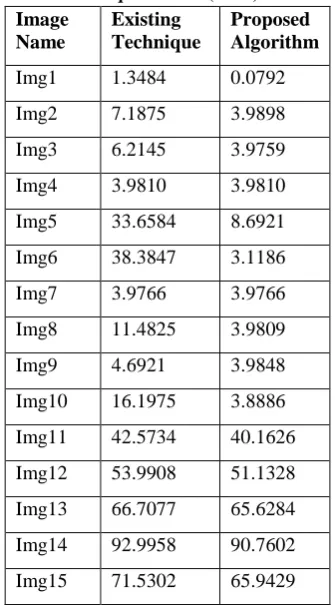
[image:5.595.54.300.72.265.2]In Figure 9 and Table 1 it is clear that the MSE value for proposed algorithm is less than the values obtained by the existing algorithm. Thus the proposed algorithm is giving better value of MSE.
Table 1. Mean square error (MSE) evaluation
Image Name
Existing Technique
Proposed Algorithm
Img1 1.3484 0.0792
Img2 7.1875 3.9898
Img3 6.2145 3.9759
Img4 3.9810 3.9810
Img5 33.6584 8.6921
Img6 38.3847 3.1186
Img7 3.9766 3.9766
Img8 11.4825 3.9809
Img9 4.6921 3.9848
Img10 16.1975 3.8886
Img11 42.5734 40.1626
Img12 53.9908 51.1328
Img13 66.7077 65.6284
Img14 92.9958 90.7602
Img15 71.5302 65.9429
[image:5.595.315.558.76.569.2] [image:5.595.347.508.89.441.2]Larger PSNR indicates a smaller difference between the original and the reconstructed image. In Figure 10 and Table 2 it is shown that the PSNR value of proposed algorithm is much greater than that of the old algorithm. Thus the proposed algorithm is giving better results for PSNR value.
Table 2. Peak signal to noise ratio evaluation Image
Name
Existing Technique
Proposed Algorithm
Img1 46.8326 59.1434
Img2 39.5651 42.1213
Img3 40.1967 42.1364
Img4 42.1309 42.1309
Img5 32.8599 38.7395
Img6 32.2892 43.1912
Img7 42.1357 42.1357
Img8 37.5304 42.1310
Img9 41.4171 42.1268
Img10 36.0363 42.2329
Img11 31.8394 32.0926
Img12 30.8076 31.0438
Img13 29.8890 29.9599
Img14 28.4462 28.5519
Img15 29.5859 29.9391
Figure 10. Plot of PSNR readings for 15 image set
[image:5.595.83.251.353.656.2]Large value of MD means that image is of poor quality. In Figure 11 and Table 3 the maximum difference values of proposed algorithm is lower than the MD values of the existing algorithm. Hence our proposed algorithm gives better results.
Table 3. Maximum difference (MD) evaluation
Image Name
Existing Technique
Proposed Algorithm
Img1 37 37
Img2 23 10
Img3 11 5
[image:5.595.348.511.664.770.2]Img5 20 2
Img6 25 8
Img7 5 5
Img8 12 4
Img9 12 7
Img10 37 9
Img11 95 94
Img12 113 104
Img13 72 69
Img14 94 93
[image:6.595.56.306.66.475.2]Img15 70 70
Figure 11. Plot of MD readings for 15 image set
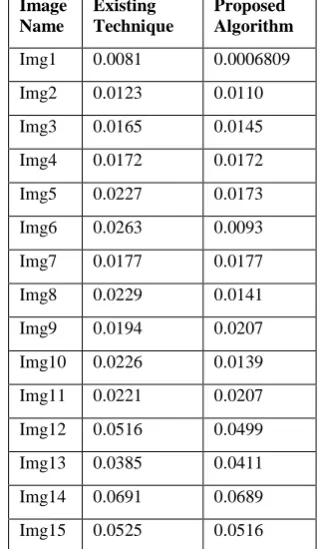
[image:6.595.316.562.77.265.2]Larger value of NAE indicates poor quality of the image. In Figure 12 and Table 4 the NAE values of new algorithm are less than the NAE values of the old algorithm. Therefore the proposed algorithm is giving better values for NAE.
[image:6.595.347.510.312.587.2]Figure 12. Plot of NAE readings for 15 image set
Table 4. Normalized absolute error evaluation Image
Name
Existing Technique
Proposed Algorithm
Img1 0.0081 0.0006809
Img2 0.0123 0.0110
Img3 0.0165 0.0145
Img4 0.0172 0.0172
Img5 0.0227 0.0173
Img6 0.0263 0.0093
Img7 0.0177 0.0177
Img8 0.0229 0.0141
Img9 0.0194 0.0207
Img10 0.0226 0.0139
Img11 0.0221 0.0207
Img12 0.0516 0.0499
Img13 0.0385 0.0411
Img14 0.0691 0.0689
Img15 0.0525 0.0516
7. CONCLUSION
analysis has shown the significant improvement of the proposed algorithm over the available algorithms.
In near future we would like to extend this work to use other filters to enhance the DCT based fusion in more efficient manner. Also to take the full benefits of the proposed algorithm we would like to extend this work to use it in real cameras by using the embedded systems.
8.
REFERENCES
[1] Pei, Yijian, Huayu Zhou, Jiang Yu, and Guanghui Cai, "The improved wavelet transform based image fusion algorithm and the quality assessment", IEEE 3rd
International Conference on Image and Signal Processing (CISP), vol. 1, pp. 219-223, 16-18 Oct. 2010.
[2] Haifeng Liu, Mike Deng, Chuangbai Xiao, and Xiao Xu, "Image fusion algorithm based on adaptive weighted coefficients", IEEE 10th International Conference on Signal Processing (ICSP), Beijing, pp. 748-751, 24-28 Oct., 2010.
[3] Haghighat, Mohammad Bagher Akbari, Ali Aghagolzadeh, and Hadi Seyedarabi, "Real-time fusion of multi-focus images for visual sensor networks", IEEE 6th Iranian Machine Vision and Image Processing (MVIP),Isfahan, pp. 1-6, 27-28 Oct., 2010.
[4] Cao, Jian-zhong, Zuo-feng Zhou, Hao Wang, and Wei-hua Liu. "Multifocus Noisy Image Fusion Algorithm Using the Contourlet Transform.", IEEE International Conference on Multimedia Technology (ICMT) Ningbo, pp. 1-4, 29-31 Oct., 2010.
[5] Mohamed, M. A., and B. M. El-Den. "Implementation of image fusion techniques for multi-focus images using FPGA", IEEE 28th National Radio Science Conference (NRSC), Cairo, pp. 1-11, 26-28 April, 2011.
[6] Lavanya, A., K. Vani, S. Sanjeevi, and R. S. Kumar, "Image fusion of the multi-sensor lunar image data using wavelet combined transformation" IEEE International Conference on Recent Trends in Information Technology (ICRTIT), pp. 920-925, 3-5 June, 2011.
[7] Ren, Haozheng, Yihua Lan, and Yong Zhang. "Research of focus image fusion based on M-band multi-wavelet transformation", IEEE Fourth International Workshop on Advanced Computational Intelligence (IWACI), Wuhan, pp. 395-398, 19-21 Oct., 2011.
[8] Patil, Ujwala, and Uma Mudengudi. "Image fusion using hierarchical PCA" IEEE International Conference on Image Information Processing (ICIIP), pp. 1-6, 3-5 Nov., 2011.
[9] Chu-Hui Lee and Zheng-Wei Zhou, “Comparison of Image Fusion based on DCT-STD and DWT-STD”, International Multi-Conference of Engineers and Computer scientists 2012 Vol. I, IMECS2012, Hong Kong, March 14-16, 2012.
[10]Prakash, Chandra, S. Rajkumar, and P. V. S. S. R. Mouli. "Medical image fusion based on redundancy DWT and Mamdani type min-sum mean-of-max techniques with quantitative analysis" IEEE International Conference on Recent Advances in Computing and Software Systems (RACSS), pp. 54-59, 25-27 April, 2012.
[11]Parmar, Kiran, Rahul K. Kher, and Falgun N. Thakkar. "Analysis of CT and MRI Image Fusion Using Wavelet Transform." IEEE International Conference on Communication Systems and Network Technologies (CSNT), pp. 124-127, 11-13 May, 2012.
[12]S. Zebhi, M.R. Aghabozorgi Sahaf, M.T. Sadeghi, “Image fusion using PCA in CS domain”, An International Journal of Signal & Image Processing, Vol.3, No.4, August 2012.
[13]Desale, Rajenda Pandit, and Sarita V. Verma. "Study and analysis of PCA, DCT & DWT based image fusion techniques" IEEE International Conference on Signal Processing Image Processing & Pattern Recognition (ICSIPR), Coimbatore, pp. 66-69, 7-8 Feb., 2013.
[14]Bedi S.S, Agarwal Jyoti, Agarwal Pankaj, “Image fusion techniques and quality assessment parameters for clinical diagnosis: A Review”, International journal of advanced research in computer and communication engineering Vol. (2), issue 2, pp. 1153-1157, February 2013.
[15]Sruthy, S., Latha Parameswaran, and Ajeesh P. Sasi. "Image Fusion Technique using DT-CWT", IEEE International Multi-Conference on automation, computing, control, communication & compressed sensing (iMac4S), Kottayam, pp. 160-164, 22-23 March, 2013.
[16]http://eoedu.belspo.be/en/guide/fusion.asp?section=3.11. 2
![Figure 1. Image fusion process [16]](https://thumb-us.123doks.com/thumbv2/123dok_us/8054348.774757/1.595.314.550.262.437/figure-image-fusion-process.webp)
![Figure 3. Image fusion using PCA [13] Steps involved in PCA Fusion are:](https://thumb-us.123doks.com/thumbv2/123dok_us/8054348.774757/2.595.56.275.499.691/figure-image-fusion-using-pca-steps-involved-fusion.webp)