Comparative Study on CBIR based on Color Feature
Hany Fathy Atlam
Computer science and Engineering Dept., Faculty of
Electronic Engineering, Menoufia University, Menouf,
32952, Egypt
Gamal Attiya
Computer science and Engineering Dept., Faculty ofElectronic Engineering, Menoufia University, Menouf,
32952, Egypt
Nawal El-Fishawy
Computer science and Engineering Dept., Faculty ofElectronic Engineering, Menoufia University, Menouf,
32952, Egypt
ABSTRACT
Content Based Image Retrieval (CBIR) system helps users to retrieve relevant images based on their contents. It finds images in large databases by using a unique image feature such as texture, color, intensity or shape of the object inside an image. This paper presents a comparative study between the feature extraction techniques that based on color feature. These techniques include Color Histogram, HSV Color Histogram and Color Histogram Equalization. In this study, the retrieval process is first done by measuring the similarities between the query image and the images within the WANG database using two approaches: Euclidean distance and correlation coefficients. Then, the comparison is carried out by measuring the accuracy, error rate and elapsed time of each technique.
Keywords:
CBIR, Feature Extraction, Image Retrieval, Similarity Matching, WANG database, Color Histogram.1. INTRODUCTION
Impression is more by an image rather than thousands of words, as stipulated by the statement "a picture is worth a thousand words". Nowadays, a huge number of images are generated and transmitted in digital format over the Internet, and there is variety of tools to access the digital images. However, when searching for an image from the web using the Google image search, the retrieved results cannot meet the user satisfaction. This is because, the images searching by Google is based on associated metadata such as keywords, text, etc.
Recently, Content Based Image Retrieval (CBIR) techniques are developed to avoid the use of textual descriptions [1-5]. These techniques retrieve desired images from a large collection of image database. In CBIR, retrieving of images are based on some features in their contents like textures, colors or shapes which are the low level features of the image [6].
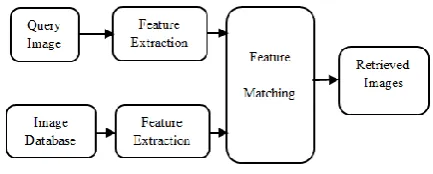
Figure 1 shows the block diagram of basic CBIR system. The CBIR involves two phases: feature extraction and feature matching. The first phase involves extracting the image features while the second phase involves matching these features. Briefly, the features of each image stored in the database is extracted and compared to the features of the query image. If the distance between feature vectors of the query
[image:1.595.319.536.288.375.2]corresponding image in the database is to be considered as a matched image to the query. The matched images are then ranked accordingly to a similarity index. Finally, the retrieved images are specified according to the highest similarity.
Fig 1: Block diagram of CBIR system
In this paper a comparative study is carried out on the CBIR techniques that based on color feature. The goal is to determine the most efficient feature extraction technique. In this study, the feature extraction process is done by using three algorithms: Color Histogram, HSV Color Histogram and Color Histogram Equalization. The retrieval process is first done by measuring the similarities between the query image and the images within the WANG database using two approaches: Euclidean distance and correlation coefficients. Then, the comparison is carried out by measuring the accuracy and error rate of each technique.
The rest of this paper is organized as follows. Section 2 presents an overview of related work. Section 3 briefly describes the Visual Feature Extraction techniques, section 4 briefly describes the Feature Matching Process, Section 5 discusses the experimental results, and finally Section 6 discusses the conclusion.
2. REVIEW OF LITERATURE
Content-based image retrieval, also known as query by image content or content-based visual information retrieval, is the application of computer vision to the image retrieval problem. That is, the problem of searching for digital images in large databases.
content-based image retrieval was proposed in the early 1990s [8, 9].
The CBIR is used in many different fields, in Biomedicine fields such as X-ray, CT, medical diagnosis and security filtering, art galleries, museums, personal album etc. Some successful applications of the CBIR include:
Texture segmentation and texture feature extraction. Fingerprints identification.
Iris recognition. Edge detection.
Directional image enhancement, image compression. Hierarchical image representation and recognition.
In Recent Years, several CBIR techniques have been done addressing different feature extraction techniques for image retrieval. In 2008, feature extraction techniques in CBIR using CT Brain image (gray scale image) were proposed in [10].
3
. FEATURE EXTRACTION TECHNIQUES
In this section, the main concern is to describe the CBIR techniques that based on the color feature in image retrieval. The color feature has been widely used in the CBIR systems; becausethe color is an intuitive feature and plays an important role in image matching. In this paper, the feature extractions techniques that will be considered are: Color Histogram, HSV Color Histogram and Color Histogram Equalization.
3.1 Color Histogram
Color is one of the most important features in CBIR. It is the most widely used for both human perception & computer vision. Image histogram is a graphical representation of an image. As we know image is a collection of pixels i.e. row and column, each pixel is associated to a specific histogram bin only on the basis of its own color, so the image histogram shows the proportion of pixels of each color within the image.
For the color histogram, the distribution of the number of pixels for each quantized bin can be defined for each component. Quantization in terms of color histograms refers to the process of reducing the number of bins by taking colors that are very similar to each other and putting them in the same bin.
The comparison between images (query image and images in the database) is accomplished through the use of some distance metric which determines the distance or similarity between the two histograms. The main advantage of histogram is variation in scale, rotation and translation of image [11, 12].
Figure 2 shows an example image for an elephant and its Histogram obtained by Color Histogram.
(a): an image (b): Histogram of the image Fig 2: elephant image and its Histogram
3.2 HSV Color Histogram
The representation of the colors in the RGB space is quite adapted for monitors, but for a human being, this is not a useful definition. To provide a user representation in the user interfaces, programmers prefer the HSV color space [13].
HSV Color Histogram is the acronym of Hue, Saturation and Value; this color histogram is the closest perception of the human eye. The human eye perceives colors by the excitation of two cells of the eye, which are rods and cones. “Excitation of the cone cells leads to perception of color, while rod cells help in perception of various shades of gray. The HSV color histogram separates the luminance component (Intensity) of a pixel color form its chrominance components (Hue and saturation).” This representation works as the human eye because it works like the separation of the rods and cones.
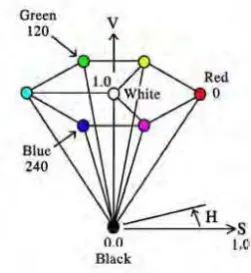
On the representation of the components for this histogram Hue represents the chromatic component; saturation represents the predominance value of a hue a color and Value represents the intensity of the color [14].
The generation of colors of the HSV color space is represented According to [15], Hue defines the color by changing its angle; hue is defined as an angle in the range [0, 2π]. Saturation is the depth or purity of the color and is measured as a radial distance from the central axis with value between 0 at the center to 1 at the outer space. Finally, value is represented by the vertical central axis. Figure 3 illustrate how HSV color histogram is represented.
3.3 Color Histogram Equalization
The Histogram Equalization spreads out intensity values along the total range of values in order to achieve higher contrast. This method is especially useful when an image is represented by close contrast values, such as images in which both the background and foreground are bright at the same time, or else both are dark at the same time [16].
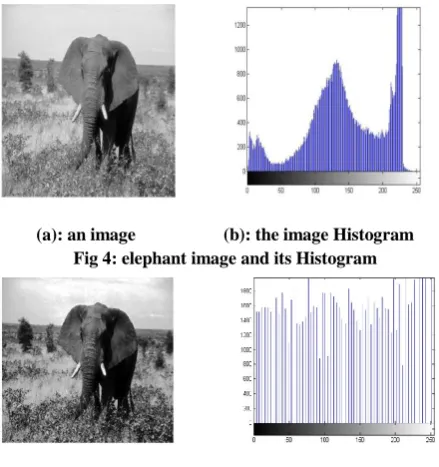
For example, the result of applying histogram equalization to the image in Figure 4 is presented in Figure 5. We can see that the image’s contrast has been improved. The original histogram has been stretched along the full range of gray values.
(a): an image (b): the image Histogram Fig 4: elephant image and its Histogram
[image:3.595.54.274.246.480.2]
(a): an image (b): the Histogram Equalization Fig 5: elephant image and its Histogram Equalization
4. FEATURE MATCHING PROCESS
The Similarity matching is the process of approximating a solution, based on the computation of a similarity function between a pair of images.
To retrieve the similar images from the large image database, two types of similarity matching algorithms like Histogram Euclidean distance and correlation coefficients are being used.
4.1 Histogram Euclidean distance
Let h and g represent two color histograms. The Euclidean distance between the color histograms h and g can be computed as [17]:
4.2 Correlation Coefficient (Cr)
The closeness between the original image and the modified one is measured by the correlation coefficient (Cr). In ideal case the Cr should be one.
Where: X is the query image, Y is the image from the database and n is the number of images in the database.
5. EXPERIMENTAL STUDY
5.1
Simulation Environment
The feature extraction algorithms and similarity matching methods are coded using MATLAB [18] on Intel(R) Core(TM) i5 CPU with 4GB RAM running Windows 7 and several experiments are carried out to evaluate the performance of the system.
In our experiments, The WANG database which is a standard database is being used to evaluate the performance of the system. The WANG database is a subset of the Corel database of 1000 images which have been manually selected to be a database of 10 categories of 100 images each. The images are of the size 256 x 384.
The images are subdivided into 10 categories (African People, Beach, Buildings, Buses, Dinosaurs, Elephants, Flowers, Horses, Mountains and Foods) such that it is almost sure that a user wants to find the other images from a category if the query is from one of these 10 categories. This is a major advantage of this database because due to the given classification it is possible to evaluate retrieval results.
One example of each category can be seen in Figure 6. This database was used extensively to test the different features because the size of the database and the availability of class information allows for performance evaluation [19, 20].
[image:3.595.313.534.563.651.2]5.2 Performance Evaluation
The performance of the system can be evaluated by using a set of parameters such as [21, 22]:
5.2.1 Time
It is the time taken in seconds for the retrieval task to complete, at the end of which the system returns the images which are matched with the features of the query images, according to the technique used.
5.2.2 Accuracy
Accuracy of an image retrieval task is defined as the ratio of the number of relevant images retrieved to the total number of images retrieved expressed in percentage.
5.2.3 Error rate
Error rate of an image retrieval task is defined as the ratio of the number of irrelevant images retrieved to the total number of images retrieved expressed in percentage.
5.3
Results
To evaluate the performance of each Feature Extraction algorithm the following steps will be carried out:
1. Select five images from each category as a query images.
2. For each retrieval, the most similar 20 images are selected as retrieval results
3. Compute the accuracy, the error rate and the elapsed time for the 5 query images.
4. Compute the average accuracy, the average error rate and the average execution time of the 5 retrievals.
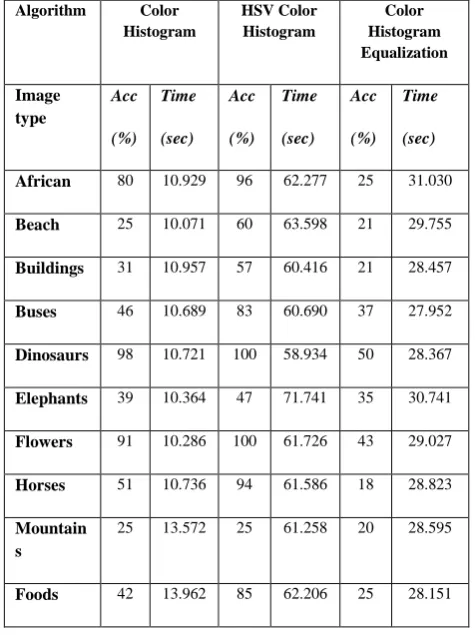
Table 1 shows the average retrieval accuracy and the average retrieval time that result from applying the three feature extraction algorithms on the WANG database using the Euclidean distance as a Feature similarity measure.
[image:4.595.310.548.106.424.2]The experimental results show that the HSV color histogram and color histogram algorithm gives the best retrieval accuracy but with different execution time.
Table 1: Comparison between the three Feature Extraction algorithms
Algorithm Color Histogram
HSV Color Histogram
Color Histogram Equalization
Image type
Acc
(%) Time
(sec) Acc
(%) Time
(sec) Acc
(%) Time
(sec)
African 80 10.929 96 62.277 25 31.030
Beach 25 10.071 60 63.598 21 29.755
Buildings 31 10.957 57 60.416 21 28.457
Buses 46 10.689 83 60.690 37 27.952
Dinosaurs 98 10.721 100 58.934 50 28.367
Elephants 39 10.364 47 71.741 35 30.741
Flowers 91 10.286 100 61.726 43 29.027
Horses 51 10.736 94 61.586 18 28.823
Mountain s
25 13.572 25 61.258 20 28.595
Foods 42 13.962 85 62.206 25 28.151
Figure 7 shows an example of the retrieval result using the Color Histogram Algorithm and the query image belongs to the buses category from the Wang database.
[image:4.595.323.541.488.628.2]Figure 8 shows an example of the retrieval result using the HSV Color Histogram Algorithm and the query image belongs to the Dinosaurs category from the Wang database.
Fig 8: Example of Retrieval of images using HSV Color Histogram
Figure 9 shows an example of the retrieval result using the Color Histogram Equalization Algorithm and the query image
[image:5.595.312.545.104.425.2]belongs to the Elephants category from the Wang database.
Fig 9: Example of Retrieval of images using Color Histogram Equalization
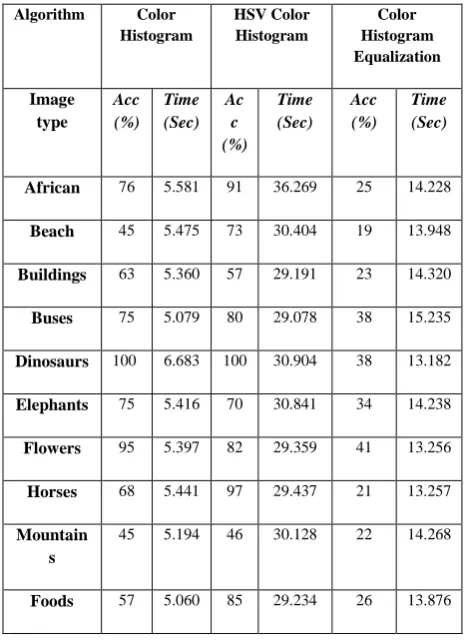
Table 2 shows the average retrieval accuracy and average retrieval time that results from applying the three feature extraction algorithms on the WANG database and using a correlation ratio (Cr=0.85) as a Feature similarity measure.
Table 2: Comparison between the three Feature Extraction algorithms
Algorithm Color Histogram
HSV Color Histogram
Color Histogram Equalization
Image type
Acc (%)
Time (Sec)
Ac c (%)
Time (Sec)
Acc (%)
Time (Sec)
African 76 5.581 91 36.269 25 14.228
Beach 45 5.475 73 30.404 19 13.948
Buildings 63 5.360 57 29.191 23 14.320
Buses 75 5.079 80 29.078 38 15.235
Dinosaurs 100 6.683 100 30.904 38 13.182
Elephants 75 5.416 70 30.841 34 14.238
Flowers 95 5.397 82 29.359 41 13.256
Horses 68 5.441 97 29.437 21 13.257
Mountain s
45 5.194 46 30.128 22 14.268
Foods 57 5.060 85 29.234 26 13.876
The experimental results show HSV Color Histogram algorithm gives the best retrieval accuracy.
Figure 10 shows an example of the retrieval result using the Color Histogram Algorithm and the query image belongs to
the Flowers category from the Wang database
.
Fig 10: Example of Retrieval of images using Color Histogram
[image:5.595.56.278.121.268.2] [image:5.595.62.286.364.518.2] [image:5.595.326.548.531.675.2]Fig 11: Example of Retrieval of images using HSV Color Histogram
Figure 12 shows an example of the retrieval result using the Color Histogram Equalization Algorithm and the query image belongs to the Food category from the Wang database.
Fig 12: Example of Retrieval of images using Color Histogram Equalization
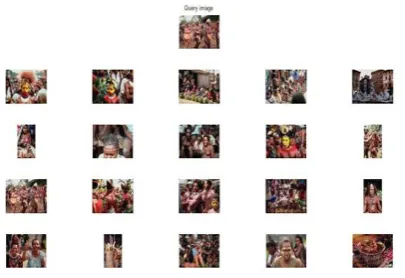
Figure 13 shows the average Retrieval accuracy of the three
feature extraction techniques with Euclidean distance and correlation coefficients as a similarity measure. [image:6.595.62.265.70.209.2]It’s clear that Correlation coefficient gives the best average retrieval accuracy with the three feature extraction algorithms.
Fig 13: average Retrieval Accuracy with similarity measure
Figure 14 shows the average Retrieval time of the three feature extraction techniques with Euclidean distance and correlation coefficients as a similarity measure.
[image:6.595.321.536.164.291.2]Although the Color Histogram algorithm gives the best retrieval time with both Euclidean distance and correlation coefficient but the retrieval accuracy is low.
Fig 14: average Retrieval time with similarity measure
6. CONCLUSION
In this paper, a comparative study had been carried out on three feature extraction techniques that based on color feature. Each technique is applied to retrieve images from the WANG database. The comparison is done by measuring the accuracy, the error rate and the elapsed time. The Experimental results show that the HSV Color Histogram is the most efficient feature extraction technique. Indeed, the correlation coefficient is the best feature similarity measure method.
7. REFERENCES
[1] D. Feng, W. C. Siu, and H. J. Zhang, “Fundamentals of Content-Based Image Retrieval”, Multimedia Information Retrieval and Management—Technological Fundamentals and Applications,New York:Springer ,2003.
[2] V. N. Gudivada and V. V. Raghavan, “Content based image retrieval systems”, IEEE Computer, vol. 28, Sept. 1995.
[3] G. Pass and R. Zabih, “Histogram refinement for
content-based image retrieval,” in 3rd IEEE Workshop on Applications of Computer Vision, pp. 96–102,1996.
[4] L. Cinque, S. Levialdi, and A. Pellicano, “Color-based
image retrieval using spatial-chromatic histograms,” in IEEE Int. Conf. Multimedia Computing and Systems, pp. 969–973,1999.
[5] D. Ashok Kumar and J. Esther, “Comparative Study on CBIR based by Color Histogram Gabor and Wavelet Transform”, International Journal of Computer Applications, Vol. 17, No. 3, March 2011.
[6] N. S. Chang and K.S.Fu, “Image Query by Pictorial
Example,” IEEE Trans. Software Engineering, 1980.
[image:6.595.59.280.309.448.2] [image:6.595.55.279.571.686.2]Visual Commun, Image Representation”, pp. 39–62, 1999.
[8] A.W.M. Smeulders, “Content-based image retrieval at the
end of the early years”, IEEE Trans. Pattern Anal. Mach. Intel, Vol. 22, pp. 1349–1379, 2000.
[9] Wan Siti Halimatul Munirah Wan Ahmad and Mohammad Faizal Ahmad Fauzi, “Comparison of Different Feature Extraction Techniques in Content- Based Image Retrieval for CT Brain images”, Multimedia Signal Processing, IEEE 10th Workshop on, pp. 503 – 508,2008.
[10] Manimala Singha and K.Hemachandran, “Content Based
Image Retrieval using Color and Texture”, Signal & Image Processing: An International Journal (SIPIJ), Vol. 3, No. 1, February 2012.
[11] D.A. Kumar and J. Esther, “Comparative Study on CBIR
based by Color Histogram, Gabor and Wavelet Transform”, Vol. 17, No.3, pp. 37-44, March 2011.
[12] R. Chakarvarti and X. Meng, “A Study of Color
Histogram Based Image Retrieval”, Information Technology: New Generations, ITNG '09. Sixth International Conference on, pp. 1323-1328,2009.
[13] Youngeun an and Muhammad Riaz and Jongan Park, “CBIR based on adaptive segmentation of HSV color space” 12th International Conference on Computer Modelling and Simulation, 2010.
[14] J. Miralles, Tutorial de GIMP. [Online]. Available: http: //sites.google.com/site/tutorialdegimp/011---teoria-del-color-for%macion-y-mezcla-de-colores –rgb y-cmyk.
[15] A. Vadivel, S. Sural, and A. Majumdar, “Human color
perception in the HSV space and its aplication in histogram generation for image retrieval,” in SPIE Procedings seetings, San José CA,United States of America, 2005.
[16] P.B Thawari,N.J janwe,”CBIR Based on Color and
Texture”, International Journal of Information Technology and Knowledge Management,Vol.4,No.1,pp. 129-132,june 2011
[17] Liwei Wang, Yan Zhang, and Jufu Feng. “On the
Euclidean Distance of Images”, IEEE TRANSACTIONS ON PATTERN ANALYSIS AND MACHINE INTELLIGENCE, VOL. 27, NO. 8, AUGUST 2005.
[18] MATLAB—the language of technical computing, http://www.mathworks.com/products/matlab/index.html
[19] J. Li, J.Z. Wang, “Automatic linguistic indexing of
pictures by a statistical modeling approach”, IEEE Transactions on Pattern Analysis and Machine Intelligence, Vol. 25, No. 9, pp. 1075-1088, 2003.
[20] Wang's dataset http://wang.ist.psll.edll/
[21] Aman Chadha,Sushmit Mallik and Ravdeep Johar,” Comparative Study and Optimization of Feature Extraction Techniques for Content based Image Retrieval”, International Journal of Computer Applications Vol. 52– No.20, August 2012.
[22] S. Manimala and K. Hemachandran, “Image