Modeling Water Infiltration and Solute
Transfer in a Heterogeneous Vadose
Zone as a Function of Entering Flow Rates
Erij Ben Slimene
1,2, Laurent Lassabatere
1, Thierry Winiarski
1, Remy Gourdon
21Laboratoire d’Ecologie des Hydrosystèmes Naturels et Anthropisés (LEHNA), ENTPE, Vaulx-en-Velin, France 2Laboratoire de Génie Civil et d’Ingénierie Environnementale-Déchets, Eau, Environnement et Pollutions
(LGCIE-DEEP), INSA Lyon, Villeurbanne, France Email: [email protected]
Received 7 August 2015; accepted 8 September 2015; published 11 September 2015
Copyright © 2015 by authors and Scientific Research Publishing Inc.
This work is licensed under the Creative Commons Attribution International License (CC BY). http://creativecommons.org/licenses/by/4.0/
Abstract
Keywords
Numerical Modeling, Preferential Flow, Solute Transfer, Infiltration Basin, Vadose Zone
1. Introduction
Large cities are mostly situated in areas close to water resources in order to meet the water needs of their popu-lations. Alluvial soils harbor large aquifers that are used to supply water. The Rhone-Alpes region is a good illu-stration of it. However, the increase of soil sealing has led to the development of the best management practices such as infiltration basins aimed at infiltrating storm water in order to reduce the amount of collected and treated water in usual systems. Yet, these infiltration basins are mainly settled over highly permeable geologic forma-tions so as to ensure water infiltration and thus better pollutant retention. Most of these formaforma-tions are strongly heterogeneous, since they are made of different materials with contrasting sedimentological properties (e.g. par-ticle size distribution) and transfer properties [1]-[3].
Soil heterogeneity is responsible for the difficulty in predicting mass movement. For example, it often results in faster mass movement than would be expected from the soil matrix properties [4] [5]. This movement is asso-ciated with PF that denotes water and solute transport through a small portion of a soil volume receiving input over its entire inlet boundary. Transport along PF paths can cause water and chemicals to move more rapidly and reach greater depths than predicted by models, i.e. the Richards equation. PF can occur in macropores [6], as finger flow [7], as funnel flow [8] or in water repellent soils [9]. There have been several studies of PF in soils during the last 30 years [10] [11]. As a result, PF is now routinely included in models that predict water, solute and particle transport in soils [12].
Most modelling approaches for flow and solute transfer rely on the use of darcean approach, i.e. assuming that flow is ruled by the Darcy Buckingham Law [13]. In such a case, unsaturated water flow in the vadose zone is modeled considering the Richards equation, written as follows, considering no source/sink terms:
ij iz
i j
h
K K
t x x
θ
∂ = ∂ ∂ +
∂ ∂ ∂ (1)
where h stands for the pressure head, θ is the volumetric water content, xi, xj are the spatial coordinates, t is time,
and Kij are components of the unsaturated hydraulic conductivity tensor. We assumed the soil in each layer to be
isotropic, with both entries Kxx and Kzz, equal to the unsaturated hydraulic conductivity function, K(h). Soil water
retention and hydraulic curves are characterized by the van Genuchten-Mualem formulation [14]:
( )
(
)
(
1)
m n r s r
h h
θ =θ + θ θ− +α − (2)
( )
( )
(
(
1)
)
21 1 m
l m
s r s e e
K h =K K h =K S − −S (3) where θr and θs denote the residual and saturated water contents, respectively; Ks and Kr are the saturated and
relative hydraulic conductivities, respectively; hg = 1/α is the scale parameter of water pressure heads, n is a
pore-size distribution index, l is a pore-connectivity parameter, and m = 1 − 1/n.
Solute transfer is often modeled considering the Convection-Dispersion Equation (CDE). This equation as-sumes that solutes are transported through convection and dispersion in the liquid and may be retained in the soil through sorption onto solid particles [13]:
d i
ij
i j i
S q C
C C
D
t t x x x
ρ
θ ∂ θ ∂
∂ + = ∂ ∂ −
∂ ∂ ∂ ∂ ∂ (4)
where C stands for the liquid concentrations and S for the sorbed concentrations, Dij is the dispersion tensor,
de-scribed as well by the longitudinal and transversal dispersion coefficients, DL and DT, respectively, which
0
L L
q
D λ τD
θ
= + (5)
0
T T
q
D λ τD
θ
= + (6)
where λL and λT are the medium longitudinal and transversal dispersivities, τ isthe medium tortuosity, and D0 is
the solute molecular diffusion coefficient. Concerning pollutant retention, sorption is assumed to be instantane-ous, kinetically limited mechanisms being the focus of further research. The total sorbed concentration, S, is de-scribed as a function of the liquid concentration, C, with the following general expression [15]:
1 d C S K C β β η =
+ (7)
where Kd, β and η are empirical coefficients that can be estimated from experimental sorption isotherms [16].
For some pollutants, and especially for organic pollutants, sorption isotherms may be linear and the estimation of Kd may be the sole parameter required for modeling solute transfer.
These flow and solute equations can be adapted to account for preferential flow and solute transfer [17] [18]. Preferential flow (PF) can be seen as uneven and rapid movement of water and solutes through restricted zones of the porous media (e.g. cracks, wormholes, etc.), with slow or even negligible movement of water and solutes elsewhere [17]. In this case, differential equations can be changed to consider the concomitancy of fast flow along preferential pathways and pockets of stagnant water. Solutes undergo convection and dispersion along the main stream with solute diffusion between the “mobile” water and stagnant water pockets [19]. These equations are applied at porous medium scale (i.e. at the centimeter-meter scale); the porous medium is described as a set of representative elementary volumes (REV). At larger scales, the ground may exhibit an additional spatial he-terogeneity of transfer properties, specifically for deposits that are constituted of several lithofacies. When processes need to be described at larger scales (decameter or larger), the lithological heterogeneity of the ground or the deposit must be accounted for, and the ground has to be considered as an assemblage of several materials, each requiring a proper description of its transfer properties [3]. The combination of these two types of hetero-geneity, including the intrinsic heterogeneity related to each material (potential macropores, cracks, etc.) and the lithological heterogeneity resulting from the architecture of the deposit, is a real challenge. Studying the impact of the lithological heterogeneity is a prerequisite to the understanding of flow and mass transfer in heterogene-ous vadose zones.
This paper addresses flow and solute modeling during the infiltration phase in the vadose zone of the hetero-geneous deposit of Lyon area. In particular, we want to pinpoint numerically the influence of lithological hete-rogeneity on the establishment of PF and mass transfer. We also want to identify the hydric and hydraulic condi-tions (mostly entering flow rates) that are favorable to PF and mass transfer. For this purpose, the proposed nu-merical model is based on several studies that propose a complete sedimentological description of the deposit architecture and lithofacies along with their hydraulic properties [1]-[3]. Considering these data, water infiltra-tion and solute transfer were modeled for two imposed flux values. Preliminary studies focused on numerical options and mesh optimization with regards to both accuracy and computation time. Data derived from these tests were used in the proposed study. Then, a sensitivity analysis addressed the role of the deposit architecture and boundary conditions (entering flow rate) in the establishment of PF. For flow, the time required reaching steady state over the whole soil profile, wetting fronts, water fluxes during transient state and water fluxes at steady state were accurately characterized and compared to those of a uniform section. Solute transfer was in-vestigated at steady state for a tracer and two reactive solutes with two different distribution coefficients (para-meter Kd, in Equation (7)). Then, the influence of lithological heterogeneity on entering flow rate was discussed.
2. Material and Methods
2.1. Study Site
(a) (b)
Figure 1.Geological settings of the region of Lyon (a) and location of the study site area (b) according to [3].
[3]. This basin, covering 13,775 m2, receives runoff storm waters from an urban and industrialized watershed of 185 ha in surface area [1] [2] [20]-[22]. The depth of the unsaturated zone under the infiltration basin is 13 m. This site is instrumented by the field observatory for urban water management
(http://www.graie.org/othu/).
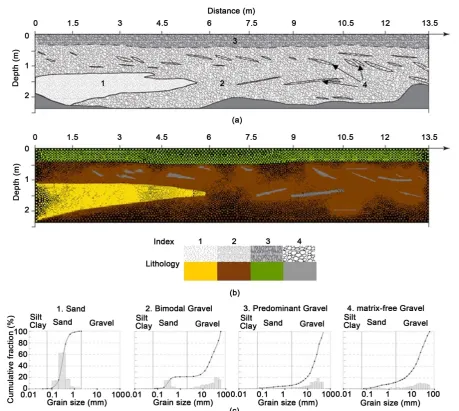
To characterize the lithological properties of the deposit, a trench of a length of 13.5 m and a height of 2.5 m has been mechanically excavated and is depicted in Figure 2(a) [2]. This profile was the subject of a detailed li-thographic description [1] [2]. The studied trench was composed of four structural units made of four main ma-terials. Referring to particle size distribution (cumulative fraction and frequency), we can distinguish in Figure 2(c) the following materials: (1) a poorly-sorted to moderately sorted medium sand with a grain size of 0.40 ± 0.21 mm, (2) a bimodal mixture of fine to medium sand and medium to coarse gravel, (3) a mixture of sandy matrix and gravel with a gravel fraction of 85%, and (4) a poorly sorted to moderately well sorted matrix-free gravel. These materials are referred to as sand, bimodal gravel, gravel, and matrix-free gravel, respectively. The gravel forms the upper layer, around 50 - 70 cm thick, and results from the blending of all original lithofacies by mechanic engines while monitoring the basin and removing the upper layer. The bimodal gravel makes up most of the deposit (Figure 2). Matrix-free gravel and sand form inclusions into the bimodal gravel (Figure 2). Briefly, the architecture of the deposit is characterized by stratification with two blocks, namely the upper layer and the bimodal gravel with its inclusions (sand lens and free-matrix gravel).
2.2. Modeling: Numerical Options
Modeling was performed using the HYDRUS program [15]. This code is a finite element model for simulating the movement of water, heat, and multiple solutes in variably saturated media. The program numerically solves the Richards equation as based on the Darcy-Buckingham law and mass conservation [23] for saturated-unsatu- rated water flow and Fickian-based advection dispersion equations for heat and solute transport. Additional models were also implemented to account for PF [23]. In this study, HYDRUS was used to solve Equations (1-7) for the specific scenarios detailed below.
The trench was represented by a 2D flow domain of 13.5 m in length and 2.5 m in depth meshed through tri-angular elements with 200,000 as maximum number of nodes. All materials were geometrically represented ac-cording to the sedimentary description of the trench.Figure 2(b)illustrates the numerical domain that mimics the real deposit (Figure 2(a)). In order to spotlight the effect of heterogeneity, a uniform profile was built con-sidering only the bimodal gravel that constitutes the major part of the deposit.
Figure 2. Lithological description (a); mesh and material distribution implemented in HYDRUS (b); and particle size distri-bution (cumulative fraction and frequency) of the four main lithofacies (c).
hydric conditions close to saturation. Drainage and water redistribution were then modeled by imposing a zero flux at surface for one week (168 h). Water pressure heads obtained at the end of this drainage phase were con-sidered as typical values encountered before rainfall events. These water pressure heads were then implemented as initial conditions into the modeling of the rainfall events. For hydraulic properties, each material was assigned the values proposed by [1] [2] who determined these values by infiltrometry (BEST method) [24] and by Arya and Paris method [25] for the coarser material (matrix-free gravel). Hydraulic parameters are listed inTable 1.
For solutes, we considered a third-type boundary. This kind of boundary condition controls solute concentra-tions and the quantity of solute that enters or exits the domain by mass balance consideraconcentra-tions. For initial condi-tion, we considered a zero value over the whole numerical domain. Solutes were injected at 1 L∙g−1 which cor-responds to the order of concentrations of major elements. Model solutes were considered with one tracer with no reactivity (Kd = 0) and two reactive solutes with adsorption coefficients of Kd = 10−4 L∙g−1 and Kd = 10−3 L∙g−1.
These values are in the range between non-reactive solutes and values obtained for reactive solutes like copper in the same lithofacies [3]. The comparison of the results for reactive and non-reactive solutes permits the iden-tification of the separate effects convection, dispersion and retention. Finally, in agreement with previous studies
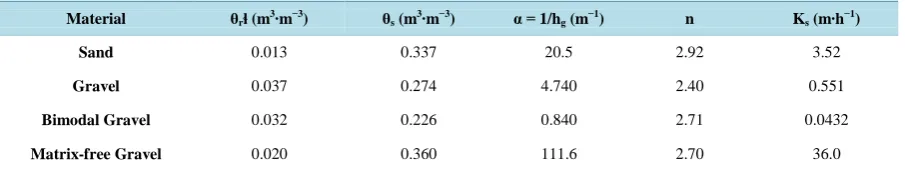
Table 1. Hydraulic parameters for Van Genuchten–mualem model.
Material θrɬ (m3∙m−3) θs (m3∙m−3) α = 1/hg (m−1) n Ks (m∙h−1)
Sand 0.013 0.337 20.5 2.92 3.52
Gravel 0.037 0.274 4.740 2.40 0.551
Bimodal Gravel 0.032 0.226 0.840 2.71 0.0432
Matrix-free Gravel 0.020 0.360 111.6 2.70 36.0
ɬθr and θs (m3∙m−3) denote the residual and saturated water contents, respectively; Ks (m∙h−1) the saturated hydraulic conductivity; α (m−1) the scale
parameter for water pressure head, n (−) the pore size distribution index and l the pore connectivity parameter (l = 0.5).
3. Results
3.1. Effect of Heterogeneity on Water Flow
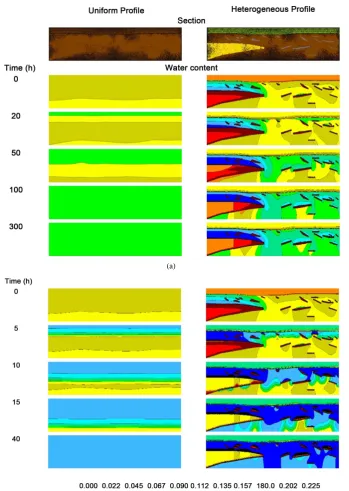
The evolution of volumetric water content is presented as a function of time for the two entering flow rates im-posed on the top of the two profiles described above. In Figure 3, the evolution of water content is illustrated for two contrasted profiles: uniform (left) and heterogeneous (right).
In case of low velocity (Figure 3(a)), it is clear that in the uniform profile, water moves down to the low boundary condition along horizontal isolines, revealing a piston type infiltration. Wetting front progression can be assimilated to plug flow. In opposite, in heterogeneous sections, the geometry of the wetting fronts is influ-enced by inclusions. Indeed, water contents remain low in the sand lens and matrix-free gravel due to their lower water retention capacities. This results in a drastic drop in hydraulic conductivity and leads to flow deviations at their interfaces with the predominant bimodal gravel. There is a significant regionalization of flow and a patent barrier effect. This is usually explained by the fact that the fine-grained material overlay a coarse-grained ma-terial. The matrix potential at the textural interface is then so low that water cannot enter the coarser soil [26] [27]. PF caused by capillary barriers is often referred to as funneled flow [28]. In the studied case, such a flow pattern results also from the drainage phase. At the beginning of drainage, the whole section is saturated. Under this condition, the conductivity of bimodal gravel is low compared to other materials, and thus drains more slowly. Conversely, sand drains faster, leading to lower water contents (Figure 3(a)). Once unsaturated, sand lens will present a hydraulic conductivity lower than that of bimodal gravel and will therefore limit the infiltra-tion, promoting water retention above and deviating flowaway. Matrix-free gravel also has the same capillary barrier effect, but this effect is more localized. This induces funneled flow.
In case of high entering flow rate (Figure 3(b)), the wetting front progression is more rapid. But, the same pattern is observed with a plug flow in the homogeneous profile and a funneled flow in the heterogeneous sec-tion. Yet, PF becomes less marked than for the lower entering flow rate. In particular, after 10 h infiltration (Figure 3(b)), water starts infiltrating the sand lens but keeps on avoiding inclusions. Under these conditions, sand, which used to form a capillary barrier, exhibits a higher hydraulic conductivity, becoming more and more permeable. Sand lens loses its capillary barrier effect. Conversely, the matrix-free gravel keeps its capillary ef-fect and remains impermeable, thus forcing water to avoid it.
Clearly, these results show that the lithological heterogeneity induces a modification of flow pattern by lead-ing to funneled flow. Such a flow pattern results from the more intense drainage of the sand lens and the ma-trix-free gravel during the drainage phase, which results in lower water content and hydraulic conductivity dur-ing the subsequent infiltration phase. This impact is enhanced for the lower enterdur-ing flow rate, since this keeps the sand and the matrix-free gravel in a drier state, thus favoring the capillary barrier effect.
(a)
[image:7.595.141.491.81.573.2](a)
Figure 3. Time evolution of the volumetric water content, calculated with HYDRUS for the two imposed velocities: 1.5 mm∙h−1(a) and 15 mm∙h−1 (b).
(a) (b)
Figure 4.Boundary flux at 2.5 m depth (groundwater recharge) for the imposed velocity of 1.5 mm∙h−1(a) and 15 mm∙h−1
(b); data for the uniform (solid line) and heterogeneous profile (dashed line). (a) Low velocity; (b) High velocity.
Figure 5. Velocity vectors field at steady state time for the imposed velocity of 1.5 mm∙h−1 (a) and 15 mm∙h−1 (b), calculated with HYDRUS for uniform profile (left) and heterogeneous profile (right); steady state times are 300h and 40 h, respectively.
3.2. Effect of Heterogeneity on Solute Transfer
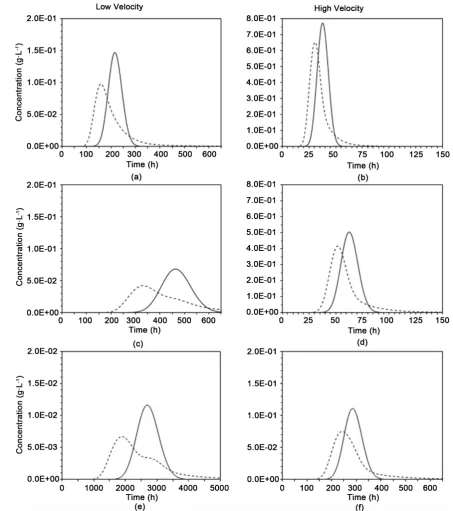
Lithological heterogeneity markedly impacts the tracer breakthrough curves (BTC). For instance, at low entering flow rate (Figure 6(a)), we can notice the significant impact of PF on the tracer BTC with a faster breakthrough (around 75 h of outdistance) and a more important tail, in opposite to the symmetric and narrow peak for tracer BTC in the uniform profile. This asymmetry of tracer BTCs, typical for PF, reveals that some solutes arrive ear-lier (between 100 h and 150 h) and others stay longer in the section (exit between 300h and 450h). The conco-mitancy of PF pathways and stagnant zones explains such a pattern. The solutes that will pass through the PF pathways will have a short residence time and will exit early. On the contrary, the solutes that undergo diffusion between fast flow and stagnant zone will be delayed and exit later.
Similar trends were obtained at the high entering flow rate with a more asymmetric tracer BTC in the hetero-geneous profile (Figure 6(b)). Yet, the discrepancy between the BTCs is less marked. This results from the fact that flow pattern is much more heterogeneous at low than at high flow rate. With more numerous and faster PF pathways, flow field is strongly heterogeneous (Figure 5) and impacts drastically tracer BTCs.
Reactive solutes are transferred similarly to the tracer apart from the fact that they are trapped in the soil and consequently, their residence times are longer. Thus, reactive solutes are delayed in comparison with the tracer (Figures 6(c)-(e)versusFigure 6(a)). Solute reactivity highlights the effect of PF on BTCs. The higher Kd the
Figure 6.Solute concentration at 2.5 m depth for different adsorption coefficients Kd, for the imposed velocity of 1.5 mm∙h−1
(left) and 15 mm∙h−1 (right); data for the uniform (solid line)and the heterogeneous profile (dashed line). (a) Tracer; (b)
Tracer; (c) Kd = 1E−4 L∙g−1; (d) Kd = 1E−4 L∙g−1; (e) (c) Kd = 1E−3 L∙g−1; (f) Kd = 1E−3 L∙g−1.
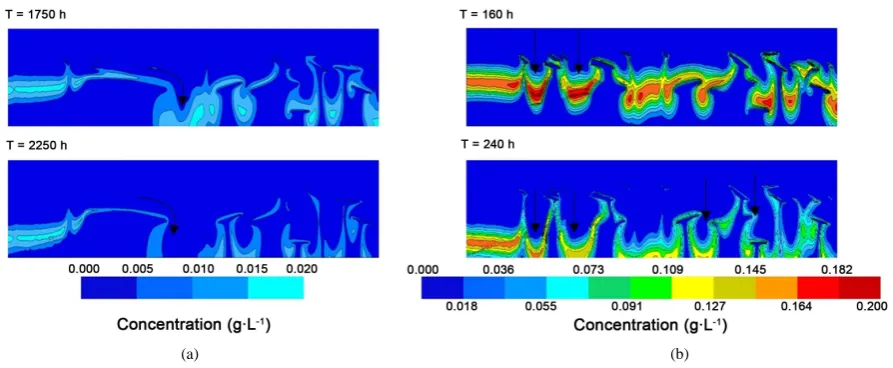
(a) (b)
Figure 7. Concentration distribution in the heterogeneous profiles, calculated with HYDRUS for two imposed surface veloc-ities 1.5 mm∙h−1 (a) and 15 mm∙h−1 (b) for anadsorption coefficient of Kd = 1E−3 L∙g−1. (a) Low velocity; (b) High velocity.
4. Discussion
Obtaining more patent PF for the lowest input flow rates seems counterintuitive. Indeed, it is usually considered that PF takes place at high pressure when highly conductive areas are activated due to high water pressure heads. This conceptual model is convenient to some configurations such as macropores or fractured soils. In this case, the soil is constituted of a matrix with a macropore and crack network. The activation of the crack and macro-pore network occurs when water pressure head is high enough to fill the network with water. This generates a PF.
In the studied case, the water pressure heads are not high enough to activate the most draining materials (i.e.
the sand and the matrix-free gravel). The averaged water pressure heads are small enough to induce lower hy-draulic conductivity for the sand and the matrix-free gravel in comparison with the main lithofacies (gravel). The inclusions of sand and gravel act as less permeable inclusions. This leads to the development of the capil-lary barriers observed. In fact, following the drainage phase, the most permeable materials (i.e. the sand and the gravel-free matrix) desaturate completely due to their low water retention capacity. The surrounding matrix be-comes thus more conductive and serves as a transfer medium. The in clusions only induce a local deflection of flows. When these inclusions are slightly larger (e.g., sand lens), the deviation is large enough to induce a fun-neled flow without a true by pass of the matrix.
PF generates a typical pattern for solute transfer. It is obvious that PF allows some of the solutes to pass through the whole section quite quickly. This reduces the chance of these solutes to be trapped by the soil and disfavors their retention. This assumption has been demonstrated at several scales and using field observations
[11] or laboratory column experiments [29] [30]. A more homogenous flow means more pores accessible to flow and solutes. The increase in access to pores warranties the access of solutes to reactive surfaces of the pore walls. In addition, the increase in the water volume involved by flow means a decrease in pore velocity and thus an increase of the contact time between pollutants and the reactive surfaces of particles. These hypotheses are in full agreement with previous studies that pointed out an improvement of retention in relation with flow homo-geneity for pollutants [18]-[29]. Clearly, the homogeneity of flow must be targeted for an optimum retention of pollutant by the soil.
5. Conclusions
coefficients were also tested and compared to a tracer behavior. The numerical study revealed that lithological heterogeneity clearly favored PF, mostly at low input flow rates. Paradoxically, low input flow rate or dry hydric conditions are most conducive to the establishment of PF. Indeed, pressure head must be low enough to make the hydraulic conductivity of the most draining materials drop below that of the surrounding matrix. This sudden hydraulic conductivity decrease induces capillary barrier effects. Indeed, sand lens and matrix-free gravel lenses were the sources of capillary barrier effects, leading to a funneled flow and a strongly heterogeneous flow field. Lithological heterogeneity also affected the recharge of groundwater with earlier and more dispersed wetting fronts. Considering distribution coefficient, PF affects more the transfer of reactive solutes.
These results suggest that unsaturated flow favors PF, mostly for low water fluxes imposed at surface. That corroborates the conclusions made by other researches, which confirmed that PF was more likely to perform under unsaturated conditions, influencing relevantly pollutant transfer by enhancing retention far from PF zones
[3]-[31]. That can explain specific soil pollution pattern with pollutant accumulation at surface along with pol-lutant concentration at specific locations far from surface, as already observed for several heavy metals in a stu-died infiltration basin [20]. These data are of great interest since they allow generating a conceptual and numer-ical model to better understand and predict the development of PF and its impact on pollutant transfer in highly heterogeneous deposits. These results can give indicative advice about the monitoring of infiltration basins. For instance, the fact that that PF is more important under unsaturated conditions and at low flow rates means that additional precautions must be considered for these conditions regarding soil and groundwater pollution under-neath infiltration basins.
Acknowledgements
The authors are grateful to the field observatory for urban water management (OTHU), Greater Lyon, Rhone- Mediterranean and Corsica water agency, Rhone-Alpes Region and the French Ministry of Ecology (GESSOL research program) for their logistic and financial support.
References
[1] Goutaland, D. (2008) Hydrogeophysical Characterization of a Glaciofluvial Deposit: Assessment of the Effect of Hy-draulic Heterogeneity on Flow in the Vadose Zone. PhD Thesis, INSA-Lyon, Villeurbanne.
[2] Goutaland, D., Winiarski, T., Lassabatere, L., Dubé, J.S. and Angulo-Jaramillo, R. (2013) Sedimentary and Hydraulic Characterization of a Heterogeneous Glaciofluvial Deposit: Application to the Modeling of Unsaturated Flow. Engi-neering Geology, 166, 127-139. http://dx.doi.org/10.1016/j.enggeo.2013.09.006
[3] Winiarski, T., Lassabatere, L., Angulo-Jaramillo, R. and Goutaland, D. (2013) Characterization of the Heterogeneous Flow and Pollutant Transfer in the Unsaturated Zone in the Fluvio-Glacial Deposit. Procedia Environmental Sciences, 19, 955-964. http://dx.doi.org/10.1016/j.proenv.2013.06.105
[4] de Rooij, G.H. (2000) Modeling Fingered Flow of Water in Soils Owing to Wetting Front Instability: A Review. Journal of Hydrology, 231-232, 277-294. http://dx.doi.org/10.1016/S0022-1694(00)00201-8
[5] Lin, H. and Zhou, X. (2008) Evidence of Subsurface Preferential Flow Using Soil Hydrologic Monitoring in the Shale Hills Catchment. European Journal of Soil Science, 59, 34-49. http://dx.doi.org/10.1111/j.1365-2389.2007.00988.x
[6] Beven, K. and Germann, P. (1982) Macropores and Water Flow in Soils. Water Resources Research, 18, 1311-1325. http://dx.doi.org/10.1029/WR018i005p01311
[7] Glass, R.J., Steenhuis, T.S. and Parlange, J.-Y. (1989) Wetting Front Instability: 2. Experimental Determination of Re-lationships between System Parameters and Two-Dimensional Unstable Flow Field Behavior in Initially Dry Porous Media. Water Resources Research, 25, 1195-1207. http://dx.doi.org/10.1029/WR025i006p01195
[8] Kung, K.-J.S. (1990) Preferential Flow in a Sandy Vadose Zone: 1. Field Observation. Geoderma, 46, 51-58.
[9] Ritsema, C.J., Dekker, L.W., Hendrickx, J.M.H. and Hamminga, W. (1993) Preferential Flow Mechanism in a Water Repellent Sandy Soil. Water Resources Research, 29, 2183-2193. http://dx.doi.org/10.1029/93WR00394
[10] Clothier, B.E., Green, S.R. and Deurer, M. (2008) Preferential Flow and Transport in Soil: Progress and Prognosis. European Journal of Soil Science, 59, 2-13. http://dx.doi.org/10.1111/j.1365-2389.2007.00991.x
[11] Flury, M. and Flühler, H. (1994) Brilliant Blue FCF as a Dye Tracer for Solute Transport Studies—A Toxicological Overview. Journal of Environmental Quality, 23, 1108-1112.
http://dx.doi.org/10.2134/jeq1994.00472425002300050037x
De-scribing Non-Equilibrium and Preferential Flow and Transport in the Vadose Zone. Journal of Hydrology, 272, 14-35. http://dx.doi.org/10.1016/S0022-1694(02)00252-4
[13] Bear, J. (1972) Dynamics of Fluids in Porous Media. Courier Corporation.
[14] vanGenuchten, M.Th. (1980) A Closed-Form Equation for Predicting the Hydraulic Conductivity of Unsaturated Soils. Soil Science Society of America Journal, 44, 892-898. http://dx.doi.org/10.2136/sssaj1980.03615995004400050002x [15] Šimůnek, J. and van Genuchten, M.Th. (2008) Modeling Nonequilibrium Flow and Transport Processes Using
HYDRUS. Vadose Zone Journal, 7, 782-797. http://dx.doi.org/10.2136/vzj2007.0074
[16] Limousin, G., Gaudet, J.-P., Charlet, L., Szenknect, S., Barthès, V. and Krimissa, M. (2007) Sorption Isotherms: A Re-view on Physical Bases, Modeling and Measurement. Applied Geochemistry, 22, 249-275.
http://dx.doi.org/10.1016/j.apgeochem.2006.09.010
[17] Köhne, J.M., Köhne, S. and Šimůnek, J. (2009) A Review of Model Applications for Structured Soils: A) Water Flow and Tracer Transport. Journal of Contaminant Hydrology, 104, 4-35. http://dx.doi.org/10.1016/j.jconhyd.2008.10.002
[18] Köhne, J.M., Köhne, S. and Šimůnek, J. (2009) A Review of Model Applications for Structured Soils: B) Pesticide Transport. Journal of Contaminant Hydrology, 104, 36-60. http://dx.doi.org/10.1016/j.jconhyd.2008.10.003
[19] Gaudet, J.-P., Jegat, H., Vachaud, G. and Wierenga, P.J. (1977) Solute Transfer, with Exchange between Mobile and Stagnant Water, through Unsaturated Sand. Soil Science Society of America Journal, 41, 665-671.
http://dx.doi.org/10.2136/sssaj1977.03615995004100040009x
[20] Winiarski, T., Bedell, J.-P., Delolme, C. and Perrodin, Y. (2006) The Impact of Stormwater on a Soil Profile in an In-filtration Basin. Hydrogeology Journal, 14, 1244-1251. http://dx.doi.org/10.1007/s10040-006-0073-9
[21] Barraud, S., Gibert, J., Winiarski, T. and Krajewski, B. (2002) Implementation of a Monitoring System to Measure Impact of Stormwater Runoff Infiltration. Water Science & Technology, 45, 203-210.
[22] Lassabatere, L., Angulo-Jaramillo, R., Goutaland, D., Letellier, L., Gaudet, J., Winiarski, T. and Delolme, C. (2010) Effect of the Settlement of Sediments on Water Infiltration in Two Urban Infiltration Basins. Geoderma, 156, 316-325. http://dx.doi.org/10.1016/j.geoderma.2010.02.031
[23] Hillel, D. (1998) Environmental Soil Physics: Fundamentals, Applications, and Environmental Considerations. Aca-demic Press, Waltham.
[24] Lassabatere, L., Angulo-Jaramillo, R., Soria Ugalde, J.M., Cuenca, R., Braud, I. and Haverkamp, R. (2006) Beerkan Estimation of Soil Transfer Parameters through Infiltration Experiments-BEST. Soil Science Society of America Jour-nal, 70, 521-532. http://dx.doi.org/10.2136/sssaj2005.0026
[25] Arya, L.M. and Paris, J.F. (1981) A Physicoempirical Model to Predict the Soil Moisture Characteristic from Par-ticle-Size Distribution and Bulk Density Data. Soil Science Society of America Journal, 45, 1023-1030.
http://dx.doi.org/10.2136/sssaj1981.03615995004500060004x
[26] Miyazaki, T. (1988) Water Flow in Unsaturated Soil in Layered Slopes. Journal of Hydrology, 102, 201-214. http://dx.doi.org/10.1016/0022-1694(88)90098-4
[27] Walter, M.T., Kim, J.-S., Steenhuis, T.S., Parlange, J.-Y., Heilig, A., Braddock, R.D., Selker, J.S., and Boll, J. (2000) Funneled Flow Mechanisms in a Sloping Layered Soil: Laboratory Investigation. Water Resources Research, 36, 841- 849. http://dx.doi.org/10.1029/1999WR900328
[28] Kung, K.-J.S. (1990) Preferential Flow in a Sandy Vadose Zone: 2. Mechanism and Implications. Geoderma, 46, 59-71. http://dx.doi.org/10.1016/0016-7061(90)90007-V
[29] Lassabatere, L., Spadini, L., Delolme, C., Février, L., Galvez-Cloutier, R. and Winiarski, T. (2007) Concomitant Zn-Cd and Pb Retention in a Carbonated Fluvio-Glacial Deposit under both Static and Dynamic Conditions. Chemos-phere, 69, 1499-1508. http://dx.doi.org/10.1016/j.chemosphere.2007.04.053
[30] Lamy, E., Lassabatere, L., Bechet, B. and Andrieu, H. (2013) Effect of a Nonwoven Geotextile on Solute and Colloid Transport in Porous Media under both Saturated and Unsaturated Conditions. Geotextiles and Geomembranes, 36, 55-65. http://dx.doi.org/10.1016/j.geotexmem.2012.10.009
![Figure 1. Geological settings of the region of Lyon (a) and location of the study site area (b) according to [3]](https://thumb-us.123doks.com/thumbv2/123dok_us/8071218.779651/4.595.86.538.81.273/figure-geological-settings-region-lyon-location-study-according.webp)