Slantlet Transform: An Efficient Approach for
Compression and De-noising of Power Quality Events
Vijayashekhar S Sankannanavar Balasubramanya Vasista Vadiraj.N.Sansthanik
Department of ECE System Engineer Department of ECE Manipal Institute of Technology Applied Cognition Systems Pvt.ltd Manipal Institute of Technology
ABSTRACT
The Slantlet Transform (SLT) is an orthogonal Discrete Wavelet Transform (DWT) having two zero moments with improved time localization. SLT retains usual characteristics of filter bank implementation with a scale dilation factor of two. The basis is not based on iterated filter bank like DWT; instead, different filters are used for each scale. This paper proposes the De-noising method of Power system disturbances through signal decomposition, thresholding of slantlet transform coefficients and signal reconstruction. Slantlet transform coefficients having values below the threshold are discarded and above are retained. The cost for data storing and transmitting is competently reduced when Compared to the energy retained of the compressed Power Quality (PQ) disturbance signals and at no cost De-noising is happening through thresholding.
Keywords
Power Quality events, Slantlet transform, Thresholding, De-noising, Compression.
1.
INTRODUCTION
The performance of power system equipments is repeatedly affected by faults. Usual disturbances are signals which are having transients, sudden rise or sudden reduction in signals etc. Power quality faults phenomena spans a broad frequency spectra [1]. For example, impulsive transients owed to lightening strikes could have a frequency spectrum of order of MHz. In order to capture a broad range of disturbance phenomena, including impulsive transient disturbances, dedicated PQ monitoring devices on light/medium stations with MHZ of sampling rates are used. Since transient disturbances take place in order of tens of micro seconds, a single captured event using such monitoring devices can produce megabytes of data [2].As an effect, the volume of the recorded events increases considerably, leads to high cost in storing and transmitting such data. Therefore compression of such recorded events with slightest error in reconstruction is highly needed.
A useful requirement in general for compression is analysis of data initially by a transform to extract the feature information in data and removal of redundancy, before doing thresholding.Transformations have been generally used in this area in recent years are discrete Fourier transform, discrete cosine transform, discrete wavelet transform etc. Here in this paper slantlet transform [3] is used for analysis of recorded events.
The intention of this work is to use SLT in compressing PQ system disturbances and also to compress the PQ events with addition of noise.SLT is an orthogonal DWT having two zero moments and shorter support which are challenging criteria in the construction of wavelet filter banks unlike iterated filter bank in DWT[3].Octave band characteristics remains in the basis and leads to a clean DWT for limited length
signals(boundary issues will not arise as long as data length is power of two)[3].Basis is particularly suited for piecewise linear signals as is supported by compression and denoising examples shown further.
The organization of paper is as follows. In section 2, SLT and its important features is outlined. Data compression using thresholding and reconstruction, performance parameters definitions is presented in section 3.In section 4, simulation of disturbance signals under consideration, test results are obtained and interpreted for all the events related to disturbances in PQ system. Finally conclusions have been made in section 5.
2.
SLANTLET TRANSFORM THEORY
The class of bases described by Alpert [4] constructed based on Gram-Schmidt orthogonalization is used in SLT. It is based on a structure of filter bank where different filters are used for different scales. Filters are of shorter length satisfies orthogonality and zero moment conditions. The filter bank for two zero moments used in SLT is as shown in Figure 1. Having lengths 8 and 4 [3] [6].This is one of the advantage of filter bank when compared to Daubechies-2 filter bank in terms of filter length. Every filter bank works with scale dilation factor of two and provides a multiresolution decomposition. The filters used are piecewise linear.
Fig 1: Filter Bank Structure using SLT
3.
DATA COMPRESSION AND
RECONSTRUCTION USING SLT
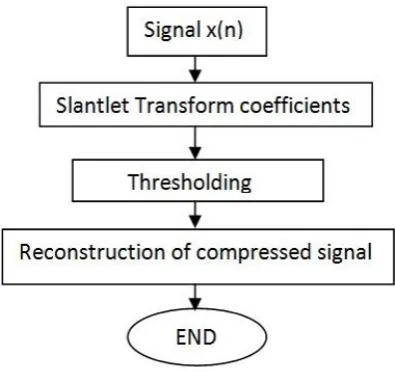
[image:2.595.316.536.274.376.2]The Flowchart for the process of compression and reconstruction of the signal is shown in Figure 2.
Fig 2: Flowchart for the process of compression and reconstruction.
As we can observe in the flowchart, Initially SLT is applied for the transformation. Then suitable threshold is chosen for discarding the SLT coefficients which are not having
significant energy in the second step called thresholding. The above two steps will ensure the compression part and then inverse SLT is applied to get the reconstructed signal. The block diagram of the entire process of compression and reconstruction is shown in figure 3.The filter coefficients used in analysis part are mentioned in section 2.The PQ system disturbance signal is applied as input to the two scale filter bank and the outputs are then getting down sampled by 4.The transformed coefficients used for the analysis filter bank are E0(z), E1(z), E2(z), E3(z) as shown in figure 3.The
transformation preserves most of the signal energy in some selective coefficients and remaining coefficients are insignificant. Therefore, suitable threshold is chosen to discard the coefficients. Also keeping reconstruction of signal and quality of the same in sight, the threshold is fixed. The insignificant coefficients are set to zero once we chose the threshold value. The remaining coefficients represent the original input signal in compressed form.
Fig 3: Block diagram for SLT based compression and reconstruction.
The coefficients in compressed form are then encoded to binary form used for storing and transmitting purpose. From the thresholded data the original PQ disturbance signal is reconstructed by using the two scale SLT synthesis filterbank as shown in the figure 4.Transformed coefficients used in synthesis filterbank are E’0(z), E’1(z), E’2(z), E’3(z) as shown
in the Figure 3.These filter coefficients are the time reversal of the corresponding analysis filters. The compressed data are upsampled by four and then convolved with the synthesis filter coefficients of each channel. These data are then added to get the reconstructed PQ disturbance signal for further use. The parameters used to assess the quality of compression are energy retained in percentage and mean square error (MSE) in decibels. The percentage of energy retained(ER) is defined as
It is used as a performance index for compression. MSE in decibels is defined as
Where x(i) is the original signal and the other is the reconstructed signal[5].
[image:2.595.67.265.514.700.2]Chosen test signals are PQ disturbance signals which are sine impulse, voltage sag, voltage swell, Harmonics, Momentary interruption, Oscillatory transient and Voltage flicker.
4.
SIMULATION AND TEST RESULTS
Compression capability of SLT approach is revealed by taking a sine impulse signal containing impulse at certain time as shown in Figure 4.Breakdown of the signal into two levels and the corresponding outputs of the filter are shown in the Figure 5. Information of different frequency components is shown by the outputs of filter and it also shows how precisely it localizes the disturbance point. Once thresholding is done by proper value of threshold, later the reconstruction process is done. Reconstructed signal is as shown in the Figure 6.The ratio between the original signal coefficients to the number of signal coefficients remained after thresholding is compression ratio(CR).Here in present case CR = 10 is considered. It is detected that higher the CR values less data are retained after thresholding and hence accuracy is sacrificed in reconstructing the signal.
Fig 4: Original Sine impulse signal of 50 Hz.
Fig 5: a) Original sine impulse signal of 50 Hz
Fig 5: b) First filter output
Fig 5: c) Second filter output
Fig 5: c) Third filter output
Fig 5: Multiresolution analysis
Fig 6: Reconstructed sine impulse signal
All the PQ signals are generated in the MATLAB at the sampling rate of 3 kHz. Simulation is done with sinusoidal signals of 50Hz and 1 p.u. amplitude. MSE and ER is calculated for all the PQ disturbance signals and listed in the Table 1.
Table 1.Percentage of Energy retained and MSE in dB obtained using SLT based compression approach for all
signals at CR=10
Input Signals without noise
DCT DWT SLT
ER (%)
MSE (dB)
ER (%)
MSE (dB)
ER (%)
MSE (dB)
Impulse 88.01 -10.67 91.13 -13.56 98.21 -16.98
Sag 87.81 -10.08 90.01 -13.04 98.61 -17.54
Swell 89.46 -11.88 91.01 -13.77 98.61 -17.95
Harmonics 87.69 -11.04 90.89 -13.31 91.90 -17.68
Momentary
Interrupts 90.44 -12.27 91.10 -15.89 98.91 -18.79
Oscillatory
Transient 91.63 -12.98 90.88 -14.45 98.11 -19.07 Voltage
Flicker 90.75 -10.76 91.34 -14.74 98.75 -19.78
Table 2. Percentage of energy retained and MSE in dB obtained using SLT based compression approach for all
signals with SNR of15dB at CR=10
Input Signals with noise
SLT DWT
ER (%)
MSE (dB)
ER (%)
MSE (dB)
Impulse
93.7501 -14.7121 90.8701 11.2921
Sag 92.8994 -15.6653 89.7054 11.1653
Swell 95.4906 -14.3391 89.9594 10.1591
Harmonics 87.1272 -11.1386 85.0872 9.6383
Momentary
Interruption 91.1185 -15.1829 88.1085 12.2829 Oscillatory
Transient 93.0431 -14.3747 88.8831 9.7547
Voltage
Flicker 94.0553 -14.8708 90.2153 9.8308
Figure 7, Shows the original sine impulse signal with SNR 15dB added noise and Figure 8, shows the reconstructed signal from the thresholded data. From figure 8 it can be easily seen that signal which is reconstructed contains much less noise and pattern of reconstructed signal without noise is kept. Therefore good denoising can be done through data compression. It is since the slantlet transform coefficients caused by noise are generally small and mostly concentrated in high frequency bands, i.e., the first several scales. So that any thresholding can reach the denoising to a certain degree.
Fig 7: Sine impulse signal with AWGN of 15dB SNR.
Fig 8: Reconstructed sine impulse signal.
Definitions of all the PQ system disturbance signals used here are described [5] and MATLAB simulated PQ signals are shown in Figures (9,10,11,12,13,14).The reconstructed signals of original disturbance signals with noise are comparable to reconstructed signals of original disturbance signals without noise. For example if we look into the table 1, the energy retained in percentage for the sine impulse signal is 98.2191 and energy retained for the same with noise is 93.7501 as mentioned in Table 2.The difference in percentage between these two values is 4.55 which is acceptable.
Similarly for all the signals the difference in percentage of energy retained of the signals with and without noise is about 5. From this reflection we can say that a decent denoising has happened through compression. As the SLT approach is the efficient method for data compression when compared to
DCT and DWT [5].SLT based compression technique is also the efficient technique for compression as well as denoising through compression.
Fig 9: Voltage Sag signal of 50 Hz.
Fig 10: Voltage Swell signal of 50 Hz.
Fig 11: Momentary interruption signal of 50 Hz.
Fig 12: Signal with third and fifth Harmonics of 50 Hz.
Fig 13: Oscillatory transient signal of 50 Hz.
5.
CONCLUSION
In this paper, SLT is applied for compression of PQ disturbance signals and signals with additive white Gaussian noise of SNR 15dB.The performance is assessed through computer simulation for both the cases. Considering percentage of energy retained and mean square error in dB of different disturbance signals, it is in general witnessed from analysis that accuracy is good for efficient compression, high quality compression and good denoising effect. Thus it is, in general, conclude that SLT based compression technique is efficient for compression of transient signals without noise and with noise upto certain degree when compared to DCT and DWT.
6.
ACKNOWLEDGMENTS
Our thanks to Assistant Professors Mr Ananthakrishna T, Mr Nakul Shetty K of Manipal Institute of Technology who guided us towards development of the work. Our thanks to Mr Ajay Naik, Tushar, Anand G, Mohan, Ranganath and other friends who indirectly helped us towards the work done and for motivating us. Finally Thanks to our parents who really motivated and guided whole heartedly.
7.
REFERENCES
[1] IEEE P1159/P6, working groups on Monitoring Electric Power Quality of SCC22- Power Quality, “Recommended Practice on Monitoring Electric Power Quality”, Draft, Dec.1994.
[2] R.P Bingham, D. Kreiss, S. Santoso, ”Advances in data reduction techniques for power quality instrumentation”, in proceedings of the Third European Power Quality Conference, Power quality ’95, Bremen, Germany November 7-9, 1995.
[3] I. W. Selesnick, “The Slantlet Transform”, IEEE Trans, Signal Processing, vol. 47, pp. 1304-1313, May 1999. [4] B. Alpert, G. Beylkin, R. Coifman and V. Rokhlin,
“Wavelets-like bases for the fast solution of second kind integral equations”, SIAM J. Sci. Comput., Vol. 14, pp. 159-184, Jan.1993.
[5] G. Panda, P. K. Dash, A. K. Pradhan, and S. K. Meher “Data Compression of Power Quality Events Using the Slantlet Transform” IEEE Transactions on Power Delivery, Vol. 17, No. 2, April 2002. .
[6] I. Daubechies, Ten Lectures on Wavelets. Philadelphia, PA: SIAM, 1992.
[7] Vijayashekhar S S, “Analysis of Power System Disturbance Signals using Slantlet Transform for Compression and De-noising” IJCA Special Issue on International Conference on Electronic Design and Signal Processing ICEDSP(4):6-10, February 2013. [8] Sudipta Nath, Arindam Dey and Abhijit Chakrabarti,
(2009). “Detection of Power Quality Disturbances using Wavelet Transform”, World Academy of Science, Engineering and Technology 49.
[9] H. M. S. C.Herath, Victor J. Gosbelland SarathPerera,„Power Quality (PQ) Survey Reporting: Discrete Disturbance Limits, IEEE transaction on power delivery, Vol. 20, No. 2, April 2005
[10] Sharmeela, C., Mohan, M. R., Uma, G. & Baskaran, J.(2006). A Novel Detection and Classification Algorithm for Power Quality Disturbances Using Wavelets. American Journal of Applied Sciences, Vol. 3
(No. 10), pp. 2049205.