Correctly finger-pointing the
Lisbon-process-villains
Tausch, Arno
Department of Political Science, Innsbruck University
1 January 2007
Online at
https://mpra.ub.uni-muenchen.de/1890/
Correctly finger-pointing the Lisbon-process-villains. A re-analysis of the study, recently
presented by Jose Manuel Durao Barroso: Centre for European Reform (CER)(2006),
“The Lisbon Scoreboard VI. Will Europe’s economy rise again?” (Author: Aurore
Wanlin). London: Centre for European Reform:
http://www.cer.org.uk/pdf/p_661_lisbon_riseagain_vi_econ.pdf
By Dr. Arno TAUSCH
1,
Adjunct Professor of Political Science at Innsbruck University
Abstract:
The European Union’s center-piece of economic policy making is the Lisbon process, which
tries to make Europe the most competitive economic region in the world economy by 2010.
EU-Commission President Jose Manuel Durao Barroso recently presented a Centre for European
Reform (CER) study that maintained that Denmark, Sweden and Austria are the best performing
Lisbon process countries for 2005 and that Romania, Poland and Malta are the lowest ranked
countries in the European Union in the same year. Due to lacking data, practically no serious
conclusions can be drawn about Turkey. In the study, presented by the Commission President,
some real finger pointing is made, with the “good” performers being called “heroes” and the
“bad performers” being called “villains”. In the study, Poland was made the European
chief
“villain” (henceforth called, in keeping with this tendency towards abbreviations in the
euro-cracy, the
ECV,
for 2005). Our rigorous re-analysis of the data leads us to the conclusion that
the
ECV,
i.e. the country characterized by past bad cumulated performance, and having no real
prospect of things getting better
is not Poland but Portugal.
It emerges once again that the
Lisbon process is in a dire state of affairs.
Introduction and general perspectives on the study
However much the present author welcomes the idea of quantitative Lisbon process
compari-sons, several very severe methodological deficiencies seem to characterize the recently
pub-lished CER study.
•
Only 2 of the Eurostat structural Lisbon indicators
2present a complete data series for
the period 2004 and 2005, thus any comparisons referring to this period are at least a
misnomer. We therefore decided to call the time periods in our re-run “the most recent
period (
tn
) and the preceding period (
tn-1
)”, with the most recent period sometimes
re-ferring to 2005, but sometimes to 2004, or even 2003.
•
One of the 14 Lisbon structural indicators, the dispersion of regional employment rates,
does not list any data at all for the EU-member countries Cyprus, Denmark, Estonia,
Ireland, Latvia, Lithuania, Luxembourg, Malta, and Slovenia over the entire period, and
1
Arno Tausch is in his academic function Adjunct Professor (Universitaetsdozent) of Political Science at Innsbruck
University, Department of Political Science, A-6020 Innsbruck University; Innrain 52/III; Austria (Founder:
Professor Anton Pelinka). In his professional functions, he is involved in the process of the enlargement of the
European Union since 1992. His research program is focused on world systems studies, development and dependency
studies, European studies, and quantitative peace research. Available book publications:
http://www.campusi.com
.
Opinions expressed in this contribution are exclusively those of the author in his capacity as adjunct professor at
Austrian Universities.
2
Available freely at
not just the most recent years. So how do you code the data for these countries? We
therefore decided to reduce the number of indicators to 13. An indicator with so many
completely missing values severely biases the results.
•
It is obvious that the Eurostat data, as they are presented on the Internet, are not
quali-fied for an immediate multivariate ranking or other multivariate analysis. Only the EU
or EEA member countries Austria, Belgium, Bulgaria, Cyprus, Czech Republic,
Den-mark, Estonia, Finland, France, Germany, Greece, Hungary, Ireland, Italy, Latvia,
Lithuania, Luxembourg, Netherlands, Norway, Poland, Portugal, Romania, Slovakia,
Slovenia, Spain, Sweden, and the United Kingdom present at least two contiguous data
for at least two recent periods for all the 13 indicators, while a varying number of other
Eurostat structural indicator countries, which include, to an amazingly varying degree,
countries as different as the EU-candidates, the EEA nation Iceland, the EFTA nation
Switzerland, on one occasion Canada, sometimes Japan, and several times the United
States, had to be relegated from the data matrix to make our comparisons more reliable.
Countries that list less than 2 data points for the entire observation period (mostly
start-ing somewhere in the 1990s) had thus to be eliminated from the data matrix.
•
What’s more, one of the indicators
– comparative price levels –
correlates very
posi-tively with the other main Lisbon targets, and yet the Commission, Eurostat and the
member countries continue to sanction it as an indicator that should achieve a
low
level
to be compatible with the Lisbon process.
High price levels
and
a stable currency
and
highly priced tradables
and
non-tradables
are
significantly
and
very closely
associ-ated
(absolute value of the correlation coefficient higher or equal to +- 0.50)
with
a low
energy intensity of the economy, a low long-term unemployment rate, a high rate of
employment of older workers, a high rate of
gross domestic expenditures on research
and development
, a high rate of total employment, a
high GDP per capita
and a
high
labor productivity
. A rigorous scientific interpretation of these facts would warrant at
least the calculation of two listings of ranks, one considering a high price level as
some-thing inherently wrong for the Lisbon process, the other considering a high price level
as something structurally inherent in a highly developed economy with highly priced
tradable goods and non-tradable goods, and with poorer countries catching up
(Balassa/Samuelson’s effect).
•
Far from presenting state of the art methodology, the CER study simply performs an
additive scoreboard calculation of ranks, neglecting other techniques such as the
calcu-lation of composite indices that became very popular in the applied social sciences
es-pecially with the publication of the UNDP Human Development Reports, let alone
prin-cipal components or other multivariate techniques, available via the major computer
softwares for the social sciences, like the SPSS or the SAS programs. Scoreboard ranks
are absolutely inferior to such more novel techniques
In the light of these methodological remarks, we present the following final table of the results
of our calculations, based on the UNDP type of methodology. Our Lisbon Index projects the
results of 13 component variables onto 13 dimension indicators that each range from 0 to 1,
with 1 representing the best value and 0 the worst. The 13 dimension indices are then multiplied
by 1/13 and added together for the composite index, ranging from 0 (worst value) to 1 (best
value). Norway, Sweden and Denmark are the Lisbon model countries of the most recent
pe-riod, while Romania, Bulgaria and Poland are indeed the “villains (ECVs)” for
tn
. But are
poorer member countries of the Union to be castigated just for their poverty, or rather for their
bad performance in recent periods?
Summary Table 1: final ranking of the Lisbon process
a) a new composite Lisbon process indicator
final data, ranked by performance in tn
UNDP Lisbon Amartya Sen type index,
tn-1
UNDP Lisbon Amartya Sen type index, tn
DYN UNDP Lisbon Amartya Sen type Process)
Norway 0,7186 0,7195 0,0009
Sweden 0,71237 0,71819 0,00582
Denmark 0,69523 0,71371 0,01849
Finland 0,64343 0,65095 0,00752
Luxembourg 0,61563 0,60788 -0,00774
Netherlands 0,60878 0,60203 -0,00675
United Kingdom 0,58703 0,59728 0,01025
Austria 0,59676 0,58867 -0,00808
Ireland 0,54181 0,56345 0,02164
France 0,56137 0,56166 0,00029
Slovenia 0,51586 0,53807 0,0222
Belgium 0,52994 0,53657 0,00663
Germany 0,54388 0,53493 -0,00895
Czech Republic 0,53265 0,53162 -0,00103
Cyprus 0,46456 0,4845 0,01995
Hungary 0,47006 0,456 -0,01406
Latvia 0,41708 0,45366 0,03658
Italy 0,43975 0,4468 0,00705
Spain 0,41572 0,42279 0,00707
Estonia 0,43377 0,4198 -0,01397
Greece 0,40539 0,41245 0,00706
Lithuania 0,38511 0,41036 0,02526
Portugal 0,3998 0,35828 -0,04152
Slovakia 0,35233 0,34704 -0,00529
Romania 0,3239 0,31548 -0,00843
Bulgaria 0,29376 0,30846 0,0147
Poland 0,30952 0,30302 -0,0065
b) the dynamics of the process and the final answer to the question, as to who is a “hero”
and who is a “villain (ECV)”
final rank, according to the UNDP Lisbon Amartya Sen type index, tn
final rank, according to the DYN UNDP Lisbon Amartya Sen type Process
Latvia 17 1
Lithuania 22 2
Slovenia 11 3
Ireland 9 4
Cyprus 15 5
Denmark 3 6
Bulgaria 26 7
United Kingdom 7 8
Finland 4 9
Spain 19 10
Greece 21 11
Italy 18 12
Belgium 12 13
Sweden 2 14
Norway 1 15
France 10 16
Czech Republic 14 17
Slovakia 24 18
Poland 27 19
Netherlands 6 20
Luxembourg 5 21
Austria 8 22
Romania 25 23
Germany 13 24
Estonia 20 25
Portugal 23 27
But we have to consider also that the poorer countries of East Central Europe have made
enor-mous strides over recent years to reform their economies and political systems. Fast progress in
the 2 Baltic Republics
Latvia
and
Lithuania
as well as in
Slovenia
has to be duly considered,
while
Estonia’s
and
Hungary’s
performance deteriorated considerably over time.
The real villains (ECVs) – past bad cumulated performance, no prospect of things getting
better
3:
Portugal
Romania
Poland
The real heroes – past good cumulated performance, good prospect of things even still
getting better in future:
Denmark
Ireland
Finland
We also come to the conclusion that the CER study, compared to our own final results for
tn
above, systematically overstates the performance of Austria, Portugal, Estonia, and Greece,
while
Finland
,
Latvia, Spain, Luxembourg,
and
Italy,
are performing much better than
ex-pected.
3
Combined bad performance of cumulated past policy results, as manifest in the ranking on the final indicator for tn,
Summary Table 1a (UNDP Lisbon Amartya Sen type index, tn), and
changes
to the better or worse, as manifest in
the dynamic indicator, presented in Table 1b).
Villain status (ranging ideally
from 1 to 27)
Denmark 4,5
Ireland 6,5
Finland 6,5
Slovenia 7
United Kingdom 7,5
Sweden 8 Norway 8 Latvia 9 Cyprus 10 Lithuania 12 Belgium 12,5 France 13 Netherlands 13 Luxembourg 13 Spain 14,5 Italy 15 Austria 15
Czech Republic 15,5
Greece 16 Bulgaria 16,5 Germany 18,5 Slovakia 21 Hungary 21 Estonia 22,5
Poland 23
Romania 24
Results of the CER study and our main critique
The European media were recently full with reports about Denmark, Sweden and Austria at the
top of the Lisbon process list. Even the Chinese international news agency
Xinhua
reported:
BRUSSELS, March 20 (Xinhuanet) -- Denmark, Sweden and Austria top the list on this year's
scorecard to measure European Union (EU) states' efforts to boost competitiveness, according
to a think-tank from the region. The result was released on Monday by the Center for European
Reform (CER), a privately-funded think-tank which aims to promote new ideas and policies for
the EU. Each year, the union issues the 'Lisbon Scorecard', which assesses progress among
member states on the so-called Lisbon Agenda. The agenda, set up by the EU, aims to
encour-age the bloc to become the most competitive economy in the world. The scorecard was
pre-sented to European Commission president Jose Manuel Barroso. "Many underlying trends are
positive", the CER said in a press release. "Slowly, but steadily, the EU is moving forward in
most of the areas covered by the Lisbon agenda." Denmark and Sweden are once again this
year's top two on the scoreboard, while Austria has climbed from five to three. Britain and
Holland took places four and five respectively, a drop of two places for the Netherlands on the
list which comprises the EU-25 in addition to acceding states. The five countries topping the
list performed well in innovation, research and development, according to the CER.
The scorecard identifies "heroes" and "villains" in the area of economic reform, on the basis of
a set of indicators based on Eurostat figures, as well as on prospects for further reform. Poland
has been earmarked as this year's "villain" by the London-based think-tank because of its poor
performance on indicators such as long-term unemployment, but also because of its recent shift
of government. Poland's government is led by the conservative Law and Justice party, which
has been criticized for its protectionism, its dislike of foreign investment and its encroachment
on the independence of the country's central bank. Malta is last on the list, but this is primarily
because Eurostat indicators for the Mediterranean island are lacking. France and Germany
occupy place eight and ten on the list respectively, with France climbing from its position last
year of 11 -- primarily because of improving employment figures. As a whole, the scorecard
reveals a "mixed picture" on the EU's progress in meeting its Lisbon goals, the statement said.”
Clearly, the small quoted footnote is utterly insufficient to explain what was done with all these
data series, that don't even have data for 2005, or are simply missing, for whatever year! To
seriously run a 2004/2005 ranking + shift analysis, as was done in Table 1, one must explain
how one handles the following statistical problems
•
Total employment rate.
Data Range 1993 – 2004
•
Total employment rate of older workers.
Data range 1993 – 2004
•
Gross domestic expenditure on R&D (GERD).
Data Range 1994 – 2005, Only 2
countries report data for 2005, 2004 data missing for Italy, and Portugal, 2003 data
complete for EU-25, 2002 data missing for Luxembourg, Greece and Sweden
[image:8.595.85.541.247.684.2]•
Comparative price levels.
Data Range 1995 – 2004, Lisbon main indicator GDP per
capita explains some 70 % of comparative price levels, the relationship is positive,
Note: Eurostat suggests that a high indicator value is a sign of a bad performance. But a
high GDP per capita is strongly related to high comparative price levels
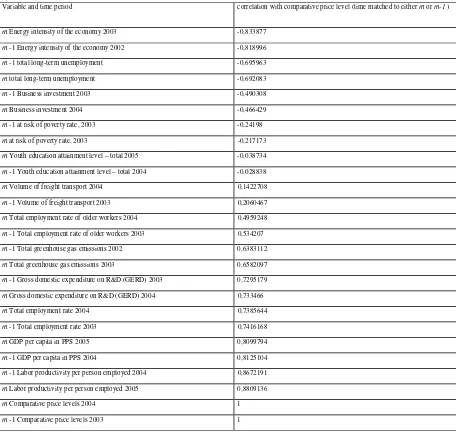
Table 2: correlations
4with the comparative price level
Variable and time period correlation with comparative price level (time matched to either tn or tn-1 )
tn Energy intensity of the economy 2003 -0,833877
tn -1 Energy intensity of the economy 2002 -0,818996
tn -1 total long-term unemployment -0,695963
tn total long-term unemployment -0,692083
tn -1 Business investment 2003 -0,490308
tn Business investment 2004 -0,466429
tn -1 at risk of poverty rate, 2003 -0,24198
tn at risk of poverty rate, 2003 -0,217173
tn Youth education attainment level – total 2005 -0,038734
tn -1 Youth education attainment level – total 2004 -0,028838
tn Volume of freight transport 2004 0,1422708
tn -1 Volume of freight transport 2003 0,2060467
tn Total employment rate of older workers 2004 0,4959248
tn -1 Total employment rate of older workers 2003 0,534207
tn -1 Total greenhouse gas emissions 2002 0,6383112
tn Total greenhouse gas emissions 2003 0,6582097
tn -1 Gross domestic expenditure on R&D (GERD) 2003 0,7295179
tn Gross domestic expenditure on R&D (GERD) 2004 0,733466
tn Total employment rate 2004 0,7385644
tn -1 Total employment rate 2003 0,7416168
tn GDP per capita in PPS 2005 0,8099794
tn -1 GDP per capita in PPS 2004 0,8125104
tn -1 Labor productivity per person employed 2004 0,8672191
tn Labor productivity per person employed 2005 0,8809136
tn Comparative price levels 2004 1
tn -1 Comparative price levels 2003 1
•
One correlation, that between the Lisbon main target GDP per capita in PPS and the
comparative price level, is reported in Graph 1 below:
4
Graph 1: GDP per capita PPS and the comparative price level
GDP per capita PPS and comp price level
y = 0,5778x + 36,961 R2 = 0,6915
0 20 40 60 80 100 120 140 160 180
0 50 100 150 200 250
GDP per capita PPS
co
mp
p
rice
le
ve
l
•
Business investment.
Data Range 1993 – 2004
•
At-risk-of-poverty rate after social transfers – total.
Data Range 1995 – 2004, Data
2004 and 2003 missing for several EU-25 countries, complete data for 2003 and 2004
only for Luxembourg; Finland; Norway; Denmark; Austria; France; Bulgaria; Belgium;
EU (25 countries); Germany; EU (15 countries); Euro-zone (12 countries); Spain;
Greece; Portugal; Ireland; and Slovakia available, Note: Eurostat suggests that a high
indicator value is a sign of a bad performance
•
Total long-term unemployment rate.
Data Range: 1993 – 2004, Note: Eurostat
sug-gests that a high indicator value is a sign of a bad performance
and Slovenia, for the entire period, Note: Eurostat suggests that a high indicator value is
a sign of a bad performance
•
Total greenhouse gas emissions.
Data Range 1993 – 2003 and target, Note: Eurostat
suggests that a high indicator value is a sign of a bad performance
•
Energy intensity of the economy.
Data Range 1992 – 2003, Note: Eurostat suggests
that a high indicator value is a sign of a bad performance
•
Volume of freight transport.
Data Range 1993 – 2004, 2004 Missing values for
Greece (missing since 2000), and Malta, Note: Eurostat suggests that a high indicator
value is a sign of a bad performance
12 of the 14 indicators
(I leave it to the readers’ imagination to calculate the percentages) do
NOT even refer to the years 2004 + 2005 or report - often severe - problems of missing
data.
To seriously say something about the Lisbon performance 2005, and ranks in 2005 and 2004,
based on average performance in the EU short list of structural indicators, as the author claims
on page 9 of her publication, how did she do that?
A first step towards more reliable results: getting the data matrix straight and eliminate
indicators and countries with complete data blackouts
Without fundamentally correcting the flawed data matrix, that would emerge from a 1:1 copy of
the original Eurostat data, no reliable results can be achieved. Cyprus, Denmark, Estonia,
Ice-land
, Ireland, Latvia, Lithuania, Luxembourg, Malta, Slovenia, Croatia,
Japan, Switzerland
,
Turkey,
United States
have completely missing data points for all observed years for
regional
employment
. What did the CER team do with those data? You find no trace of notice on that
problem in the CER publication. Just to quote here from a
standard theory of science
text why
one has to insist so much on being able to recalculate the CER data files:
http://team.bk.tudelft.nl/Publications/2002/Criteria%20for%20scientific%20study%20and%20d
esign.htm
E Methodical accountability and depth
Such accountability, of the way in which (using which method) one will arrive at a result,
should make possible that someone else using the same method can (not: will) arrive at a
simi-lar outcome.
F Ability to be criticised and to criticize
Ability to be criticised (ability to be refuted) offers others the opportunity to selectively make
progress by building upon technical scientifical know-how and knowledge (accumulation)
ob-tained through study.
A statistically decent solution would have been to work with the following data matrix, based
on 13 indicators, not 14, and to use the imputed statistics
5, where there are missing values for
the most recent two years. Our final data matrix, on which we based our own comparisons, and
which is available from our materials at our website reference to this publication, is the
follow-ing:
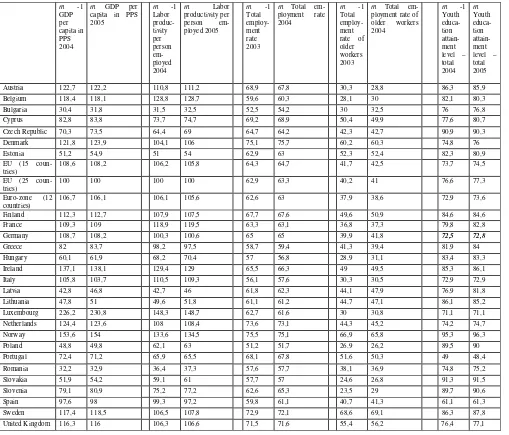
Table 3: the data for our own final Lisbon process comparison
tn -1 GDP per capita in PPS 2004
tn GDP per
capita in PPS 2005
tn -1 Labor produc-tivity per person em-ployed 2004
tn Labor
productivity per person em-ployed 2005
tn -1 Total employ-ment rate 2003
tn Total em-ployment rate 2004
tn -1 Total employ-ment rate of older workers 2003
tn Total em-ployment rate of older workers 2004
tn -1 Youth educa-tion attain-ment level – total 2004 tn Youth educa-tion attain-ment level – total 2005
Austria 122,7 122,2 110,8 111,2 68,9 67,8 30,3 28,8 86,3 85,9
Belgium 118,4 118,1 128,8 128,7 59,6 60,3 28,1 30 82,1 80,3
Bulgaria 30,4 31,8 31,5 32,5 52,5 54,2 30 32,5 76 76,8
Cyprus 82,8 83,8 73,7 74,7 69,2 68,9 50,4 49,9 77,6 80,7
Czech Republic 70,3 73,5 64,4 69 64,7 64,2 42,3 42,7 90,9 90,3
Denmark 121,8 123,9 104,1 106 75,1 75,7 60,2 60,3 74,8 76
Estonia 51,2 54,9 51 54 62,9 63 52,3 52,4 82,3 80,9
EU (15 coun-tries)
108,6 108,2 106,2 105,8 64,3 64,7 41,7 42,5 73,7 74,5
EU (25 coun-tries)
100 100 100 100 62,9 63,3 40,2 41 76,6 77,3
Euro-zone (12 countries)
106,7 106,1 106,1 105,6 62,6 63 37,9 38,6 72,9 73,6
Finland 112,3 112,7 107,9 107,5 67,7 67,6 49,6 50,9 84,6 84,6
France 109,3 109 118,9 119,5 63,3 63,1 36,8 37,3 79,8 82,8
Germany 108,7 108,2 100,3 100,6 65 65 39,9 41,8 72,5 72,8
Greece 82 83,7 98,2 97,5 58,7 59,4 41,3 39,4 81,9 84
Hungary 60,1 61,9 68,2 70,4 57 56,8 28,9 31,1 83,4 83,3
Ireland 137,1 138,1 129,4 129 65,5 66,3 49 49,5 85,3 86,1
Italy 105,8 103,7 110,5 109,3 56,1 57,6 30,3 30,5 72,9 72,9
Latvia 42,8 46,8 42,7 46 61,8 62,3 44,1 47,9 76,9 81,8
Lithuania 47,8 51 49,6 51,8 61,1 61,2 44,7 47,1 86,1 85,2
Luxembourg 226,2 230,8 148,3 148,7 62,7 61,6 30 30,8 71,1 71,1
Netherlands 124,4 123,6 108 108,4 73,6 73,1 44,3 45,2 74,2 74,7
Norway 153,6 154 133,6 134,5 75,5 75,1 66,9 65,8 95,3 96,3
Poland 48,8 49,8 62,1 63 51,2 51,7 26,9 26,2 89,5 90
Portugal 72,4 71,2 65,9 65,5 68,1 67,8 51,6 50,3 49 48,4
Romania 32,2 32,9 36,4 37,3 57,6 57,7 38,1 36,9 74,8 75,2
Slovakia 51,9 54,2 59,1 61 57,7 57 24,6 26,8 91,3 91,5
Slovenia 79,1 80,9 75,2 77,2 62,6 65,3 23,5 29 89,7 90,6
Spain 97,6 98 99,3 97,2 59,8 61,1 40,7 41,3 61,1 61,3
Sweden 117,4 118,5 106,5 107,8 72,9 72,1 68,6 69,1 86,3 87,8
United Kingdom 116,3 116 106,3 106,6 71,5 71,6 55,4 56,2 76,4 77,1
5
Table 3 (cont.): the data for our own final Lisbon process comparison
tn -1 Youth educa-tion attain-ment level – total 2004
tn Youth
education attainment level – total 2005
tn -1 Gross domes-tic expen-diture on R&D (GERD) 2003
tn Gross
domestic expenditure on R&D (GERD) 2004
tn -1 Com-parative price levels 2003
tn Compara-tive price levels 2004
tn -1 Busi-ness invest-ment 2003
tn Business
investment 2004
tn -1 at risk of poverty rate, 2003
tn at risk of poverty rate, 2004
Austria 86,3 85,9 2,19 2,26 105,7 103,6 20,2 19,9 13 13
Belgium 82,1 80,3 1,92 1,93 104 104,2 17,2 17,3 15 15
Bulgaria 76 76,8 0,5 0,51 42,6 43 16,5 17,8 14 15
Cyprus 77,6 80,7 0,35 0,37 96,5 93,3 14,4 15,2 15 15
Czech Republic 90,9 90,3 1,26 1,28 55,5 55 22,7 22,6 8 8
Denmark 74,8 76 2,59 2,61 138,8 137 17,8 18 12 11
Estonia 82,3 80,9 0,82 0,91 63,2 62,9 25,5 25,2 18 18
EU (15 coun-tries)
73,7 74,5 1,97 1,95 104 104 16,8 17 15 17
EU (25 coun-tries)
76,6 77,3 1,92 1,9 100 100 16,9 17,1 15 16
Euro-zone (12 countries)
72,9 73,6 1,9 1,89 102,9 102,7 17,5 17,7 15 17
Finland 84,6 84,6 3,48 3,51 125,9 122,9 15,3 15,8 11 11
France 79,8 82,8 2,18 2,16 105,8 108 15,6 15,9 12 14
Germany 72,5 72,8 2,52 2,49 108,7 106,6 16,3 16 15 16
Greece 81,9 84 0,62 0,58 84,5 85,1 21,3 21,1 21 20
Hungary 83,4 83,3 0,95 0,89 59 61,9 18,8 19,3 10 12
Ireland 85,3 86,1 1,16 1,2 126,6 123,1 19,2 20,9 21 21
Italy 72,9 72,9 1,16 1,14 102,3 102,7 17,8 18,1 19 19
Latvia 76,9 81,8 0,38 0,42 55,4 56,4 22,9 25,6 16 16
Lithuania 86,1 85,2 0,68 0,76 54,9 54,6 18,2 18,5 17 15
Luxembourg 71,1 71,1 1,78 1,75 105,3 106,1 14,9 14,3 10 11
Netherlands 74,2 74,7 1,76 1,77 106,6 105,2 15,7 16,3 11 12
Norway 95,3 96,3 1,75 1,64 145,2 135,8 14,5 15,2 11 11
Poland 89,5 90 0,56 0,58 53,4 52,4 14,9 14,6 17 17
Portugal 49 48,4 0,8 0,78 87,3 85,7 19,4 19,2 19 21
Romania 74,8 75,2 0,4 0,4 41,5 43,2 18,3 18,3 18 17
Slovakia 91,3 91,5 0,58 0,53 50,5 54,9 23,1 22,2 21 21
Slovenia 89,7 90,6 1,54 1,61 77,9 75,8 20,5 21,3 10 10
Spain 61,1 61,3 1,05 1,07 86,6 87,4 23,5 24,5 19 20
Sweden 86,3 87,8 3,98 3,74 124 121,1 12,9 13 11 11
United Kingdom 76,4 77,1 1,88 1,79 103,8 105,6 14,3 14,6 18 18
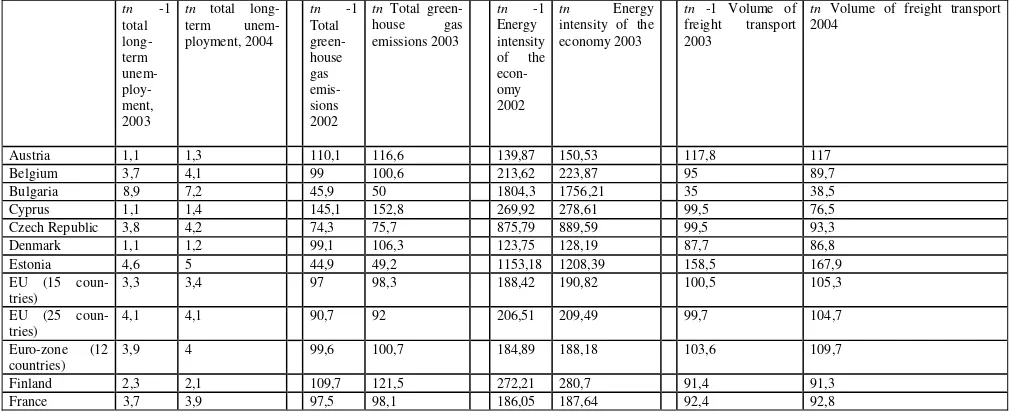
Table 3 (cont.): the data for our own final Lisbon process comparison
tn -1 total long-term unem- ploy-ment, 2003
tn total long-term unem-ployment, 2004
tn -1 Total green-house gas emis-sions 2002
tn Total green-house gas emissions 2003
tn -1 Energy intensity of the econ-omy 2002
tn Energy
intensity of the economy 2003
tn -1 Volume of freight transport 2003
tn Volume of freight transport 2004
Austria 1,1 1,3 110,1 116,6 139,87 150,53 117,8 117
Belgium 3,7 4,1 99 100,6 213,62 223,87 95 89,7
Bulgaria 8,9 7,2 45,9 50 1804,3 1756,21 35 38,5
Cyprus 1,1 1,4 145,1 152,8 269,92 278,61 99,5 76,5
Czech Republic 3,8 4,2 74,3 75,7 875,79 889,59 99,5 93,3
Denmark 1,1 1,2 99,1 106,3 123,75 128,19 87,7 86,8
Estonia 4,6 5 44,9 49,2 1153,18 1208,39 158,5 167,9
EU (15 coun-tries)
3,3 3,4 97 98,3 188,42 190,82 100,5 105,3
EU (25 coun-tries)
4,1 4,1 90,7 92 206,51 209,49 99,7 104,7
Euro-zone (12 countries)
3,9 4 99,6 100,7 184,89 188,18 103,6 109,7
Finland 2,3 2,1 109,7 121,5 272,21 280,7 91,4 91,3
[image:12.595.63.563.110.498.2] [image:12.595.57.564.561.769.2]Germany 4,5 5,4 81,3 81,5 158,74 159,5 103,1 107,5
Greece 5,3 5,6 119,6 123,2 257,97 250,12 141 141,7
Hungary 2,4 2,7 66,1 68,1 579,58 581,99 85,4 91,9
Ireland 1,6 1,6 128,6 125,2 166,14 161,74 141 147,5
Italy 4,9 4 108,7 111,6 184,12 192,61 93,4 104,4
Latvia 4,4 4,6 41,9 41,5 750,25 728,83 133,4 129,3
Lithuania 6 5,8 38,5 33,8 1272,73 1204,81 119,1 116,2
Luxembourg 0,9 1,1 84,9 88,5 196,67 201,51 109 104,8
Netherlands 1 1,6 100,2 100,8 201,09 208,74 96 105,5
Norway 0,6 0,8 106,7 109,3 187,68 159,2 124,9 127,9
Poland 11 10,3 65,5 67,9 654,15 663,12 83,1 90,3
Portugal 2,2 3 144,3 136,7 254,68 251,32 114,9 165,9
Romania 4,2 4,5 51,3 53,9 1316,48 1368,46 96,1 100,2
Slovakia 11,4 11,8 72,8 71,8 976,01 937,33 47,6 47,4
Slovenia 3,5 3,2 99,3 98,1 344,63 338,14 87,2 101,1
Spain 3,9 3,5 139,3 140,6 226,25 226,59 137,1 151,4
Sweden 1 1,2 96,1 97,6 224,26 218,63 90,8 89,2
United Kingdom 1,1 1 85,7 86,7 214,5 213,1 84,8 84,3
Getting more reliable results - alternative scoreboards
At this stage, we should introduce into the analysis our classification of the 13 remaining
struc-tural Lisbon indicators. The question is: do high values on these indicators constitute an asset or
a burden for the Lisbon process? The “official” interpretation is:
at risk of poverty rate negative indicator
Comparative price levels negative indicator
Energy intensity of the economy negative indicator
Total greenhouse gas emissions negative indicator
total long-term unemployment negative indicator
Volume of freight transport negative indicator
Business investment positive indicator
GDP per capita in PPS positive indicator
Gross domestic expenditure on R&D (GERD) positive indicator Labor productivity per person employed positive indicator
Total employment rate positive indicator
Total employment rate of older workers positive indicator Youth education attainment level – total positive indicator
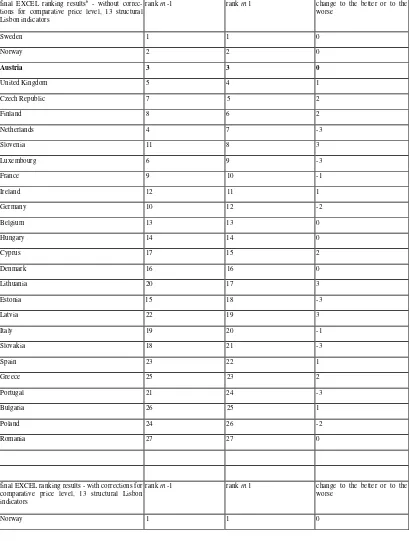
Table 4: Scoreboard ranks, Lisbon process
final EXCEL ranking results6
- without correc-tions for comparative price level, 13 structural Lisbon indicators
rank tn -1 rank tn 1 change to the better or to the
worse
Sweden 1 1 0
Norway 2 2 0
Austria 3 3 0
United Kingdom 5 4 1
Czech Republic 7 5 2
Finland 8 6 2
Netherlands 4 7 -3
Slovenia 11 8 3
Luxembourg 6 9 -3
France 9 10 -1
Ireland 12 11 1
Germany 10 12 -2
Belgium 13 13 0
Hungary 14 14 0
Cyprus 17 15 2
Denmark 16 16 0
Lithuania 20 17 3
Estonia 15 18 -3
Latvia 22 19 3
Italy 19 20 -1
Slovakia 18 21 -3
Spain 23 22 1
Greece 25 23 2
Portugal 21 24 -3
Bulgaria 26 25 1
Poland 24 26 -2
Romania 27 27 0
final EXCEL ranking results - with corrections for comparative price level, 13 structural Lisbon indicators
rank tn -1 rank tn 1 change to the better or to the
worse
Norway 1 1 0
6
Sweden 2 2 0
Finland 5 3 2
United Kingdom 6 4 2
Austria 3 5 -2
Ireland 9 6 3
Netherlands 4 7 -3
France 10 8 2
Luxembourg 7 9 -2
Germany 8 10 -2
Czech Republic 12 11 1
Slovenia 13 12 1
Belgium 11 13 -2
Denmark 14 14 0
Cyprus 16 15 1
Hungary 15 16 -1
Italy 18 17 1
Estonia 17 18 -1
Latvia 23 19 4
Lithuania 21 20 1
Spain 20 21 -1
Portugal 19 22 -3
Greece 24 23 1
Slovakia 22 24 -2
Poland 25 25 0
Bulgaria 26 26 0
Romania 27 27 0
Although the ranking results of the CER Institute and our own ranking results – without the
necessary corrections for the price level variable - closely correlate with each other, the CER
study obviously and grossly seems to overestimate the performance of Denmark, Greece,
Portu-gal and Ireland, while it underreports the performance of Italy, Lithuania, Slovenia, and the
Czech Republic. On a general level, and compared to the composite indicators, presented below,
we however come to the conclusion that the CER study systematically overstates the
perform-ance of Austria, Portugal, Estonia, and Greece, while Finland, Latvia, Spain, Luxembourg, and
Italy are performing much better than expected.
Towards a UNDP type indicator of the Lisbon process
Our combined measure of the velocity of the Lisbon transformation process, presented here for
the first time in the literature, will be of a UNDP-Indicator type, combining the thirteen different
dimensions on a uniform scale, ranging from 0 (lowest value) to 1 (highest value). It is based on
For the index
tn-1
Business investment 2003
Comparative price levels 2003
Energy intensity of the economy 2002
GDP per capita in PPS 2004
Gross domestic expenditure on R&D (GERD) 2003
Labor productivity per person employed 2004
Total employment rate 2003
Total employment rate of older workers 2003
Total greenhouse gas emissions 2002
total long-term unemployment 2003
Volume of freight transport 2003
Youth education attainment level – total 2004
for the index
tn
at risk of poverty rate, 2003
Business investment 2004
Comparative price levels 2004
Energy intensity of the economy 2003
GDP per capita in PPS 2005
Gross domestic expenditure on R&D (GERD) 2004
Labor productivity per person employed 2005
Total employment rate 2004
Total employment rate of older workers 2004
Total greenhouse gas emissions 2003
total long-term unemployment 2004
Volume of freight transport 2004
Youth education attainment level – total 2005
We were calculating each dimension index by the formula:
Actual
value
–
minimum
value
(1) dimension index = ---
Maximum
value
–
minimum
value
We were then multiplying the thirteen dimension/component indices by 1/13 and simply added
the 13 components [multiplied by 1/13] together
(2) Lisbon process index =
dimension index at risk of poverty rate [properly time-matched]* 1/13
dimension index Business investment [properly time-matched]* 1/13
dimension index Comparative price levels [properly time-matched]* 1/13
dimension index Energy intensity of the economy [properly time-matched]* 1/13
dimension index GDP per capita in PPS [properly time-matched]* 1/13
dimension index Gross domestic expenditure on R&D (GERD) [properly time-matched]* 1/13
dimension index Labor productivity per person employed [properly time-matched]* 1/13
dimension index Total employment rate [properly time-matched]* 1/13
dimension index Total employment rate of older workers [properly time-matched]* 1/13
dimension index Total greenhouse gas emissions [properly time-matched]* 1/13
dimension index Youth education attainment level – total [properly time-matched]* 1/13
[image:17.595.67.539.183.659.2]The results are:
Table 5: Heroes and villains (ECVs), UNDP indicator style, still with the untenable
as-sumption that a high comparative price level is detrimental to the Lisbon process goal
achievement
final data UNDP Lisbon Amar-tya Sen type index, tn-1 UNDP Lisbon Amar-tya Sen type index, tn DYN (UNDP Lisbon Amartya Sen type Process) heroes and villains (ECVs), tn
UNDP Lisbon Amar-tya Sen type index, tn-1 UNDP Lisbon Amar-tya Sen type index, tn DYN (UNDP Lisbon Amartya Sen type Proc-ess) heroes and villains (ECVs) : the dy-namic per-spective UNDP Lisbon Amar-tya Sen type index, tn-1 UNDP Lisbon Amar-tya Sen type index, tn DYN (UNDP Lisbon Amartya Sen type Process)
Austria 0,57844 0,56642 -0,01202 Sweden 0,6669 0,66729 0,00039 Latvia 0,47338 0,50865 0,03527
Belgium 0,51414 0,51333 -0,00081 Norway 0,64168 0,64454 0,00286
Lithua-nia
0,44215 0,4683 0,02615
Bulgaria 0,36906 0,38538 0,01633 Denmark 0,6278 0,63679 0,00899
Slove-nia
0,53879 0,56131 0,02252
Cyprus 0,45988 0,4791 0,01922 Finland 0,59513 0,5971 0,00197 Cyprus 0,45988 0,4791 0,01922
Czech Repub-lic
0,5888 0,5889 0,0001 Czech
Republic
0,5888 0,5889 0,0001 Ireland 0,49248 0,50927 0,0168
Denmark 0,6278 0,63679 0,00899
Luxem-bourg
0,5979 0,58153 -0,01636 Bulgaria 0,36906 0,38538 0,01633
Estonia 0,4785 0,46415 -0,01435 Netherlands 0,58913 0,57716 -0,01197
Den-mark
0,6278 0,63679 0,00899
Finland 0,59513 0,5971 0,00197 United
Kingdom
0,57153 0,57175 0,00022 Norway 0,64168 0,64454 0,00286
France 0,54289 0,5322 -0,0107 Austria 0,57844 0,56642 -0,01202 Finland 0,59513 0,5971 0,00197
Germany 0,5211 0,50776 -0,01334 Slovenia 0,53879 0,56131 0,02252 Greece 0,41852 0,42047 0,00195
Greece 0,41852 0,42047 0,00195 France 0,54289 0,5322 -0,0107 Spain 0,42573 0,42704 0,00131
Hungary 0,52102 0,50199 -0,01903 Belgium 0,51414 0,51333 -0,00081 Sweden 0,6669 0,66729 0,00039
Ireland 0,49248 0,50927 0,0168 Ireland 0,49248 0,50927 0,0168 United
King-dom
0,57153 0,57175 0,00022
Italy 0,42647 0,42602 -0,00046 Latvia 0,47338 0,50865 0,03527 Czech
Repub-lic
0,5888 0,5889 0,0001
Latvia 0,47338 0,50865 0,03527 Germany 0,5211 0,50776 -0,01334 Italy 0,42647 0,42602 -0,00046
Lithuania 0,44215 0,4683 0,02615 Hungary 0,52102 0,50199 -0,01903 Belgium 0,51414 0,51333 -0,00081
Luxembourg 0,5979 0,58153 -0,01636 Cyprus 0,45988 0,4791 0,01922 Poland 0,36879 0,36456 -0,00423
Netherlands 0,58913 0,57716 -0,01197 Lithuania 0,44215 0,4683 0,02615
Roma-nia
0,40082 0,39207 -0,00875
Norway 0,64168 0,64454 0,00286 Estonia 0,4785 0,46415 -0,01435 France 0,54289 0,5322 -0,0107
Poland 0,36879 0,36456 -0,00423 Spain 0,42573 0,42704 0,00131
Slova-kia
0,41591 0,40449 -0,01142
Portugal 0,40877 0,36532 -0,04345 Italy 0,42647 0,42602 -0,00046
Nether-lands
0,58913 0,57716 -0,01197
Romania 0,40082 0,39207 -0,00875 Greece 0,41852 0,42047 0,00195 Austria 0,57844 0,56642 -0,01202
Slovakia 0,41591 0,40449 -0,01142 Slovakia 0,41591 0,40449 -0,01142
Ger-many
0,5211 0,50776 -0,01334
Slovenia 0,53879 0,56131 0,02252 Romania 0,40082 0,39207 -0,00875 Estonia 0,4785 0,46415 -0,01435
Spain 0,42573 0,42704 0,00131 Bulgaria 0,36906 0,38538 0,01633
Luxem-bourg
0,5979 0,58153 -0,01636
Sweden 0,6669 0,66729 0,00039 Portugal 0,40877 0,36532 -0,04345
Hun-gary
0,52102 0,50199 -0,01903
United Kingdom
0,57153 0,57175 0,00022 Poland 0,36879 0,36456 -0,00423
Portu-gal
Table 6: Heroes and villains (ECVs), UNDP indicator style, abandoning the untenable
assumption that a high comparative price level is detrimental to the Lisbon process goal
achievement
final data with the necessary correction for compara-tive price levels UNDP Lisbon Amar-tya Sen type index, tn-1 UNDP Lisbon Amar-tya Sen type index, tn DYN (UNDP Lisbon Amartya Sen type Process) final data, ranked by perform-ance in tnUNDP Lisbon Amar-tya Sen type index, tn-1 UNDP Lisbon Amar-tya Sen type index, tn DYN (UNDP Lisbon Amartya Sen type Process) final data, ranked by dynamic perform-ance UNDP Lisbon Amar-tya Sen type index, tn-1 UNDP Lisbon Amar-tya Sen type index, tn DYN (UNDP Lisbon Amartya Sen type Process)
Austria 0,59676 0,58867 -0,00808 Norway 0,7186 0,7195 0,0009 Latvia 0,41708 0,45366 0,03658
Belgium 0,52994 0,53657 0,00663 Sweden 0,71237 0,71819 0,00582
Lithua-nia
0,38511 0,41036 0,02526
Bulgaria 0,29376 0,30846 0,0147 Denmark 0,69523 0,71371 0,01849 Slovenia 0,51586 0,53807 0,0222
Cyprus 0,46456 0,4845 0,01995 Finland 0,64343 0,65095 0,00752 Ireland 0,54181 0,56345 0,02164
Czech Repub-lic
0,53265 0,53162 -0,00103 Luxem-bourg
0,61563 0,60788 -0,00774 Cyprus 0,46456 0,4845 0,01995
Denmark 0,69523 0,71371 0,01849 Netherlands 0,60878 0,60203 -0,00675 Denmark 0,69523 0,71371 0,01849
Estonia 0,43377 0,4198 -0,01397 United
Kingdom
0,58703 0,59728 0,01025 Bulgaria 0,29376 0,30846 0,0147
Finland 0,64343 0,65095 0,00752 Austria 0,59676 0,58867 -0,00808 United
Kingdom
0,58703 0,59728 0,01025
France 0,56137 0,56166 0,00029 Ireland 0,54181 0,56345 0,02164 Finland 0,64343 0,65095 0,00752
Germany 0,54388 0,53493 -0,00895 France 0,56137 0,56166 0,00029 Spain 0,41572 0,42279 0,00707
Greece 0,40539 0,41245 0,00706 Slovenia 0,51586 0,53807 0,0222 Greece 0,40539 0,41245 0,00706
Hungary 0,47006 0,456 -0,01406 Belgium 0,52994 0,53657 0,00663 Italy 0,43975 0,4468 0,00705
Ireland 0,54181 0,56345 0,02164 Germany 0,54388 0,53493 -0,00895 Belgium 0,52994 0,53657 0,00663
Italy 0,43975 0,4468 0,00705 Czech
Republic
0,53265 0,53162 -0,00103 Sweden 0,71237 0,71819 0,00582
Latvia 0,41708 0,45366 0,03658 Cyprus 0,46456 0,4845 0,01995 Norway 0,7186 0,7195 0,0009
Lithuania 0,38511 0,41036 0,02526 Hungary 0,47006 0,456 -0,01406 France 0,56137 0,56166 0,00029
Luxembourg 0,61563 0,60788 -0,00774 Latvia 0,41708 0,45366 0,03658 Czech
Republic
0,53265 0,53162 -0,00103
Netherlands 0,60878 0,60203 -0,00675 Italy 0,43975 0,4468 0,00705 Slovakia 0,35233 0,34704 -0,00529
Norway 0,7186 0,7195 0,0009 Spain 0,41572 0,42279 0,00707 Poland 0,30952 0,30302 -0,0065
Poland 0,30952 0,30302 -0,0065 Estonia 0,43377 0,4198 -0,01397
Nether-lands
0,60878 0,60203 -0,00675
Portugal 0,3998 0,35828 -0,04152 Greece 0,40539 0,41245 0,00706
Luxem-bourg
0,61563 0,60788 -0,00774
Romania 0,3239 0,31548 -0,00843 Lithuania 0,38511 0,41036 0,02526 Austria 0,59676 0,58867 -0,00808
Slovakia 0,35233 0,34704 -0,00529 Portugal 0,3998 0,35828 -0,04152 Romania 0,3239 0,31548 -0,00843
Slovenia 0,51586 0,53807 0,0222 Slovakia 0,35233 0,34704 -0,00529 Germany 0,54388 0,53493 -0,00895
Spain 0,41572 0,42279 0,00707 Romania 0,3239 0,31548 -0,00843 Estonia 0,43377 0,4198 -0,01397
Sweden 0,71237 0,71819 0,00582 Bulgaria 0,29376 0,30846 0,0147 Hungary 0,47006 0,456 -0,01406
United Kingdom