Online Classification and Measurement of Pencils using
Image Processing Techniques
Santhosh K V
Dept of I & C E MIT Manipal
Bhagya R Navada
Dept of I & C E MIT Manipal
ABSTRACT
This paper proposes an automated method for segregating and counting the different colored pencils by non-contact method. The proposed work is carried out in LabVIEW platform based on the image processing techniques. This work consists of two parts, firstly classification of pencils and secondly counting the number of pencils. The proposed work is implemented on a conveyor running continuously, at a defined speed done without halting the conveyor. The images acquired using camera are processed using support vector machine to classify pencils based on color, and a counting algorithm is incorporated to find the specific number of each colored pencils. Results on testing showed the successful achievement of set objectives.
General Terms
Automation, Camera, Image Processing, LabVIEW, Pencils.
Keywords
Automation, Classification, Image Processing, Support Vector Machine (SVM)
1.
INTRODUCTION
Pencils are used by almost everyone, making the industry manufacturing pencils to expand production continuously. Pencil industry though a very old and sustained industry has undergone very less progress, as very less innovations has reported on the product pencil. Pencil industry produces variety of pencils with different colors, shape, and etc. in a very large number. Automatic analysis of pencils in a pencil industry is a challenging and most essential task because of its massive production.
Several, researchers have reported works on segregation, and classifications. Detection of the defective packaging of tins of cigarettes using image processing and morphological operations by identifying the individual cigarettes and a paper spoon in the packaging is reported in [1]. A fully automated image processing technique is proposed in [2] to improve measurement of suspended particles and flocs by removing out of focus flocs. In [3], some of the main tools and techniques used in the field of automatic counting of objects in digital images are discussed. A LabVIEW controlled image acquisition system is developed in [4] for automated, dynamic pupilometry and blink detection based on fire wire digital camera. Classification of the heterogeneous classes present in the hyper spectral image using a spatial classification technique incorporating a novel feature derivation method is proposed in [5]. In [6], an image segmentation technique using moment based K-Means algorithm is proposed to identify ripe tomatoes. An image processing algorithm is developed in [7] to discriminate bark from wood chips. In [8], a new method of counting total and filled spikelets simultaneously based on automatic discrimination of filled and unfilled spikelets based on bi-modal imaging is proposed.
In [9], a comparative analysis of different methods of image segmentation, namely fuzzy c-means, k-means, marker controlled watershed segmentation and region growing is reported for tumor area extraction in digital mammograms.
In [10], a methodology which provides a fast inspection of defective objects and generates a real time motion trajectory for processing conveyed objects is discussed. A multi-target tracking method is proposed in [11] which is based on adaptive motion models for counting the number of flowers in a rotating plant. In [12], gradient descent method for segmentation of retinal images of a bird is reported. In [13], a scene segmentation and pedestrian classification system using a 3-D range camera is presented. Performance analysis of matching and classification of images based on wavelet energy features for object shape recognition from tactile images is presented in [14]. Microstructure image analysis and quantification by investigating the performance of segmentation methods for automatic quantification of material phases of cast iron is reported in [15]. In [16], a technique that employs support vector machines and Gaussian mixture densities to create a generative/discriminative object classification using local image features is presented. New image descriptors that integrate color, texture, shape and wavelets for object and scene image classification are presented in [17]. In [18], an algorithm for counting frozen semen straws using image processing is proposed. An algorithm to distinguish bicycles from pedestrians to count their traffic in traffic scene using a vision based system is developed in [19]. Vehicle detection and counting system using image processing is developed in [20]. In [21], human ear detection using edge detection and template matching methods are discussed.
It is seen from the reported works [1-21], that image processing is widely used in automation of process industries. Inline to the reported works the paper proposes the use of image processing in automation of pencil industry for segregation and quantitative measurement. The proposed work utilizes the support vector machine model for classification of pencil based on the color and carryout the quantitative analysis of each color of pencils. The complete process is carried online and is a non-contact process, thus achieving automation without interruption to the production line.
The paper is organized as follows: After introduction in Section 1, a discussion on experimental setup for implementation of the proposed work is done in Section 2. Section 3 discusses the associated problem. Section 4 deals with the proposed solution. Results and analysis are given in Section 5. Finally, Section 6 discusses the conclusion.
2.
EXPERIMENTAL SETUP
a rate of 10 pencils per second. The speed of the speed motor is controlled by the user from the front panel window of the proposed LabVIEW program.
Fig 1: Conveyor system of proposed system
The pencils before being packed needs to be checked and segregated based on the color. Production line runs at a high speed making it essential for the proposed process of segregation to carry out without reducing the production line speed.
Once the pencils are segregated it is packed in separate packs. In this paper, a technique is proposed using image processing algorithms for segregation and pencil counting.
Automation in the production line is a very essential activity of a process industry. The process of automation is also used in quality check of the produced product, but quantitative measurement is also an essential and important activity.
3.
PROBLEM STATEMENT
To achieve the objectives of the proposed work it is required to choose a non-contact method for segregation of pencils, and quantitative measurement of pencils. To achieve the proposed objective following steps are involved.
a. Capture image of the pencil from the production line. b. Apply image processing technique to analyze the image
and identify the color of the pencil.
c. A technique is used to segregate the pencils based on color.
4.
PROPOSED SOLUTION
Having obtained the image of conveyor belt on which the pencils are moving it is processed to identify the color of pencils. Once the segregation of pencils are made based on the color of the pencils, it is subjected to quantitative analysis to count the number of color pencils and check whether the number of pencils in the packets is equal to the desired number. LabVIEW platform is used to carry out the proposed solution
The whole process is divided into three stages
a. Pencil color identification b. Segregation
c. Quantitative analysis
4.1
Pencil color identification
The color of pencils which are moving on the conveyor needs to be first identified. For identification of color the following process are incorporated
i. Selection of region of interest ii. Edge detection
iii. Identification of color
4.1.1
Region of Interest
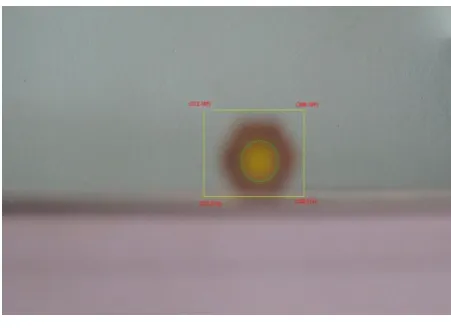
[image:2.595.315.542.244.401.2]Rectangular type of ROI with coordinate values for left, top, right, bottom is created from the entire image. Also we can use different types of ROI like point, line, oval, annulus etc. The inspection will automatically pass if measurements necessary to determine the ROI are available and the coordinates of the ROI are valid. ROI is drawn on top of an image using the operation ImageGenerateROIMask [22], [23].
Fig 2: ROI of proposed work
4.1.2
Edge detection
Edge detection refers to the process of identifying and locating sharp discontinuities in an image. The discontinuities are abrupt changes in pixel intensity which characterize boundaries of objects in a scene. Classical methods of edge detection involve convolving the image with an operator (a 2-D filter), which is constructed to be sensitive to large gradients in the image while returning values of zero in uniform regions [23-26].
Fig 3: Identification of edge
4.1.3
Identification of color
[image:2.595.315.541.510.674.2]a. Create a normalized histogram with N-bin of Hue components
b. Train the support vector machine with the available color histogram, to identify the color of the actual pencil.
4.1.3.1
Normalized histogram
H-component is used to create the histogram of the image. The image is converted into N vectors of two dimensions which are the bin position and its corresponding normalized frequency. The normalized frequency is performed in order to make the approach independent of the size of the input image.
This results in the total dimension of the input vector to be 4: bin position, frequency, first derivative of frequency, second derivative of frequency. Adding the latter two dimensions to the vector makes it more characteristic to a particular color group of images [27], [28].
4.1.3.2
Training of SVM
Support vector machine model is used to identify color of pencil by mapping histogram of unknown image to the known value. SVM model should be trained to carry out the proposed task [28-31].
Considering a set of training data about image input and output: {xik,yik}, i = 1,…….., n, where xik is input parameter
SVM (i.e. Normalized histogram value of the image whose color should be identified). yik is target output parameter of
SVM (i.e. target output of proposed technique which is the histogram of images whose color is already known). The regression function based on LSSVM is denoted as in (1).
(1)
Where:
f(x) – target output function (yik)
ϕ(x) – input function (xik)
[image:3.595.318.543.479.634.2]Where ω.Φ(x) is the inner product of ω and Φ(x), ω is the vector in high-dimensional space. b is the bias. First, the model should be trained to get the corresponding parameters of the calibration model, such as kernel function, chastisement parameter and error bias ε and so on. Second, the calibration model should make use of the training sampling data to obtain the values of ω and b. If the output error is satisfied, the training ends. Otherwise the calibration model parameters should be adjusted according to the error. Finally, the verifying sampling data should be used to verify the calibration model to determine the parameters of the calibration model.
Table 1. Summary of SVM model proposed
PARAMETERS OF THE SVM MODEL
Database 20% training for CV 40 20% training for test 40 Projection algorithm K-mean clustering
o/p dimension 50%
Input optimization Back elimination
4.2
Segregation
Once the color of the image is identified, segregation of pencils is to be done. For segregation in the proposed work three solenoid trigger guns are used. Based on a particular pencil color, respective trigger is initialized to trigger the pencil out of the conveyor.
The conveyor belt consist of three trigger guns of different tension levels so as to shoot the pencils to different conveyors running in parallel, which carry 3 different colors yellow, green and blue respectively. (But in the proposed laboratory we have placed three basket. Since, it was not economical to fabricate three conveyors in laboratory). Pink color pencil will run on the main conveyor, thus we require only three triggers. The distance between the camera and the trigger guns are fixed. Since the speed of the conveyor is controlled by the program based on user inputs, the time required for a pencil to travel from camera to trigger gun can be computed. Once the program identifies the color of the pencil, respective trigger gun is initialized to trigger so as to move the pencil to its respective conveyor. In the proposed model, only four color pencils are considered so we use three trigger guns. This can be increased or decreased based on the application.
4.3
Quantitative analysis
The proposed technique also calculates the number of pencils of each color. Once the color of pencil is identified a counter is incremented to count each color pencils respectively. We conducted test for 4 colors, count of each color pencil will be displayed on the front panel as shown in Figure 5 to Figure 8.
4.4
Implementation
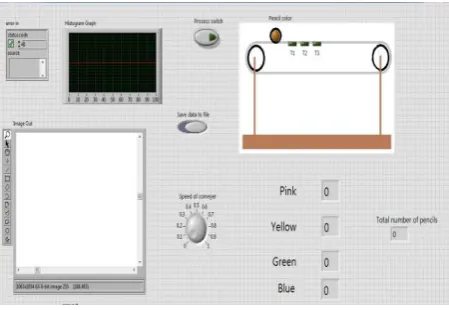
[image:3.595.51.289.595.682.2]To implement the proposed work, LabVIEW platform is used for programming. The front panel of LabVIEW [30, 31] program is as shown in Figure. 4. The front panel consists of image window which shows the image on which segregation analysis is to be applied. Four numerical indicators are place to indicate the number of pencils of each color. A push button is placed for manually stopping entire process. A numerical control is present to vary the speed of conveyor. A GUI is created on the front panel to show the result of the proposed classification program using a circular bulb on the conveyor. The bulb indicates the color of the identified pencil color. To indicate the action of segregation, three LED indicators are placed to indicate the three trigger guns. These LED’s glow as the respective trigger gun is triggered.
Fig 4: Front panel of proposed technique.
The proposed technique for segregation of pencils using image processing technique is programmed on the block diagram of LabVIEW using image processing pallets.
5.
RESULTS AND ANALYSIS
242 samples of green, and 201 samples of blue color pencils were used for testing and the proposed technique successfully identified the color of 884 samples out of tested 900 samples accurately. The proposed technique identified the 900 samples as 223 yellow, 242 pink, 240 green, and 195 blue color pencils. The results obtained for different instances are shown in Figure 5, Figure 6, Figure 7, and Figure 8 respectively.
Fig 5: Result as seen on front panel for yellow pencil
Figure 5 shows the result for 188 pencils out of which 58 pink, 52 yellow, 32 green and 46 blue color pencils are identified and also shows at that instance it is identifying a yellow color pencil thus enabling trigger T1.
Fig 6: Result as seen on front panel for pink pencil
Figure 6 shows the result for 322 pencils out of which 123 pink, 63 yellow, 58 green and 78 blue color pencils are identified and also shows at that instance it is identifying a pink color pencil thus all the triggers are disabled.
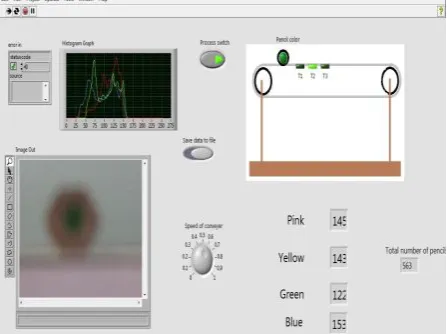
Fig 7: Result as seen on front panel for green pencil
Figure 7 shows the result for 563 pencils out of which 145 pink, 143 yellow, 122 green and 153 blue color pencils are identified and also shows at that instance it is identifying a green color pencil thus enabling the trigger T2.
Fig 8: Result as seen on front panel for blue pencil
Figure 8 shows the result for 668 pencils out of which 168 pink, 172 yellow, 160 green and 168 blue color pencils are identified and also shows at that instance it is identifying a blue color pencil thus enabling the trigger T3. From the results obtained, it is clear that the proposed technique has achieved the proposed objectives satisfactorily.
6.
CONCLUSION
An automated technique for classification and segregation of pencils based on color is reported in this paper using image processing techniques. The images once acquired are subjected to edge detection, histogram normalization for the classification of color pencils using support vector machine algorithms. Finally, on identifying the color of pencil, segregation of pencils is done using three trigger guns placed near the conveyor. Results of the proposed technique for test cases showed the successful implementation of the work with an accuracy of 98.22%.
Since the entire processing is carried on software, upgradation and modification for carrying the proposed task on similar FMCG products can be implemented easily. Efficiency of the technique can be improved in future. The work can also be extended for some more colors and also for other patterns.
7.
REFERENCES
[image:4.595.55.280.153.308.2] [image:4.595.318.542.307.466.2] [image:4.595.58.280.378.557.2]Pattern Recognition. International Journal of Signal Processing, Image Processing and Pattern Recognition, Vol. 2, No. 2, (June 2009), 31-42.
[2] Ali Keyvani, N. and KyleStrom. 2013. A fully-automated image processing technique to improve measurement of suspended particles and flocs by removing out-of-focus objects. Computers & Geosciences, Elsevier, Vol. 52, (March 2013), 189–198.
[3] Barbedo, J. G. A. 2012. A Review on Methods for Automatic Counting of Objects in Digital Images. Journal of IEEE Latin America Transactions, Elsevier Vol. 10, (September 2012), 2112-2124.
[4] John Kennedy, Schettino de Souzaa, Marcos Antonio da Silva Pintoa, Pedro Gabrielle Vieirab, Jerome Barona, B. D. and Carlos Julio Tierra-Criolloa. 2013. An open-source, FireWire camera-based Labview-controlled image acquisition system for automated, dynamic pupillometry and blink detection. Computer methods and programs in biomedicine, Elsevier, Vol. 112, (December 2013), 607-623.
[5] Kavitha, K. and Arivazhagan, S. 2010. A Novel Feature Derivation Technique for SVM based Hyper Spectral Image Classification. International Journal of Computer Applications, Vol. 1, No. 15, (2010), 25-31.
[6] Monika Bhatnagar and Prashant Kumar Singh. 2014. an Efficient Method of Image Segmentation for Harvest Time Identification”, International Journal of Computer Applications, Volume 87, No.7, (February 2014), 31-34.
[7] James R. Wooten, Filip To, S. D. Igathinathane, C. and Pordesimo, L.O. 2011. Discrimination of bark from wood chips through texture analysis by image processing. Computers and Electronics in Agriculture, Elsevier, Vol. 79, (2011), 13–19.
[8] Lingfeng Duan, Wanneng Yang, Kun Bi, Shangbin Chen, and Qingming Luo, Qian Liu. 2011. Fast discrimination and counting of filled/unfilled rice spikelets based on bi-modal imaging. Computers and Electronics in Agriculture, Vol. 75, (2011), 196–203.
[9] Zainul Abdin Jaffery, Zaheeruddin, and Laxman Singh. 2013. Performance Analysis of Image Segmentation Methods for the Detection of Masses in Mammograms. International Journal of Computer Applications, Vol. 82, No2, (November 2013), 44-50.
[10] Weyricha, M. Wanga, Y. Winkela, J. and Laurowskib, M. 2012. High Speed Vision Based Automatic Inspection and Path Planning for Processing Conveyed Objects”, Procedia CIRP, Vol. 3, Elsevier, (2012), 442 – 447.
[11] Stephan R. Harmsen and Nicole J. J. P. Koenderink. 2009. Multi-target tracking for flower counting using adaptive motion models. Computers and electronics in agriculture, Elsevier, Vol. 65, (2009), 7–18.
[12] Pushpendra Kumar, Rekha Pandit, and Vineet Richhariya. 2014. Retinal Image Segmentation by using Gradient Descent. International Journal of Computer Applications, Vol. 86, No 10, (January 2014), 1-7.
[13] Xue Wei, Son Lam Phung, and Abdesselam Bouzerdoum. 2014. Object segmentation and classification using 3-D range camera. Journal of Visual Communication and Image Representation, Vol. 25, (January 2014), 74–85.
[14] Shreyasi Dattaa, Anwesha Khasnobishb, Amit Konara, Tibarewalab, D. N. and Janarthanan, R. 2013. Performance Analysis of Object Shape Classification and Matching from Tactile Images using Wavelet Energy Features. Procedia Technology, Vol. 10, (2013), 805-812.
[15] Pattan Prakash, Mytri, V. D. and Hiremath, P. S. 2010. Active Contour Multigrid Model for Segmentation and Automatic Quantification of Material Phases of Cast Iron. International Journal of Computer Applications, Vol. 9, No.4, (November 2010),32-37.
[16] Thomas Deselaers, Georg Heigold, and Hermann Ney.2010. Object classification by fusing SVMs and Gaussian mixtures. Pattern Recognition, Elsevier, Vol. 43, (2010), 2476–2484.
[17] Sugata Banerji, N. Atreyee Sinha, and Chengjun Liu. 2013. New image descriptors based on color, texture, shape, and wavelets for object and scene image classification. Neurocomputing, Vol. 117, (2013), 173– 185.
[18] Amit R. Chavan, A. R. Shastri, R. K. Shastri, S. B. Deosarkar, 2013. Counting of Frozen Semen Straws using Image Processing. In Proceedings of third International Conference on Advances in Computing and Communications, India.
[19] Guruprasad Somasundaram, Vassilios Morellas, and Nikolaos Papanikolopoulos. 2009. Counting Pedestrians and Bicycles in Traffic Scenes. In Proceedings of the 12th International IEEE Conference on Intelligent Transportation Systems, USA.
[20] Pornpanomchai, C. Liamsanguan, and Vannakosit, V. 2008. Vehicle Detection and Counting From A Video Frame. In Proceedings of the 2008 International Conference on Wavelet Analysis and Pattern Recognition, Hong Kong.
[21] Joshi, K. V. and Chauhan, N. C. 2011. Edge Detection and Template Matching Approaches for Human Ear Detection”, International Journal of Computer Applications, special Issue on Intelligent Systems and Data Processing, (2011), 50-55,
[22] Ballard, D. H. 1981. Generalizing the Hough Transform to Detect Arbitrary Shapes. Pattern Recognition, Vol. 13, (1981), 111-122.
[23] Ballard, D. H. and Brown C, 1982. Computer Vision. Prentice Hall.
[24] Burns, J. B. Weiss, R. S. and Riseman, E. M. 1993. View Variation of Point-Set and Line- Segment Features. IEEE trans. Pattern Analysis and Machine Intelligence, Vol. 15, No. 1, (1993), 51-68.
[25] Cosgriff, R. L. 1960. Identification of Shape. Ohio State University Research Foundation, Columbus, Rep. 820-11.
[26] Cootes, T. F. and Taylor, C. J. 1992, Active Shape Models - ’Smart Snakes’. Department of Medical Biophysics, University of Manchester.
[28] Kurdthongmee, W. 2008. Colour Classification of Rubberwood boards for Finger joint Manufacturing using a SOM Neural Network and Image Processing. Journal of Computers and Electronics in Agriculture, Vol. 64, (2008), 85-92.
[29] Zhang Xuegong. 2000. Statistical learning theory and support vector machines. Journal Acta Automatica Sinica, Vol. 26, No. 1, (2000), 32-42.
[30] Suykens, J. A. K. and Vandewalle, J. 1999. Least Squares Support Vector Machine Classifiers. Kluwer Academic Publisher, Netherlands.