Modelling the Response of Transformer Winding for
Deformation Analysis
Mohd Fairouz Mohd Yousof
1,2, Tapan Kumar Saha
2, Chandima Ekanayake
21Department of Electrical Power Engineering
Universiti Tun Hussein Onn Malaysia, Parit Raja 86400, MALAYSIA.
2
School of Information Technology and Electrical Engineering The University of Queensland, St. Lucia 4067, AUSTRALIA.
1.
Introduction
Monitoring the condition of power transformer must be performed continuously to determine whether it is fit to remain online. For assessing the mechanical integrity of transformer windings, frequency response analysis (FRA) is widely-known as the best method [1]. The main problem with FRA method is to interpret the results from the comparison made to recognize whether the dissimilarity in the measurement is due to equipment sensitivity, measurement repeatability problem or deformation has really occurred. Unless the transformer tank is removed, there is still no definite answer regarding the winding actual condition.
In order to realize how physical damage on the winding could effect on its transfer function response, one must begin by understanding the model of the winding. There are several methods to model the complete transformer such as N-ladder network, multi-conductor transmission line (MTL) and hybrid MTL. N -ladder network is a popular method for modelling the winding under impulse wave and high frequency region [2, 3]. For MTL, it is mainly used to model the winding
under fast transient overvoltage and partial discharge studies [4-6]. This model uses the concept of multi-conductor transmission line for the transformer winding where each winding turn is reflected as a transmission line. The major drawback in this method is it consumes long computational time even for a small size winding. To overcome this problem, the third model which is a modification from MTL is introduced. Hybrid MTL model is proposed in [7] by combining the concept of MTL and travelling wave theory. With these available models, a comparative study is required to find out the most suitable for frequency response analysis studies and for the simulation of the winding deformation.
In this paper, three mentioned models have been studied to compare which has the highest accuracy. A prototype transformer is available for verifying the result of the models. With the most accurate model, a common deformation on the winding is simulated by changing the geometrical condition of the conductor. The response pattern between the normal and deformed winding is included.
Abstract: Power transformer is one of the most expensive and important equipment in power system network. Its internal component is exposed to possible mechanical damage due to high electromagnetic force of fault current. It is not practical to open the transformer tank merely to perform visual inspection. An effective method for solving this problem is called Frequency response analysis (FRA), which measures the internal condition of power transformer by conducting external measurement. The main challenge for this technique is to understand the measured transfer function response which is still unclear to what actually happen on the internal component. Therefore, it is essential to identify the relation between the mechanical deformation of the winding and its transfer function response. This paper discusses on three methods for modelling the transformer winding frequency response; namely n-ladder network, multi-conductor transmission line (MTL) and hybrid MTL. From the finding, the most suitable method will be used to simulate winding deformation to investigate its response pattern. Firstly, these methods were used to represent an interleaved winding based on end-to-end short circuit configuration of the FRA measurement. The corresponding model parameters were calculated based on winding construction and geometrical information. The frequency response curves of different models were compared with the measured response for verifying the model accuracy. From the comparison, it is found that MTL is the most accurate method to model the transformer winding. Finally, based on the geometrical information of a deformed winding, MTL was applied to simulate the winding response and changes on the pattern were notified. Conclusion can be drawn from these findings that, with a suitable and accurate winding modelling technique, the simulated response of a deformed winding can be obtained.
2.
Transformer Winding Models
The transformer winding can be modelled as a network of basic electrical parameters, which are capacitance, C, conductance, G resistance, R, self-inductance, L and mutual inductance, M. From these electrical parameters, there are several methods to model the transformer winding, namely N-ladder network, multi-conductor transmission line (MTL) and hybrid MTL. The following section will explain in detail regarding the approach of each method.
2.1
N
-Ladder Network
[image:2.595.309.534.154.280.2]In this model, components R, L and C are lumped together to form a single network unit. For N amount of network unit connected in series, it represents the whole winding circuit. It is a straightforward approach, but the major concern regarding the suitability of this model is the absence of mutual inductance.
Fig. 1 N-Ladder Network
In Fig. 1, Ls is the self-inductance of each disc, Rs is the skin resistance of each disc, Cs and Gcs are series capacitance and conductance of each disc and finally Cg and Gcg are capacitance and conductance between each disc to the grounding. Each network unit is representing each disc of the winding. The voltage across Rout and Rref is computed to obtain the transfer function response of the model.
2.2
MTL Model
This model uses the concept of multi-conductor transmission line for the transformer winding where each winding turn is reflected as a transmission line. The major drawback in this method is it consumes long computational time even for a small size winding. In this approach, the transformer windings are considered as a network with n number of transmission lines. The transmission line equations are coupled by first-order differential equations as [8]:
(x) (x)
dx d
ZI
V (1) (x) (x)
dx d
YV I (2)
Where V(x) and I(x) are the voltage and the current matrices, ZRsInjL and YG j
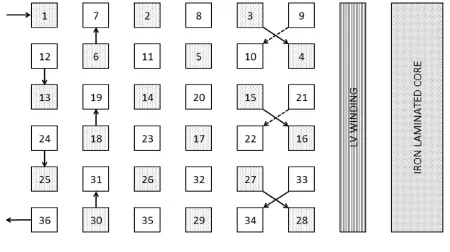
C are the impedance and admittance matrices of the winding. In is the unit matrix, Rs is the skin resistance, L is the inductance matrix, G is the conductance matrix, C is the capacitance matrix and ω is the angular frequency of the signal. The construction of Matrix C is based on thelocation of the conductor in the winding. It is comprised of capacitance between conductors in the same disc, Ct capacitance between conductors in the adjacent discs, Cd and capacitance between conductor and ground, Cg. To construct matrix C, guidelines are provided by [9] with referring to Fig. 2.
Fig. 2 Interleaved winding arrangement
For computing the input and output voltage of the winding, the voltage and current matrices are related by the admittance matrix as below [8]:
R S C C C C R S V V ZY Y ZY Y ZY Y ZY Y I I l) coth( l) ( l) ( l) coth( csch csch (3)
Where YC is the characteristic admittance and Z and Y
parameters are as defined earlier. Here, l is the winding conductor length. IS and IR are the sending and receiving
current matrices. VS and VR are the sending and receiving
voltage matrices. Equation (3) needs to be solved to obtain VS(1) and VR(n). Finally with these two values, the
transfer function of the winding can be computed as.
1 1 1 1 1 1 1 1 1 1 1 1 50 50
1
n , , n ,n n , , , n S R Φˆ Φˆ Φˆ Φˆ Φˆ Φˆ ) ( V (n) V (4)
2.3
Hybrid MTL
For this model, it is able to reduce the complexity of the MTL by the need to only model each disc of the winding rather than each conductor. Due to this reason, the size of the matrices in the algorithm is smaller than MTL result to a faster computational process. The concept of travelling wave theory is introduced in the original MTL method by equation below for computing Y matrix.
1
Q I YZ
Y n s (5)
n n n n n n n Z sM sM sM Z sM sM sM Z ) 1 ( 1 ) 1 ( 2 21 1 12 1
[image:2.595.61.283.301.387.2]
n n
n
n n
Y Q
Q Y
Q Q Y
Q Q Y
) 1 (
) 1 ( 3
32 23 2
21 12 1
0 0
0 0
0 0
Q (7)
) ,..., ,
(It2Ys1 It2Ys2 It2Ysn diag
s
Y (8)
Here In is the identity matrix. Zi consists of conductor skin effect resistance and self-inductance. Mij is the mutual inductance. Yi is the sum of capacitance and conductance between adjacent discs and to ground. Qij is the capacitance and conductance between disc i and j. lt is the total conductor length in a disc and Ysi is the inter-turn capacitance and conductance. Finally, with the same procedure as in MTL model, the voltage transfer function can be obtained. The main advantage of this model over MTL is the matrix size is based on the number of discs which will give extremely faster computational time and high accuracy especially during the matrix inversion. The only weakness in this model is it’s suffers the inability to differentiate between two types of winding.
3.
Prototype Transformer
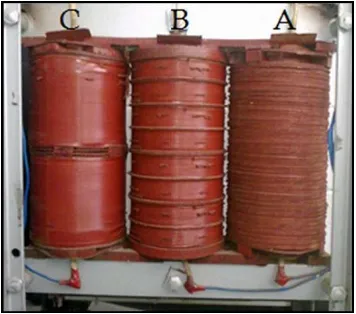
[image:3.595.64.293.73.169.2]To analyse the validity of each model in the previous section, the simulated response will be compared with the actual response obtained from the measurement. To perform the measurement, a sweep frequency response analyser, FRAX-150 will be used. The test subject for this study is a prototype transformer which consists of three phases. Measurement was conducted on the outer winding of phase A which is an interleaved arrangement.
Fig. 3 Prototype Transformer Winding
To simulate the transfer function response of the interleaved winding, geometrical information of the winding is evaluated and shown in table 1. With this available data, the electrical parameters of the winding such as Rs, Cs and Gcs can be computed and incorporate into the each model.
Table 1 Parameter of the Transformer Winding
Number of disc 40
Number of turns per disc 14 Conductor width (mm) 1.18 Conductor height (mm) 5.69 Conductor insulation thickness (mm) 0.20 Pressboard thickness between discs (mm) 2.05 Winding outer circumference (m) 0.562 Winding inner circumference (m) 0.396 Insulation thickness between HV and LV
winding (mm)
3.28
4.
Comparison between Simulation and
Measurement
[image:3.595.310.535.453.582.2]The result of comparison between measured and simulated response using N-ladder network model is shown in Fig. 4. It is clearly noticed that the simulated transfer function response of this model is not accurate from the actual measured response. The only point can be mentioned here is the similar trend of the curve slope at low frequency below 1 kHz, at medium frequency between 1 kHz and 100 kHz, and at high frequency above 500 kHz. Both responses feature the dominant anti-resonance appeared between 100 kHz to 400 kHz but did not match in frequency and magnitude. This is likely due to the flux penetration into the core is neglected in the modelling. The main reason for the overall inaccuracy is probably because of the absence of mutual inductance in the model which could results to multiple resonances occurred between 200 kHz to 400 kHz [10].
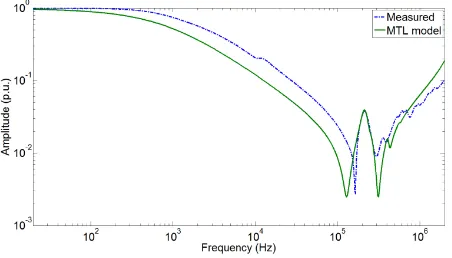
[image:3.595.85.263.482.639.2]Fig. 5 MTL model vs. measurement
[image:4.595.309.535.73.202.2]Few adjustments and improvements were made in this model to suite the interleaved winding configuration and increase the accuracy. Fig.6 shows that the simulated and measured transfer function responses match very closely. This is done by introducing a small constant value to represent the flux penetrates into the core. The simulated resonance and anti-resonance exist between 100 kHz to 400 kHz have similar magnitude and frequency. In this model, even the location of each conductor is taken into account requiring more information resulting this to be the most accurate model. This model will be used later in further development of the FRA method in this project.
Fig. 6 MTL model (with small flux penetration) vs. measurement
The result of comparison between measured and simulated response using hybrid MTL model is shown in Fig. 7. It can be clearly observed that below 100 kHz, the measured and simulated responses are well-matched in term of the slope. At around 1 MHz frequency region of the simulated response, three resonances appeared in sequential. This occurrence is usually motivated by the small value of series capacitance and normally appears in the continuous disc winding. Different winding arrangement can produce a distinct value of distribution constant, α. The behaviour of the response pattern is governed by this.
s g
C C
α (9)
Fig. 7 Hybrid MTL vs. measurement
[image:4.595.310.535.379.508.2]Hybrid MTL model also has been modified for further improve its accuracy compared to the original model developed in [7]. By modifying the distribution constant to model, the interleaved winding, result can be obtained as shown in Fig. 8. The overall shape of the simulated response shows good accuracy with the measurement especially the curve trend below 200 kHz and the dominant resonance at 200 kHz. The simulated anti-resonance occurred exactly at the same frequency as the measured one because the core-flux penetration has not been neglected in this model.
Fig. 8 Hybrid MTL (with distribution constant) vs. measurement.
Additionally, in table 2, the simulated response from each model is compared with the measured for each frequency decade. The dissimilarity is computed using statistical analysis approach. It is noticed that MTL response is consistently showed good correlation with the actual response for all frequency region especially at between 20 kHz to 2 MHz where most of information are located.
Table 2 Correlation Coefficient (CC) and Root Mean Square Error (RMSE) of each Model
Frequency Region (Hz)
N-Ladder
Network MTL Hybrid MTL
[image:4.595.62.288.388.517.2]5.
Conductor Tilting
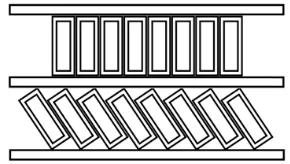
[image:5.595.310.535.72.195.2]Finally, based on the accurate winding model studied in the previous task, the tilting of conductor is simulated. The tilted winding is shown in Fig. 9 where the top disc is in normal condition, and the bottom disc has been deformed. This can happen to the winding due to high electromagnetic force acting axially. By calculating the new capacitance values for Ct, Cd and Cg, the response is simulated using MTL model.
Fig. 9 The tilting of conductor on bottom disc
Table 3 Degree of damage on the winding
Degree of
damage Tilted discs
1st 32, 34, 36, 38 and 40
2nd 22, 24, 26, 28, 30, 32, 34, 36, 38 and 40
3rd 12, 14, 16, 18, 20, 22, 24, 26, 28, 30, 32, 34, 36, 38 and 40
[image:5.595.100.245.193.275.2]In Fig. 10, the comparison between normal and deformed responses for three degrees of damage is shown. The degree of damage is classified as in table 3. The result demonstrates that, as the degree of deformation increases, the overall response will tends to shift to the lower frequency region. Furthermore, the amplitude of the resonances seems to be decreasing as the damage is getting severe. These two trends occurred in 500 kHz region will serve as the main indicator that the winding suffers conductor tilting. Additionally in Fig. 11, the correlation coefficient values between normal and deformed condition are showing a decline as the damage worsens.
Fig. 10 Normal and deformed winding responses
Fig. 11 Correlation coefficient of the responses
6.
Summary
Three methods to model the transformer winding response have been studied. With the prototype winding, FRA measurement was made and compared with the simulated response from each model. Based on all comparisons, the most accurate approach is MTL model. This model achieves the accuracy by taking into consideration of each turn in the winding. With this model, the tilting of conductor is simulated by changing the capacitance values. Three deformed winding responses showed that as the damage increases, two patterns of movement on the curve can be notice, shift to the lower frequency and reduce in amplitude. The correlation coefficient of the normal and deformed winding response also indicates that as the statistical value is reducing, the degree of damage is increasing.
References
[1] A. Kraetge, M. Kruger, and P. Fong, "Frequency response analysis - status of the worldwide standardization activities," in Condition Monitoring and Diagnosis, 2008. CMD 2008. International Conference on, 2008, pp. 651-654.
[2] M. J. Heathcore, The J & P Transformer Book, 13 ed.: Newnes, 2008.
[3] S. M. Islam, "Detection of shorted turns and winding movements in large power transformers using frequency response analysis," in Power Engineering Society Winter Meeting, 2000. IEEE, 2000, pp. 2233-2238 vol.3.
[4] L. Guishu, S. Haifeng, Z. Xile, and C. Xiang, "Modeling of Transformer Windings Under Very Fast Transient Overvoltages," Electromagnetic Compatibility, IEEE Transactions on, vol. 48, pp. 621-627, 2006.
[5] A. M. Jafari and A. Akbari, "Partial discharge localization in transformer windings using multi-conductor transmission line model," Electric Power Systems Research, vol. 78, pp. 1028-1037, June 2008.
[image:5.595.61.291.581.708.2]Winter Meeting, 2002. IEEE, 2002, pp. 1394-1399 vol.2.
[7] A. Shintemirov, W. H. Tang, and Q. H. Wu, "A Hybrid Winding Model of Disc-Type Power Transformers for Frequency Response Analysis," Power Delivery, IEEE Transactions on, vol. 24, pp. 730-739, 2009.
[8] C. R. Paul, Analysis of Multiconductor Transmission Lines, 2nd ed. New York: John Wiley & Sons, Inc, 2008.