(will be inserted by the editor)
Strain effects on the ionic conductivity of Y-doped
ceria: A simulation study
Mario Burbano · Dario Marrocchelli · Graeme W. Watson
Received: date / Accepted: date
Abstract In this paper we report a computational study of the effects of strain on the conductivity of Y-doped ceria (YDC). This material was chosen as it is of technological interest in the field of Solid Oxide Fuel Cells (SOFCs). The simulations were performed under realistic operational temperatures and strain () levels. For bulk and thin film YDC, the results show that tensile strain leads to conductivity enhancements of up to 3.5×and 1.44×, respec-tively. The magnitude of these enhancements is in agreement with recent ex-perimental and computational evidence. In addition, the methods presented
M. Burbano
School of Chemistry and CRANN Trinity College Dublin
Dublin 2 Ireland
Tel.: +353-877698113 E-mail: [email protected]
D. Marrocchelli
School of Chemistry and CRANN Trinity College Dublin
Dublin 2 Ireland
Department of Materials Science and Engineering Department of Nuclear Science and Engineering Massachusetts Institute of Technology
Cambridge, MA USA
E-mail: [email protected]
G.W. Watson
School of Chemistry and CRANN Trinity College Dublin
Dublin 2 Ireland
herein allowed us to identify enhanced ionic conductivity in the surface regions of YDC slabs and its anisotropic character.
Keywords SOFC·ceria·strain·MD
1 Introduction
Solid Oxide Fuel Cells (SOFCs) are electrochemical devices which efficiently generate electricity from a variety of fuels [1]. As such, they have the potential to play a key role in the energy production landscape in years to come [2, 3]. Significant research efforts have been focused, over the past decades, on im-proving the performance of the oxide ion conductors used either as electrolytes or cathodes in these devices [1, 4, 5]. Operating SOFCs at temperatures lower than those required by current Yttria Stabilized Zirconia (YSZ) technologies (∼1273 K) would allow for the use of cheaper materials in the fabrication of the cells, as well as, facilitating their possible use in portable electronics, e.g.µ -SOFCs [6]. In particular, Rare Earth doped ceria (REDC), Ce1−xRExO2−x/2,
where RE = Y (YDC), La (LDC), Nd (NDC), Sm (SDC), Gd (GDC), etc has been studied extensively given its relatively high ionic conductivity (σi) in the intermediate temperature range (873 K – 1073 K). This process is known to occur by means of vacancy migration in the anion sublattice [7, 8]. Equation 1 illustrates, in Kr¨oger-Vink notation, the formation of charge compensating vacancies (VO··) upon substitution of a host Ce4+ cation by a dopant RE3+ cation (RE0Ce).
RE2O3+ (CeO2)n→(CeO2)n−2+ 2RE
0
Ce+ 3O x
O+VO·· (1) The interactions between these defects can be classified as cation-vacancy, vacancy-vacancy and cation-cation [9–16]. In practice, these interactions can prove deleterious to the ionic conductivity because they decrease the number of mobile vacancies available, hence the need for high operating temperatures [17].
From its outset, much of the research within the context of electrolyte ap-plications has focused on the optimization of ionic conductivity from a com-positional point of view, i.e. the identification of the dopant species and the concentration at which defect interactions are minimized, especially those be-tween dopants and vacancies [10, 18–22]. In the case of ceria, these studies have identified RE elements, such as Gd3+, Y3+, Sm3+ and Pm3+ as the best
can-didate dopants, given that their radius mismatch with the host cation (Ce4+)
(ScSZ) [15]. This means that further improvements in the performance of IT-SOFC electrolytes must come from the exploitation of different optimization routes [2, 3, 6].
Current thin film deposition techniques allow for the fabrication of epitaxi-ally grown oxides with high levels of control over the microstructure, stoichiom-etry and lattice mismatch of individual layers [24–28]. These developments have attracted much attention to this area of research because they might open a new avenue for SOFC electrolyte optimization in a way similar to that which has been achieved in Si-based semiconductors [29]. Changes in the ionic conductivity of thin film electrolytes, whether detrimental or beneficial, are ascribed to interfacial effects present at phase boundaries. One such effect is the formation of space charge regions which have been shown to cause a dra-matic increase in the fluoride ion conductivity of BaF2/CaF2heterostructures
[30, 31]. However, the the Debye screening length of extrinsic ionic conductors, such as, doped ceria/zirconia, is too short (given that it is inversely propor-tional to the square root of the defect concentration) and, as a result, space charge regions are not expected to play an important role in these systems [24, 32, 28]. Coherent growth of a thin film on a substrate, or heterostructure, leads to strain () due to the structural mismatch which arises from differences in their lattice vectors (Equation 2).
= a1−a0
a0
(2)
Thin films can elastically accommodate strains of∼0.03, depending on the thickness of the film and the elastic properties of the material [25, 33]. Strain levels beyond this value are typically released by the films through the forma-tion of dislocaforma-tion networks, defect clustering at the interface and rotaforma-tions with respect to the substrate or other layers [34–36].
Substantial research efforts have been devoted, over the last decade, to the elucidation of how interfacial effects alter ionic conductivity. Many such stud-ies have focused on YSZ as it is the prevalent electrolyte in SOFCs. The results reported in the literature for this material show significant scatter in the range of conductivities achieved through the formation of interfaces. Experimental investigations have observed conductivity enhancements varying from a colos-sal 108increase inσ
i [37] down to neglegible changes [38] and myriad values in between [33, 39, 32, 28, 40–44]. Early theoretical work using Molecular Dynam-ics (MD) simulations found only a small enhancement inσi for YSZ mediated by a lowering of the activation barrier [45], while more recent Density Func-tional Theory (DFT) calculations have predicted a maximum enhancement of up to four orders of magnitude in this property, at 400 K for relatively high strains (= 4%) [46, 47].
(lattice mismatch of 28%) and found only a small increase in the ionic con-ductivity with respect to the bulk system [34]. Suzukiet al. [48] spin coated sapphire substrates with CeO2 thin films, as well as, GDC films of different
concentrations. Their study found that the conductivity increased with dimin-ishing film thickness. However, this change may be attributed to a lowering of the oxygen vacancy formation energy which leads to reduction of Ce4+ to
Ce3+ (Equation 3), and thus, to electronic conductivity [49].
2CexCe+ OxO↔V··O+1
2O2+ 2Ce
0
Ce (3)
This is an undesirable effect in SOFC electrolytes as it causes an internal short circuit and cell delamination through lattice expansion [50, 25, 51–55]. Similar results were obtained by Perkins et al., who saw the formation of discrete micro-domains containing Ce3+ in SDC/CeO
2 heterostructures (∼ 0.0035)
grown on MgO substrates [56]. Studies of the ionic conductivity in epitaxial SDC films grown on MgO substrates using SrTiO3 buffer layers ( ∼0.016)
found a conductivity of 0.07 S cm−1 at 973 K compared to ∼0.02 S cm−1 for
dense polycrystalline pellets at the same temperature [27]. In the case of STO-buffered SDC/YSZ heterostructures ( ∼ 0.055)) grown on MgO, the same group found a conductivity increase of two orders of magnitude with respect to SDC polycrystaline pellets and about one order of magnitude increase com-pared to either SDC or YSZ thin films [28]. A recent computational study, which employed static calculations with interatomic potentials, predicted an enhancement inσi of up to four orders of magnitude when tensile strain (= 0.040) was applied to bulk CeO2[57].
conductivity only.
2 Methods
2.1 Interatomic Potential
The computational methods used in this study are well established and have been described elsewhere for doped ceria and other oxides [60, 58, 16, 61, 62], as well as fluoride systems [63, 64]. The interatomic potential that was employed is known as the DIPole Polarizable Ion Model (DIPPIM) [65]. In this model the various ionic species are assigned their formal valence charges (Ce4+, Y3+,
and O2−) with the inclusion of the polarization effects that result from the
in-duction of dipoles on the ions. The DIPPIM parameters were derived directly from hybrid density functional theory (h-DFT) calculations using the Heyd, Scuzeria, Ernzerhof (HSE06) functional [66, 67], as implemented in the VASP code [68]. These static h-DFT calculations provided forces and dipoles of each ion, and were used to optimize the h-DIPPIM (HSE-DIPPIM) parameters. The procedure employed to generate a set of potentials for CeO2-ZrO2 solid
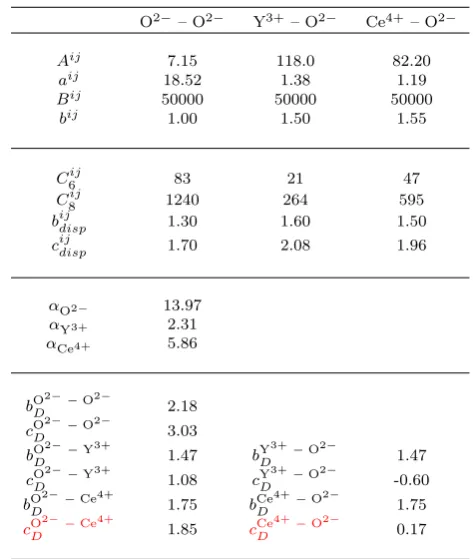
solutions doped (or reduced) with trivalent RE cations (Sc3+, Y3+, Gd3+, Sm3+, Nd3+, Ce3+, La3+) will be the subject of a future publication [69]. The inclusion of a fraction of nonlocal Hartree-Fock exchange to standard DFT in functionals such as HSE is known to be necessary to correctly describe the electronic strucuture of lanthanide oxides such as ceria [70, 71]. This is im-portant in cases where highly correlatedf-electrons are present. However, for YDC this potential represents an improvement in terms of a closer agreement to experimental lattice constants [70]. Table 1 presents the parameters for the h-DIPPIM interatomic potential used in this study.
2.2 MD Simulation Details
All Molecular Dynamics simulations were performed with an in-house code (PIMAIM) which uses three-dimensional periodic boundary conditions. The ionic conductivities of three different dopant concentrations were studied, namely Ce1−xYxO2−x/2wherex= 0.08,0.12,0.18. This choice of values
O2−– O2− Y3+– O2− Ce4+– O2−
Aij 7.15 118.0 82.20
aij 18.52 1.38 1.19
Bij 50000 50000 50000
bij 1.00 1.50 1.55
C6ij 83 21 47
C8ij 1240 264 595
bijdisp 1.30 1.60 1.50 cijdisp 1.70 2.08 1.96
αO2− 13.97
αY3+ 2.31 αCe4+ 5.86
bOD2−−O2− 2.18
cOD2−−O2− 3.03
bOD2−−Y3+ 1.47 bDY3+−O2− 1.47
cOD2−−Y3+ 1.08 cDY3+−O2− -0.60 bOD2−−Ce4+ 1.75 bDCe4+−O2− 1.75
[image:6.595.120.357.89.369.2]cOD2−−Ce4+ 1.85 cDCe4+−O2− 0.17
Table 1 Parameters for the h-DIPPIM potential. All values are in atomic units.
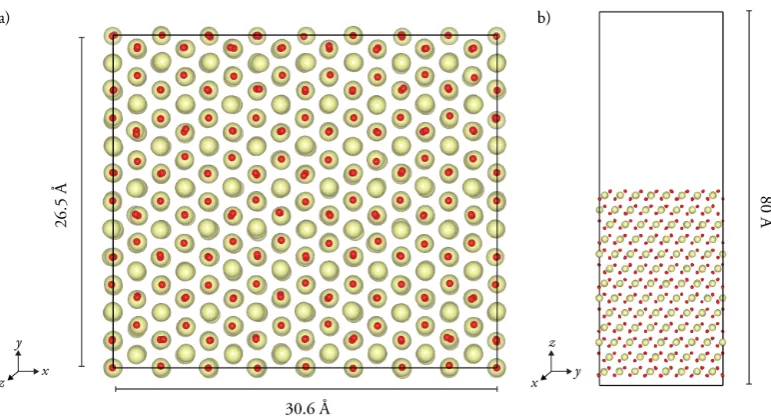
x, y ={0.007,0.014,0.021} (Picture 1a). These simulations were run in the NVT ensemble resulting in the lattice vectors along thex andy directions of the slabs being fixed while relaxation was allowed along the direction normal to the slab surface (z-axis) in order to account for the Poisson effect (Picture 1b).
Fig. 1 a) CeO2 slabxy-plane b) Slabyz-plane
Bulk Slab
xin Ce1−xYxO2−x/2 Ce Y O Ce Y O
0.08 796 68 1694 766 66 1631
0.12 762 102 1677 734 98 1615
[image:7.595.73.459.176.384.2]0.18 710 154 1651 684 148 1590
Table 2 Number of ions from each species in the bulk and slab simulation cells for each concentration of YDC.
[image:7.595.113.371.458.511.2]3 Results and discussion
3.1 Bulk YDC conductivity
Figure 2 presents the activation energies, Ea (eV), for vacancy migration in bulk YDC obtained from DIPPIM simulations using both the current pa-rameters (Table 1) and those from our previous work [58], as well as, from experimental data available in the literature. The Ea values predicted by the h-DIPPIM potential were calculated from Arrhenius plots of the ionic conduc-tivity in the temperature range 1273 K – 1673 K (NVT ensemble) for each of the three concentrations considered in this study. The previous LDA-DIPPIM (l-DIPPIM) work used 4×4×4 cells under NPT conditions [58] and a wider temperature range (1073 K – 2073 K). As expected, both sets of computational data are very similar despite being parameterized using different DFT func-tionals (h-DIPPIM shown as green circles and l-DIPPIM as black triangles). Moreover, the values from the simulations are in good agreement with the range of available experimental results (blue diamonds [75] and red squares [76]). Table 3 contains the DIPPIM calculated bulkσi (S cm−1) as a function of dopant concentration at 1473 K. Both the h-DIPPIM and the l-DIPPIM potentials predict x= 0.12 to be the ionic conductivity maximum in YDC. The same level of agreement was observed between the potentials for all tem-peratues studied. This indicates that the h-DIPPIM potential maintains the previous potential’s ability to account for the properties of YDC, but with the added advantages discussed above (Section 2). As a result, all subsequent parts of this study were performed using the h-DIPPIM potential.
σi(S cm−1) xin Ce1−xYxO2−x/2 l-DIPPIM h-DIPPIM
0.08 0.110 0.125
0.12 0.132 0.136
[image:8.595.129.355.415.466.2]0.18 0.125 0.122
Table 3 Bulk ionic conductivities,σi (S cm−1), at 1473 K from LDA (l-DIPPIM) [58, 16]
and HSE (h-DIPPIM) DIPPIM potentials (present work).
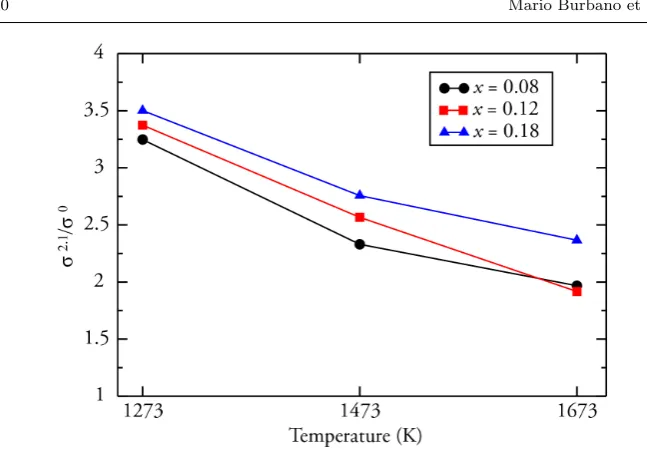
Application of isotropic strain to bulk YDC caused an increase in the ma-terial’s ionic conductivity, σi. Figure 3 presents σi of bulk Ce1−xYxO2−x/2
when = 0.021 relative to= 0.000 (σ2.1/σ0) as a function of temperature.
Fig. 2 Bulk activation energies, Ea (eV), calculated using the h-DIPPIM (green circles)
and l-DIPPIM potentials (black triangles. Experimental bulk activation energies from Ou et al.[75, 77] (blue diamonds) and Wanget al.[76] (red squares)
observed in Ea for YDC is similar to those reported by De Souzaet al. [57], who found a decrease of up to 40% for CeO2 at∼0.02. Lower temperatures
were not included in this study as they are more difficult to simulate because they require longer MD trajectories (in the order of several ns of simulation time). Unfortunately, isotropic strain is difficult to realize experimentally and is presented here due to its theoretical interest. As a consequence, the changes in conductivity experienced by YDC under these conditions will be used only as a benchmark when compared to those of anisotropically strained slabs in the next section.
Ea(eV) for
[image:9.595.80.403.71.297.2]xin Ce1−xYxO2−x/2 0.000 0.007 0.014 0.021 0.08 0.570 0.487 [-14.6] 0.397 [-30.4] 0.338 [-40.7] 0.12 0.650 0.580 [-10.8] 0.554 [-14.8] 0.392 [-39.6] 0.18 0.674 0.651 [-3.3] 0.567 [-15.9] 0.493 [-26.8]
Table 4 Activation energies, Ea(eV), as a function of strain,, for bulk YDC. The values
[image:9.595.85.395.515.567.2]Fig. 3 Ionic conductivities of bulk Ce1−xYxO2−x/2 when= 0.021 relative to= 0.000 (σ2.1/σ0) as a function of temperature. The different concentrations are indicated asx= 0.08 (black dots), 0.12 (red squares) and 0.18 (blue triangles).
3.2 YDC slabs: surface effects
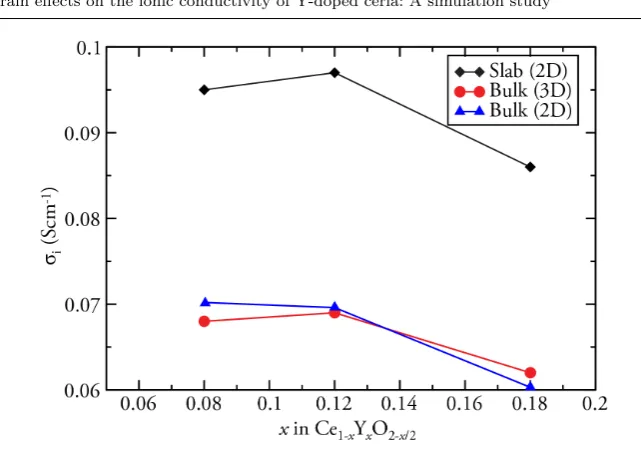
The YDC slabs discussed in this section serve as models for the study of ionic conductivity of epitaxially grown thin films, in particular, coherently grown films where the lattice mismatch does not exceed= 0.03. Figure 4 presents the 2D ionic conductivities, σi (S cm−1), at 1273 K for unstrained YDC as a function of dopant concentration for bulk (blue triangles) and slabs (black di-amonds). These conductivities were calculated from the diffusion coefficients along thex andydirections only (Dxy- 2D lateral diffusion). The MD simula-tions reveal that, for zero strain, the conductivities of the slabs are 50% higher than those of bulk YDC of the same concentration. This pattern remains un-affected when all three components of the diffusion coefficient (Dx, Dy, Dz) are included in the calculation of the conductivity of bulk YDC and when this value is obtained from the average of the conductivities along the xy, yz, xz planes (3D conductivity shown as red dots). To the authors’ knowledge, this is the first time that such a behaviour is observed in YDC. Apart from the increase in the conductivity, the behaviour of the two systems is similar, with the highest conductivity achieved for a dopant concentration ofx= 0.12.
The MD technique makes it possible to perform a detailed examination of the conductivity within each atomic layer along the z-axis of the slabs (de-limited by horizontal blue dashed lines on the left in Figure 5). The diffusion coefficients for each of these 13 layers of Ce0.88Y0.12O1.94 at 1273 K are
[image:10.595.76.400.69.296.2]Fig. 4 2D (lateral) ionic conductivities,σi (S cm−1), for unstrained bulk (blue triangles)
and slabs (black diamonds) as a function of dopant concentration at 1273 K. Bulk 3D ionic conductivities are shown as red dots.
aligned to their corresponding layers). It is immediately clear that the layers with exposed surfaces show a significantly higher conductivity (∼4×) than the bulk region of the slab, with the lowest conductivities seen in the subsur-face layers. The diffusion coefficient for bulk YDC of the same concentration as the slab is shown for comparison (vertical red dashed line). The increased conductivity in the surface regions is likely due to the more disordered atomic configurations observed in these layers. This higher degree of disorder is evi-dent when the positions of the oxide anions on the surface regions (solid blue circle in Figure 5) are compared to those in the low conductivity subsurface (dashed black circle in Figure 5).
3.3 YDC slabs: strain effects
All combinations of strains, where x, y = {0.007,0.014,0.021}, were ap-plied to the YDC slabs. However, it was found that, although the conduc-tivity tended to increase whenever there was strain along either direction, the change was generally larger whenx=y (which is to be expected since YDC adopts a cubic fluorite structure). For this reason, we will only report strain where x =y for the slabs. In Figure 6 we report the conductivity vs strain for Ce1−xYxO2−x/2 slabs at 1273 K, wherex = 0.08 (black dots), 0.12 (red
[image:11.595.80.401.71.297.2]dis-Fig. 5 3D diffusion coefficients for each atomic layer along thez-axis for Ce0.88Y0.12O1.94 at 1273 K (black dots). The vertical red dashed line indicates the bulk conductivity at the same dopant concentration and temperature. Attention is drawn to the high degree of disorder in anion sublattice on surface layers (solid blue circle) compared to the ordered subsurface layers (dashed black circle).
plays the highest conductivity. The inset shows the change in conductivity of the same YDC systems whenx=y = 0.021 with respect to the unstrained slabs (σ2.1/σ0) for all temperatures under study. As was seen in bulk YDC
(Figure 3), applying strain to YDC causes a larger increase in conductivity at lower temperatures. In the case of slabs, this change corresponds to a 1.44×
[image:12.595.68.523.64.413.2]energies, Ea (eV), of the YDC slabs (Table 5) decrease as the strain increases, nevertheless, these changes are not as pronounced as was the case of bulk YDC (Table 4), especially when= 0.021. Again, since the ionic conductivity is an activated process, the conductivity enhancement is expected to be higher at lower temperatures, as observed by Kushima and Yildiz for YSZ [46, 47].
Fig. 6 Ionic conductivities of Ce1−xYxO2−x/2slabs at 1273 K as a function of strain. The different concentrations are indicated asx= 0.08 (black dots), 0.12 (red squares) and 0.18 (blue triangles). Inset: 2D ionic conductivities of Ce1−xYxO2−x/2 slabs whenx =y =
0.021 relative tox=y= 0.000 (σ2.1/σ0) as a function of temperature.
Ea(eV) forx=y
[image:13.595.82.406.181.406.2]xin Ce1−xYxO2−x/2 0.000 0.007 0.014 0.021 0.08 0.511 0.479 [-6.3] 0.477 [-6.6] 0.419 [-18.1] 0.12 0.608 0.528 [-13.2] 0.510 [-16.1] 0.504 [-17.1] 0.18 0.691 0.643 [-6.9] 0.588 [-14.9] 0.499 [-27.7]
Table 5 Activation energies, Ea(eV), as a function of strain,, for YDC slabs. The values
in square brackets correspond to the percentage change with respect to the activation energy without strain for a given concentration.
[image:13.595.78.403.500.551.2]de-composed into the individual components along each Cartesian direction. The values reported in Table 6 correspond to the diffusion coefficients along the x (Dx), y (Dy) and z (Dz) directions for biaxially strained Ce0.88Y0.12O1.94
slabs and isotropically strained bulk (square brackets) of the same concentra-tion. The results show that Dxand Dy increase more slowly in the slabs than they do in bulk when strain is applied. This anisotropy likely arises from the compression along thez direction of the slabs (Poisson effect). The Dz values of our simulation slabs are constrained by the non-periodicity along this direc-tion and they will ultimately tend to zero as a result, provided the simuladirec-tion time is long enough. However, in the timescales presented here the results in-dicate that the relaxation perpendicular to the surface plane does not lead to a diffusion enhancement.
x =y Dx(10−8cm2/s) Dy(10−8cm2/s) Dz(10−8cm2/s)
[image:14.595.102.383.248.302.2]0.000 33.5 [23.0] 33.7 [26.8] 23.3 [24.4] 0.007 38.1 [42.9] 37.5 [42.4] 24.5 [39.9] 0.014 40.5 [59.2] 44.1 [62.5] 25.4 [59.1] 0.021 49.3 [89.8] 47.1 [89.9] 26.7 [87.0]
Table 6 Slab diffusion coefficients along each Cartesian axis for Ce0.88Y0.12O1.94at 1273 K under different strain,, levels. Isotropically strained bulk diffusion coefficients are shown in square brackets for comparison.
4 Conclusions
of high crystallographic quality and found only a limited impact on the ionic conductivity from tensile strain [28, 38].
References
1. R.M. Ormerod, Chem. Soc. Rev.32, 17 (2003)
2. E.D. Wachsman, C.A. Marlowe, K.T. Lee, Energy Environ. Sci.5(2), 5498 (2012) 3. E.D. Wachsman, K.T. Lee, Science334(6058), 935 (2011)
4. B.C.H. Steele, Solid State Ionics134(1-2), 3 (2000) 5. J.B. Goodenough, Annu. Rev. Mater. Res.33, 91 (2003) 6. J.L. Rupp, Solid State Ionics207(0), 1 (2012)
7. H.L. Tuller, A.S. Nowick, J. Electrochem. Soc.122(2), 255 (1975) 8. H.L. Tuller, A.S. Nowick, J. Phys. Chem. Solids38(8), 859 (1977)
9. A. Bogicevic, C. Wolverton, G.M. Crosbie, E.B. Stechel, Phys. Rev. B64, 014106 (2001) 10. A. Bogicevic, C. Wolverton, Phys. Rev. B67(2), 024106 (2003)
11. A. Navrotsky, P. Simoncic, H. Yokokawa, W. Chen, T. Lee, Faraday Discuss.134, 171 (2007)
12. F. Pietrucci, M. Bernasconi, A. Laio, M. Parrinello, Phys. Rev. B78(9), 094301 (2008) 13. A. Navrotsky, J. Mater. Chem.20(47), 10577 (2010)
14. S.T. Norberg, S. Hull, I. Ahmed, S.G. Eriksson, D. Marrocchelli, P.A. Madden, P. Li, J.T.S. Irvine, Chem. Mater.23(6), 1356 (2011)
15. D. Marrocchelli, P.A. Madden, S.T. Norberg, S. Hull, Chem. Mater.23(6), 1365 (2011) 16. M. Burbano, S.T. Norberg, S. Hull, S.G. Eriksson, D. Marrocchelli, P.A. Madden, G.W.
Watson, Chem. Mater.24(1), 222 (2012)
17. C.T. Chen, S. Sen, S. Kim, Chem. Mater.24(18), 3604 (2012)
18. V. Butler, C.R.A. Catlow, B.E.F. Fender, J.H. Harding, Solid State Ionics 8(2), 109 (1983)
19. J. Kilner, Solid State Ionics8(3), 201 (1983)
20. G.B. Balazs, R. Glass, Solid State Ionics76(1-2), 155 (1995)
21. H. Hayashi, R. Sagawa, H. Inaba, K. Kawamura, Solid State Ionics131(3-4), 281 (2000) 22. D.A. Andersson, S.I. Simak, N.V. Skorodumova, I.A. Abrikosov, B. Johansson, Proc.
Natl. Acad. Sci. U. S. A.103, 3518 (2006)
23. B. Wang, R.J. Lewis, A.N. Cormack, Acta Mater.59(5), 2035 (2011)
24. E. Fabbri, D. Pergolesi, E. Traversa, Science and Technology of Advanced Materials 11(5), 054503 (2010)
25. J. Santiso, M. Burriel, J. Solid State Electrochem.15, 985 (2011)
26. A. Orsini, P. Medaglia, S. Sanna, E. Traversa, S. Licoccia, A. Tebano, G. Balestrino, Superlattices Microstruct.46, 223 (2009)
27. S. Sanna, V. Esposito, D. Pergolesi, A. Orsini, A. Tebano, S. Licoccia, G. Balestrino, E. Traversa, Adv. Funct. Mater.19(11), 1713 (2009)
28. S. Sanna, V. Esposito, A. Tebano, S. Licoccia, E. Traversa, G. Balestrino, Small6(17), 1863 (2010)
29. M. Chu, Y. Sun, U. Aghoram, S.E. Thompson, Annu. Rev. Mater. Res. 39(1), 203 (2009)
30. N. Sata, K. Eberman, K. Eberl, J. Maier, Nature408(6815), 946 (2000) 31. D. Sayle, J. Doig, S. Parker, G. Watson, Chem. Comm. pp. 1804–1806 (2003) 32. S. Azad, O.A. Marina, C.M. Wang, L. Saraf, V. Shutthanandan, D.E. McCready, A.
El-Azab, J.E. Jaffe, M.H. Engelhard, C.H.F. Peden, S. Thevuthasan, Appl. Phys. Lett. 86(13), 131906 (2005)
33. C. Korte, A. Peters, J. Janek, D. Hesse, N. Zakharov, Phys. Chem. Chem. Phys.10(31), 4623 (2008)
34. L. Chen, C.L. Chen, X. Chen, W. Donner, S.W. Liu, Y. Lin, D.X. Huang, A.J. Jacobson, Appl. Phys. Lett.83, 4737 (2003)
35. D.C. Sayle, S.A. Maicaneanu, G.W. Watson, J. Am. Chem. Soc.124, 11429 (2002) 36. D. Sayle, C. Catlow, N. Dulamita, M. Healy, S. Maicaneanu, B. Slater, G. Watson, Mol.
Simul.28, 683 (2002)
37. J. Garcia-Barriocanal, A. Rivera-Calzada, M. Varela, Z. Sefrioui, E. Iborra, C. Leon, S.J. Pennycook, J. Santamaria, Science321(5889), 676 (2008)
39. I. Kosacki, C.M. Rouleau, P.F. Becher, J. Bentley, D.H. Lowndes, Solid State Ionics 176, 1319 (2005)
40. N. Schichtel, C. Korte, D. Hesse, J. Janek, Phys. Chem. Chem. Phys. 11(17), 3043 (2009)
41. M. Sillassen, P. Eklund, N. Pryds, E. Johnson, U. Helmersson, J. Bøttiger, Adv. Funct. Mater.20(13), 2071 (2010)
42. T.X.T. Sayle, S.C. Parker, D.C. Sayle, J. Mater. Chem.16(11), 1067 (2006) 43. X. Guo, Science324(5926), 465 (2009)
44. X. Guo, Scr. Mater.65(2), 96 (2011)
45. K. Suzuki, M. Kubo, Y. Oumi, R. Miura, H. Takaba, A. Fahmi, A. Chatterjee, K. Teraishi, A. Miyamoto, Appl. Phys. Lett.73(11), 1502 (1998)
46. A. Kushima, B. Yildiz, ECS Transactions25(2), 1599 (2009) 47. A. Kushima, B. Yildiz, J. Mater. Chem.20(23), 4809 (2010)
48. T. Suzuki, I. Kosacki, H.U. Anderson, Solid State Ionics151(1-4), 111 (2002) 49. H.L. Tuller, Solid State Ionics131, 143 (2000)
50. A. Atkinson, T. Ramos, Solid State Ionics129, 259 (2000)
51. S. Hull, S.T. Norberg, I. Ahmed, S.G. Eriksson, D. Marrocchelli, P.A. Madden, J. Solid State Chem.182, 2815 (2009)
52. B. Steele, A. Heinzel, Nature414, 345 (2001)
53. D. Marrocchelli, S.R. Bishop, H.L. Tuller, B. Yildiz, Adv. Funct. Mater.22, 1958 (2012) 54. D. Marrocchelli, S.R. Bishop, H.L. Tuller, G.W. Watson, B. Yildiz, Phys. Chem. Chem.
Phys.14, 12070 (2012)
55. S.R. Bishop, D. Marrocchelli, W. Fang, K. Amezawa, K. Yashiro, G.W. Watson, Energy Environ. Sci.6, 1142 (2013)
56. J.M. Perkins, S. Fearn, S.N. Cook, R. Srinivasan, C.M. Rouleau, H.M. Christen, G.D. West, R.J.H. Morris, H.L. Fraser, S.J. Skinner, J.A. Kilner, D.W. McComb, Adv. Funct. Mater.20(16), 2664 (2010)
57. R.A. De Souza, A. Ramadan, S. Horner, Energy Environ. Sci. pp. 5445–5453 (2012) 58. M. Burbano, D. Marrocchelli, B. Yildiz, H.L. Tuller, S.T. Norberg, S. Hull, P.A. Madden,
G.W. Watson, J. Phys.: Condens. Matter23(25), 255402 (2011)
59. B. Li, J. Zhang, T. Kaspar, V. Shutthanandan, R.C. Ewing, J. Lian, Phys. Chem. Chem. Phys.15(4), 1296 (2013)
60. D. Marrocchelli, P.A. Madden, S.T. Norberg, S. Hull, J. Phys.: Condens. Matter21(40), 405403 (2009)
61. D. Marrocchelli, M. Salanne, P.A. Madden, J. Phys.: Condens. Matter22(15), 152102 (2010)
62. M. Wilson, S. Jahn, P.A. Madden, J. Phys.: Condens. Matter16(27), S2795 (2004) 63. R. Heaton, R. Brookes, P. Madden, M. Salanne, C. Simon, P. Turq, J. Phys. Chem. B
110(23), 11454 (2006)
64. M. Salanne, C. Simon, P. Turq, P. Madden, J. Fluorine Chem.130(1), 38 (2009) 65. P.A. Madden, R. Heaton, A. Aguado, S. Jahn, J. Mol. Struct.: THEOCHEM771(1-3),
9 (2006)
66. J. Heyd, G.E. Scuseria, M. Ernzerhof, J. Chem. Phys.118(18), 8207 (2003)
67. A.V. Krukau, O.A. Vydrov, A.F. Izmaylov, G.E. Scuseria, J. Chem. Phys. 125(22), 224106 (2006)
68. J. Paier, M. Marsman, K. Hummer, G. Kresse, I.C. Gerber, J.G. Angyan, The Journal of Chemical Physics124(15), 154709 (2006)
69. M. Burbano, D. Marrocchelli, M. Salanne, P. Madden, G. Watson, (In Preparation) 70. J.L.F. Da Silva, M.V. Ganduglia-Pirovano, J. Sauer, V. Bayer, G. Kresse, Phys. Rev.
B75(4), 045121 (2007)
71. R. Gillen, S.J. Clark, J. Robertson, Phys. Rev. B87, 125116 (2013) 72. G.J. Martyna, D.J. Tobias, M.L. Klein, J. Chem. Phys.101(5), 4177 (1994) 73. H. N¨orenberg, G. Briggs, Surf. Sci.424, L352 (1999)
74. M. Nolan, S.C. Parker, G.W. Watson, Surf. Sci.595(1-3), 223 (2005)
75. D.R. Ou, T. Mori, F. Ye, M. Takahashi, J. Zou, J. Drennan, Acta Mater.54(14), 3737 (2006)
76. D.Y. Wang, D. Park, J. Griffith, A. Nowick, Solid State Ionics2(2), 95 (1981) 77. X. Changrong, inGreen Chemistry and Chemical Engineering(CRC Press, 2008), pp.
![Table 3 Bulk ionic conductivities, σi (S cm−1), at 1473 K from LDA (l-DIPPIM) [58,16]and HSE (h-DIPPIM) DIPPIM potentials (present work).](https://thumb-us.123doks.com/thumbv2/123dok_us/8798373.912757/8.595.129.355.415.466/table-ionic-conductivities-dippim-dippim-dippim-potentials-present.webp)