Journal of the Statistical and Social Inquiry Society of Ireland Vol. XXXVI
ASTATISTICAL PROFILE OF IRISH DOMESTIC TOURISM,2000-2005
S. MacFeely∗
Central Statistics Office
(read before the Society, 1 March 2007)
__________________________________________________________
Abstract: The 2000–2005 period was a turbulent one for the tourism industry. Yet despite shocks like September 11 and the outbreak of Foot and Mouth disease, domestic tourism has not only survived but also apparently thrived, with a nominal growth in trips and expenditure of 31% and 65% respectively. This paper attempts to put this increase in domestic tourism into perspective and examine some of the driving forces behind the growth, such as population, immigration, employment, income and price. The paper also highlights structural changes occurring on the supply side, such as the decline of the B&B sector and the emergence of holiday homes as an important sector. It also demonstrates the magnetic pull of the Greater Dublin Area on business tourism and highlights the differing tourism patterns associated with different age groups or whether children are involved or not. It is also argued that domestic tourism is less vulnerable to external shocks than inbound and outbound tourism and advocates that same day visits are perhaps far more important to domestic and national tourism than previously realised.
Keyword: Tourism JEL Classification: L83
1. INTRODUCTION
The 2000–2005 period has been a challenging time for tourism. International events, such as September 11, the London and Madrid bombings, SARS, the Afghan and Iraq Wars, the Stephen’s Day Tsunami, Hurricane Katrina and Avian flu have all served to reinforce just how globally influenced and delicate the tourism product is. Despite all these challenges, international tourism continues to grow inexorably and now claims to be the largest traded service on the planet.
The internal tourism market in Ireland would not appear to be an exception to this rule. In addition to the events above, in recent years the Irish tourism industry has had to contend with the uncertainties posed by the appearance and disappearance of new airlines and routes, the emergence of a peaceful Northern Ireland as a new entrepot and doorstep competitor and the threat of Foot and Mouth disease. Yet, in spite all these events, this fragile and globally exposed market has shown a remarkable resilience and has continued to thrive.
2. THE PURPOSE OF THIS PAPER
The purpose of this paper is twofold. The first is to introduce some new Household Travel Survey (HTS) data, which is the primary source of information on domestic tourism in Ireland. The second is to highlight some gaps in tourism statistics, particularly statistics relating to domestic tourism, that until recently had not been thought to be particularly important.
Broadly speaking Irish tourism can be categorised in to three distinct markets: Inbound tourism (foreign tourists coming to Ireland); Outbound (Irish tourists going abroad); and, Domestic tourism (Irish tourists staying in Ireland). This paper will focus on the Irish domestic tourism market.
The HTS measures National tourism (i.e. Domestic + Outbound tourism) on the demand side. Six years of HTS data have now been compiled and published, and given the events that have unfolded during those years, it is timely to examine these data and see if there are lessons to be learned.
Although the HTS data are available on a quarterly basis, the bulk of the data discussed and presented in this paper are annual data only. While this hides some of the flavour, it allows us to examine larger data aggregates and volumes of data, thus making any analysis and conclusions more robust. This is particularly important for cross-classification analysis, where the sample sizes are not sufficiently large to ordinarily support such scrutiny on a quarterly basis.
3. DEFINING DOMESTIC TOURISM
The UN-WTO1 defines “tourism” as the activities of persons travelling to and staying in places outside their usual environment for not more than one consecutive year for leisure, business and other purposes not related to the exercise of an activity remunerated from within the place visited. So tourism, as defined by the UN-WTO, encompasses most short-term travel away from a person’s normal place of work or residence and includes not just holiday, leisure and recreational travel but also travel for the purposes of visiting friends and relatives, business, education, religious, health or other reasons.
The term “activity remunerated from within the place visited” is an important part of this definition as it draws the distinction between business and work. Trips taken for the purposes of work, where clearly distinguishable from business trips, should be excluded. However drawing a clear distinction between work and business in practice is not straightforward; more about this in part 4.
The source data for this paper is primarily taken from the CSO HTS and covers the six-year period 2000 to 2005. The HTS measures National tourism, which is comprised of Outbound and Domestic tourism together, i.e. the tourist activities of Irish residents. Supplementary data supplied by Fáilte Ireland on the supply of collective accommodation were also used.
Domestic tourism is made up of two discrete segments; Overnight visits and Same-Day visits. The HTS only measures Overnight visits. For the purpose of the HTS, an overnight visitor is defined as any Irish resident who travels outside their usual environment for a period of less than 12 months, stays at least one night in collective or private accommodation and whose main purpose of trip is not work. Consequently, a number of short distance and regular trips are outside the scope of the HTS,2 such as commuting to work etc.
1
United Nations – World Tourism Organisation
4. A BRIEF DESCRIPTION OF THE HOUSEHOLD TRAVEL SURVEY
The HTS was first launched by the CSO in the first quarter of 2000 and first results were published on December 19, 2003 (Q1 2000 – Q1 2003). The survey covers all non-routine, non-work overnight trips, both domestic and international.
Data is collected via postal survey. The questionnaire has 3 sections. Part A establishes Household Composition, i.e. the number of persons in the household, their ages and their gender. Relationships between members of the household are not established. These data are required whether any trips were taken by members of the household or not. Part B determines if any overnight trips were taken. Finally Part C, relevant only to those households where overnight trips were taken. The following variables are requested:
1. Destination (main country if outbound or county if domestic) 2. Who went (number of persons and who they were)
3. When (month of departure) 4. Why (main purpose of journey)
5. Length of trip (the number of nights spent away from home) 6. Accommodation (main)
7. How the trip was booked 8. Transport used (main) 9. Total expenditure
10. Pre-payments made in advance.
For all variables, the survey asks respondents to provide details of the “main” event. So if multiple destinations are visited or if multiple forms of accommodation or transport are used we attribute the full trip to a single destination, purpose, accommodation or transport type. When the HTS was first launched, information on second and third destinations were also collected but these variables were discontinued. For the majority of trips, where second and third destinations were listed, they were the same as the first, i.e. the level of destination coding was too aggregated to capture the secondary destinations in any useful way (e.g. Spain was the first and second destination). It should be noted that all expenditure is attributed to the primary destination, and this expenditure is divided over all participants on the trip equally, i.e. children spend as much as adults.
Since Q3 2006, a question on port of departure and a question on how many nights (if any) on an outbound trip were spent in Ireland, en route to, or returning from a trip abroad. These questions only apply to outbound trips and don’t apply to domestic trips. A Part D has also been added, asking respondents to detail their total expenditure, for their last reported trip, into the following breakdowns:
1. Package
2. Other accommodation (not included in package) 3. Other transportation (not included in package) 4. Other excursions/tours (not included in package) 5. Other food (not included in package)
6. Shopping
7. Total expenditure.
households wedded to a steadily falling response rate, from 67% in 2000 to 53% in 2005, it was decided in Q4 2005 to boost the sample to 13,000 households per quarter. On receipt, the forms are scanned and then a small number of micro and macro edits and imputation (e.g. business expenditure) are completed.
Survey results are grossed to population by using a two stage weighting process. In stage 1, the survey results are weighted to household population estimates classified by household type (i.e. number of persons aged 18 or more) and region (at NUTS 3 or planning region level). These household population estimates are sourced from the QNHS.3 The Electoral Register cannot be used as a grossing frame, as it is a fairly static register and does not adequately capture the growth or distribution of the population on a quarterly basis.
Response rates for the HTS have never been particularly enviable, although for a postal survey they are still quite good. During 2000, some follow up studies of non-respondents were conducted to try and determine whether non-respondents had simply not responded or had not actually travelled and didn’t feel the survey applied to them. These studies were inconclusive. Fortunately, from the frontier tourism surveys we know the volume of outbound Irish tourism. Comparing these datasets, it was clear that the HTS under reports outbound traffic by roughly 15%. A clear seasonal pattern has been identified to this under reporting, which is always higher during Q4 and Q1. Consequently in stage 2, the international or outbound HTS results are calibrated with the outbound tourism frontier survey results. The same calibration is also applied to domestic tourism results.
As noted earlier, drawing a clear distinction between work and business is not a simple or straightforward matter. From the point of view of the Household Travel Survey data, there has always been a concern that the Business and Other categories may have contained an element of work. For example, if a respondent undertook an atypical trip for the purposes of work, that trip may still have been reported (even if the distinction between business and work was understood) as the respondent considered it atypical, or perhaps the trip contained an element of leisure despite the main purpose of the journey being work. As the HTS is a postal survey, unclear, peculiar or partial responses cannot be validated with the respondent.
In Q4 2005, the HTS questionnaire was amended, to make an explicit reference to work. The category “Business” was changed to “Business/Work”. In that quarter, trips for the purposes of Business did appear to increase by an unusually high degree, whereas the number of “Other” trips taken decreased by a higher than usual amount. On the face of it, this would appear to confirm suspicions that there may have been confusion on how to deal with work trips. That said, it is early days, so no clear conclusions can be drawn yet. For the purposes of this paper, I have ignored any effects this change might have had on Q4 2005, and have made no attempt to adjust the data i.e. business trips for all periods of 2005 are being treated as comparable.
5. THE DOMESTIC MARKET
During the period 2000–2005, some 39 million domestic trips involving an overnight stay away from home were taken and almost 139 million nights were spent away from home. The number of domestic trips grew from just over 5.4 million in 2000 to almost 7.2 million in 2005, a growth of almost 1.7 million trips per annum or 31%.
With the reasonably steady fall in the Average Length of Stay over the six years, nights spent resulted in a less spectacular but none the less impressive growth of 19% or almost 4 million nights per annum, rising from 20.7 million in 2000 to almost 24.7 million in 2006.
Of the 39 million domestic trips taken during 2000–2005, almost 18 million of these, or roughly 45% of all trips were considered to be holidays by the participants. A further 13 million or 34% were spent visiting friends and relatives (VFR). Assuming that visiting relatives is not a chore and could be considered a leisure activity then almost 31 million or 79% of all trips were taken for recreational purposes. Extending this assumption to nights, then over 114 million or 82% of nights spent away from home were considered to be recreational.
Trips % Share Trips % Share Trips % Share
000's 000's 000's
Total Domestic - Trips 5,478 7,173 39,068
Holiday 2,516 45.9 3,348 46.7 17,660 45.2
Business 554 10.1 770 10.7 3,802 9.7
Visiting Friends/Relatives 1,800 32.9 2,298 32.0 13,158 33.7
Other 607 11.1 757 10.6 4,446 11.4
[image:5.595.99.497.197.338.2]2000 2005 2000 - 2005
Table 1: Domestic trips by Reason for Journey, 2000 - 2005
As noted in the introduction, tourism had to contend with a number of shocks in recent years, but most notably the September 11 atrocities and the outbreak of Foot and Mouth disease during 2001. In fact in 2003, Enterprise Ireland noted the significant effect these events had on tourism in their economic outlook (Enterprise Ireland, 2003). In the case of Foot and Mouth disease, it is arguable that it had a more significant effect on tourism than it did on agriculture (Deegan et al, 2006). What is interesting however is the performance of the domestic tourism market compared with that of the inbound market.
Not only has domestic tourism outperformed the inbound performance by a factor of 3 (i.e. 31% growth versus 11% growth) during the period in question but during 2001, the black year for tourism, when foreign tourists stayed at home and inbound tourism faltered, the domestic market kept the tourism industry afloat. In fact, not only did domestic tourism hold ground but grew by a staggering 15% on the previous year. Of course, comparing trips is simplistic and overstates the performance of the domestic market in real terms (i.e. expenditure), as these are very different markets with significantly different average length of stays; 3.5 nights for domestic tourism as against 7.3 nights for inbound. Nevertheless, the basic point holds true, domestic tourism is less exposed to external shocks.
Figure 1: Domestic and Inbound Trips 2000 - 2005
5,000 5,500 6,000 6,500 7,000 7,500
2000 2001 2002 2003 2004 2005
000's
Total Inbound
[image:5.595.104.490.567.742.2]6. DOMESTIC TOURIST EXPEDITURE
Between 2000 and 2005, €5.6 billion was spent by domestic tourists in Ireland. In that time, annual tourist expenditure saw a dramatic increase, rising from €707 million in 2000 to €1,165 million in 2005 – a growth of 65%. Not surprisingly, recreational tourism (Holidays + VFR) accounted for the lion’s share of this. But despite generating 82% of total bed-nights, the €4.1 billion spent on recreational tourism only accounted for 72% of total domestic tourist spend.4
Business tourism had the highest growth in expenditure over the six years, growing from €110 million to €188 million, an increase of 72%. Considering that business travel experienced the highest growth in trips of all the Reason for Journey categories this is not entirely surprising. But Business travel has also had consistently by far and away the highest average per diem spend of all the categories. Over the 2000–2005 period, business per diems averaged €87.60 per person, almost twice the average per diem spend for domestic holidays over the same period.
The 30-59 age group accounted for almost €3.1 billion of the total spend for the six years or 54% of all expenditure, despite only accounting for 46% of all nights spent. Their average per diem spend was typically €7.40 higher than the average per diem for all domestic tourists.
However, it is the 60 years and over age group that had the highest growth in expenditure, almost doubling from €103 million to €203. This saw their contribution to total expenditure grow from 14.5% to 17.5%.
The 20-29 age group not only had the lowest volume of domestic travel but also had the lowest growth and the lowest total spend. That said, their per diem spend was consistently the highest of all the age groups. Over the 2000–2005 period, their daily spend was on average €10 higher than the 30-59 age group, the next highest spenders.
Trips involving adults and children (i.e. persons aged less than 18) accounted for 54% of total nights away but only 33% of total domestic expenditure. The growth in expenditure for combined adult and children trips was only about half that for trips involving adults only. The per diem spend for trips involving adults only was on average €33.90 higher than for trips involving adults and children.
The increase from €707 million in 2000 to €1,165 million in 2005 is of course in current prices. The results are somewhat less impressive when expressed at constant prices. Two options for the deflation of domestic tourism expenditure are set out below. Using the Consumer Price Index excluding mortgage interest repayments (CPI-M) as a crude deflator of the prices faced by Irish residents purchasing tourism products in Ireland, the €1,165 is reduced to €982 million, a reduction of €183 million or roughly 16%.5 This gives an estimated real increase in tourism expenditure of 39% rather than the nominal 65%. If average per diem expenditure is compared at current and constant prices, the nominal increase of 39% falls to 17%.
This of course might understate the impact of inflation on the domestic tourism product itself. Tourism is a very diverse activity and its tentacles affect just about every aspect of the Services economy. Consequently, it is very difficult to know which services to include within the tourist industry and which ones to exclude. Over the course of a typical domestic trip, a typical tourist will purchase a wide range of goods and services, some of which would normally be thought of as tourist products (e.g. accommodation services) and some, which might not be thought of as tourism products (e.g. purchasing motor fuel).
4
ver the six years 2000–2005, the prices for what we might call the Tourist Index or CPI-T (i.e.
sing CPI-M as the deflator, a 39% growth in expenditure over six years is still impressive.
7. REAL AND NOMINAL GROWTH
o how have Irish residents managed to take so many more additional trips every year? Even
2000 2001 2002 2003 2004 2005
€ Millions Total Expenditure - Current Prices 706.6 879.9 849.4 970.9 1,037.2 1,164.5
Total Expenditure - Constant Prices (CPI-M) 706.6 843.6 775.7 851.7 891.8 981.9 Total Expenditure - Constant Prices (CPI-T) 706.6 830.1 746.4 803.1 824.5 896.5
€ Average Per Diem - Current Prices 34.1 37.9 38.2 41.1 42.9 47.3
Average Per Diem - Constant Prices (CPI-M) 34.1 36.4 34.9 36.1 36.9 39.9 Average Per Diem - Constant Prices (CPI-T) 34.1 35.8 33.6 34.0 34.1 36.4
[image:7.595.105.515.130.284.2]Source: CSO, CPI and HTS, 2000-2005
Table 2: Estimated Total Expenditure at Current and Constant Prices, 2000 - 2005
O
prices of tourist products as measured in the CPI) rose by almost 30%. This index represents a typical “core” basket of tourism products, i.e. the index is comprised of goods and services that might typically be thought of as within the tourism sphere.6 This excludes items such as retail shopping, transport, motor fuels, books & newspapers, photographic services, and hair and beauty treatment which all might ordinarily play an important role in a domestic trip but are outside the control of the tourism industry. Again, one could quibble over the exact composition of the basket but the CPI-T includes the main tourist goods and services purchased by a wide range of domestic tourists while on a trip. If this index were used as the deflator, then €1,165 would be reduced further to €897 million, yielding a real growth rate.
U
Compared with the Retail Sales (RSI) volume index (which measures an obvious alternative to tourism expenditure) which grew by just under 11% (CSO, 2005)7 in the same period, it puts the domestic tourism industry performance into perspective.
S
allowing for the steady decline in the Average Length of Stay, a growth of 31% in the number of trips taken is impressive. Apart from effecting decisions regarding domestic versus outbound trips, cheaper air fares or a strengthening Euro can be discounted as minor or non-influencing factors when considering domestic tourism. Intuitively, any change in income or wealth could be expected to be a significant determinant. After all, holidays cost money! Certainly, in the short period under discussion, 2000–2005, the Irish economy grew at a robust rate, with Gross National Income (GNI) averaging 4.3%8 at constant market prices (CSO, 2005a: Table 4.1). Aggregate income also increased substantially, with remuneration of employees between 2000 and 2005 increasing by 9.5%9 on an annual basis (CSO, 2005a: Table 1.1). Combined with a growing population and a swelling, active labour force, Personal Consumption Expenditure (PCE) on goods and services
6
Eating out, drinking out and accommodation services. 7
See Appendix 3 – Table C 8
See Appendix 3 – Table D 9
grew by an average of 4.5%10 at constant market prices (CSO, 2005a: Table 6.1). It is not unreasonable to assume, nor would it be surprising that this led to increased spending on tourism, whether it be domestic or outbound.
But could there be other determinants? During the 2000–2005 period, employment witnessed rapid
ven when the growth in employment is taken into consideration, the number of trips per person
nother approach in trying to assess the real growth in the number of trips taken might be to
he growth in domestic tourism outstripped the 9% growth in population more than three fold.
8. PUTTING DOMESTIC TOURISM IN CONTEXT
ourism is unlike most other economic activities; the composition and diversity of the sector is
growth, from 1,671.4 million persons employed in the second quarter of 2000 to 1,929.2 million in Q2 2005 – a growth of over 15%. Since then, employment has surged further and now stands at 2,107.0 million persons (CSO, 2006). Presumably the growth in paid employment made a contribution to the growth in domestic tourism, both business and non-business. But it was just that, a contribution, as the growth in domestic tourism considerably exceeded that for employment.
E
employed still increased from 2.6 in 2000 to 3 in 2005. If the number of trips taken by those 15 or more (comparable to ILO11 age cut-off) is adjusted to take account of the growth in employment, the growth in trips falls from 32% over the six-year period to a more modest 14%.
000's
2000 2001 2002 2003 2004 2005
All Trips 5,478 6,307 6,452 6,657 7,001 7,173
Population 3,790 3,847 3,917 3,979 4,044 4,131
Trips per head 1.4 1.6 1.6 1.7 1.7 1.7
Trips (Aged 15+) 4,324 4,897 5,115 5,324 5,448 5,702 Persons Employed (ILO) 1,671 1,722 1,764 1,793 1,836 1,929
[image:8.595.99.488.312.446.2]Trips per Employed 2.6 2.8 2.9 3.0 3.0 3.0
Table 3: Number of Trips per Population and Persons Employed, 2000 - 2005
A
examine the growth in the total population. During the 2000–2005 period, the estimated population for the Republic grew from 3.790 million to 4.131 million persons, a growth of over 341,000 persons or 9%. Net migration was almost 215,000 persons, accounting for almost two thirds of this growth.
T
Even when the growth in population is taken into account, the number of trips taken per head of population still grew from 1.4 in 2000 to 1.7 in 2005. Again, if the number of trips taken is deflated by the growth in the population as a whole, the nominal 31% growth experienced for all domestic trips falls to the a more modest, but nonetheless impressive 20%.
T
one that defies normal economic activity classification and nomenclature. In fact, it might be better thought of as a collection of economic activities rather a single one. This collection is very diverse, ranging from restaurants and hotels on one end of the spectrum to car hire and photo development
10
See Appendix 3 – Table F 11
on the other. Consequently, this makes for an industry that is not easily measured, analysed or understood.
In the view of Travers et al. tourism is “the largest internationally traded services sector in Ireland. It embraces a wide range of diverse small and medium sized enterprises that are predominantly Irish Owned” (Travers et al. 2005). Unfortunately, quantifying the actual value of total tourism, let alone domestic tourism is a very difficult challenge to address. Honohan and Walsh suggest that total tourism and travel receipts come to little more than 4% of GNP (Honohan and Walsh, 2002). However, Deegan (2006: 14) suggests that results from their Tourism Satellite Account (TSA) gives a total tourism spend as a percentage of GNP closer to 7%.
According to published data, over the past six years domestic tourism has accounted for roughly 19% of all overnight National tourism expenditure (i.e. Tourist expenditure made by Irish residents). Of course, this understates the weight of the domestic tourism market significantly, as the HTS does not capture Same-Day Visits (SDV), which obviously plays a much larger role in domestic tourism than they do for outbound tourism. Nor does the HTS distinguish between the portion of total outbound expenditure spent in Ireland, either as part of a pre-payment made in Ireland (e.g. commissions paid to travel agents, foreign airlines or rental agencies etc.), payments to Irish carriers or as overnights spent en-route or returning from airports (e.g. purchasing meals, petrol, accommodation, parking etc.).
There are no data on same day domestic tourism in Ireland, or on the domestic portion of total outbound spend although it has been estimated, as part of the First Steps Tourism Satellite Account (TSA) project that Same-Day tourism could account for as much as 28% (Deegan et al. 2004) of total tourism demand in Ireland. Given the greater importance of SDVs for domestic than for outbound tourism, including their expenditure and the portion of outbound spend actually made in Ireland would have a dramatic re-balancing impact on the relative importance of the two markets.
A satellite account permits the understanding of the size and role of sectors that are poorly defined within the conventional national accounting framework. The tourism industry is just such a sector. It is more accurately a collection of heterogeneous activities that defy conventional classification rather than a single unified industry. A Tourism Satellite Account12 or TSA is an account through which the goods and services associated with tourism can be measured and assessed in line with internationally accepted standards of concepts, classifications and definitions. Thus a TSA facilitates both inter and intra-national comparison of tourism sectors.
In the First-Steps TSA compiled for Ireland for 2000, estimates for SDV and domestic portion of outbound expenditure were produced, as were pre-payments. This involved a number of steps:
1. Using SDV data from the UK, Deegan et al., estimated that the ratio of Same-Day trips or Day-Tripper to Overnight tourist trips was 14:1, yielding 76.7 million SDVs for 2000.13 This gave a Same Day Penetration Rate (the number of SDVs per head of population) of 2014 for Ireland, compared with 23 for Great Britain. The HTS does not provide expenditure category breakdowns, so SDV per diems were then calculated. This was done was first using Household Budget Survey (HBS) domestic tourism expenditure data to net out accommodation expenditure.15 Then Fáilte Ireland/IMS inbound tourist data was used to
12
For more information on TSAs see UN-WTO/OECD/EU Tourism Satellite Account – Recommended Methodological Framework, 2001.
13
5,478,000 trips * 14 = 76,692,000 SDVs
14
76,692,000 / 3,786,900 = 20
distribute the remaining expenditure into spending shares (i.e. Food & Drink, Sightseeing/Entertainment, Transport, Shopping and Miscellaneous).16 This gave an “Irish Day Tripper” per diem spend of €23.21 and a total spend of €1,779.92m.
2. A simple pro-rata adjustment was made for the domestic portion of outbound trips. CSO estimated, using HTS “secondary destination” data, that in 2000, 84,000 nights were spent by Irish residents en-route to or returning from overseas destinations.17 As there were 35,544,000 overnights outside of Ireland, with a total expenditure of €2,804m during 2000, €6.36m18 was transferred from outbound to domestic expenditure.
3. In addition to commission on the €6.36m above (0.53m), commission on travel agency/tour operator services in respect of outbound tourism was estimated at €153m.
4. Finally, residents travelling abroad paid Irish international carriers €495m.
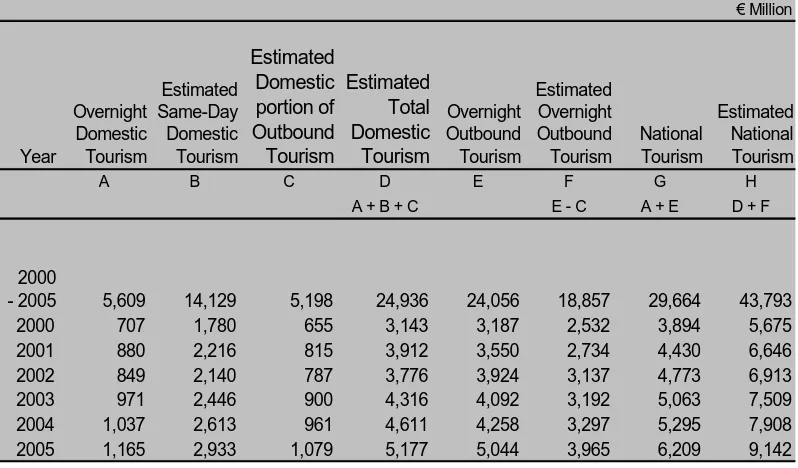
€ Million Year Overnight Domestic Tourism Estimated Same-Day Domestic Tourism Estimated Domestic portion of Outbound Tourism Estimated Total Domestic Tourism Overnight Outbound Tourism Estimated Overnight Outbound Tourism National Tourism Estimated National Tourism
A B C D E F G H
A + B + C E - C A + E D + F
2000
- 2005 5,609 14,129 5,198 24,936 24,056 18,857 29,664 43,793
2000 707 1,780 655 3,143 3,187 2,532 3,894 5,675
2001 880 2,216 815 3,912 3,550 2,734 4,430 6,646
2002 849 2,140 787 3,776 3,924 3,137 4,773 6,913
2003 971 2,446 900 4,316 4,092 3,192 5,063 7,509
2004 1,037 2,613 961 4,611 4,258 3,297 5,295 7,908
[image:10.595.97.496.291.525.2]2005 1,165 2,933 1,079 5,177 5,044 3,965 6,209 9,142
Table 4: Domestic, Outbound & National Tourist Expenditure, 2000 - 2005
Adding these adjustments to the €707m generated from overnight domestic tourism, total domestic expenditure grows to €3.1bn. Holding the ratio between overnight domestic expenditure and total domestic expenditure, i.e. between €707m and €3,143m constant and extrapolating forward over the years 2001 through 2005, it could possibly mean that aggregate domestic tourism, from 2000 to 2005 generated €24.9 billion.
This re-balancing would not only increase the value of total domestic expenditure from €5.6 billion to €24.9 billion, it would also decrease the total value of total outbound expenditure (or invisible imports) from €24.1 billion to €18.9 billion. This would have the rather dramatic effect of
16
See Appendix 3 – Table G 17
CSO estimated this understated the real figure, as this figure was calculated from the secondary destination questions in the HTS which were rarely completed. It is likely there was a significant level of partial non-response in relation to these questions.
making total domestic tourist expenditure worth more than total outbound expenditure. It would also re-value total national tourism at €43.8 billion in total over the 2000–2005 period.
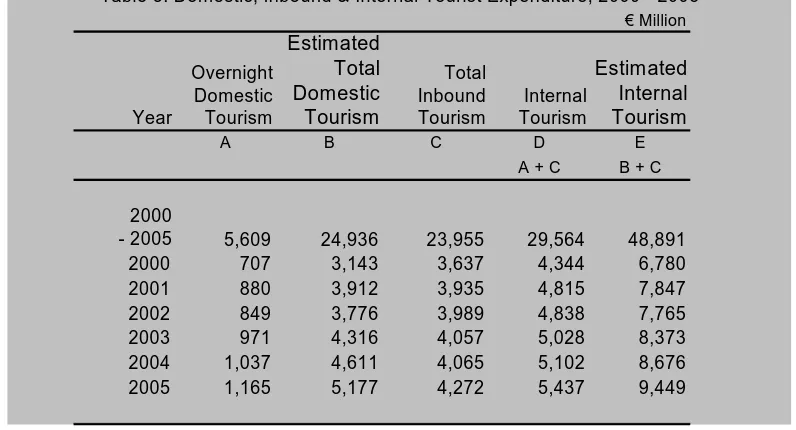
In terms of internal tourism (i.e. domestic + inbound), domestic tourism also plays an important role. Again, it is not exactly clear how important that role is, due to the lack of SDVs data for domestic tourism and comprehensive data on the impact of outbound expenditure made within Ireland. But the scenario is similar to that for national tourism, in that SDVs have a larger impact on domestic tourism than on inbound tourism.
€ Million
Year
Overnight Domestic Tourism
Estimated Total Domestic Tourism
Total Inbound Tourism
Internal Tourism
Estimated Internal Tourism
A B C D E
A + C B + C
2000
- 2005 5,609 24,936 23,955 29,564 48,891
2000 707 3,143 3,637 4,344 6,780
2001 880 3,912 3,935 4,815 7,847
2002 849 3,776 3,989 4,838 7,765
2003 971 4,316 4,057 5,028 8,373
2004 1,037 4,611 4,065 5,102 8,676
[image:11.595.96.494.219.434.2]2005 1,165 5,177 4,272 5,437 9,449
Table 5: Domestic, Inbound & Internal Tourist Expenditure, 2000 - 2005
We know from the CSO frontier surveys (CSO, 2005c) that Same-Day Visit expenditure generally accounts for less than 3% of total inbound expenditure. Using the calculations from Table 4 we can expect domestic SDVs to have a rather more important contribution to domestic tourism.
The effect of including SDV expenditure and re-apportioning some of the outbound expenditure to domestic tourism increases the value of internal tourism from an estimated €29.6 billion to €48.9 billion. It also repositions domestic tourism, in that domestic and inbound tourism become more equal, with total domestic expenditure accounting for €24.9 billion and total inbound tourism €23.6 billion. In other words, domestic tourism generates as much income, if not more, than inbound tourism. We do not know a great deal about the spending habits of either domestic or inbound tourists, beyond their total expenditure, but it is possible that in terms of value added, domestic tourism expenditure contributes more as proportionately less of that expenditure may be diverted to imported goods.
The real purpose of this exercise is not to accurately estimate the actual value of national or internal tourism but to highlight, in broad terms, the difference in CSO survey expenditure and the Tourism Satellite Account estimate. The difference highlights important data gaps.
9. ASSESSING PERFORMANCE
visiting relatives or attending business meetings abroad, these markets are not interchangeable or substitutable. That said, it is interesting to compare the two markets at the aggregate level.
In 2000, the Domestic market accounted for 59% of National Tourism (i.e. all trips taken by Irish residents involving an overnight stay) with outbound trips only accounting for 41%. However between 2000 and 2005, outbound trips grew at a staggering 64% compared with a more modest 31% for Domestic trips. The result was that by 2005, Domestic trips only accounted for 54% of all trips taken by Irish residents, a loss of almost 6% in market share in as many years.19
The same pattern can be seen for nights spent. The growth of outbound nights outstripped Domestic nights by a ratio of more than two to one, 45% compared with 19%. The upshot was a fall in the Domestic market share of 37% to 32% during the period 2000-2005.
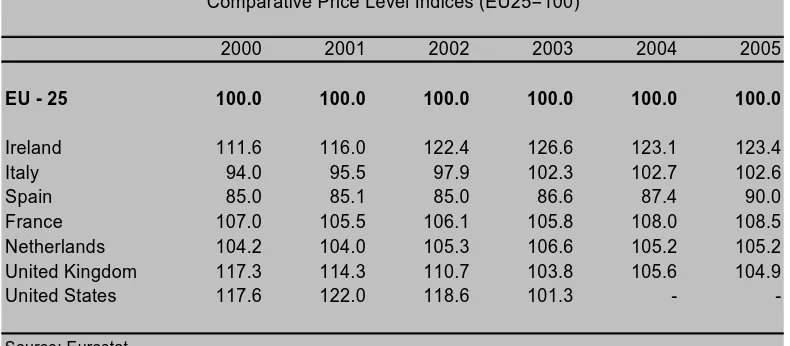
Interestingly, despite a significant loss in market share for both trips and nights, the domestic market did not lose any share of total expenditure, on the contrary in fact, despite the loss of trips’ and nights’ share to outbound trips, the domestic share of expenditure increased from 18% to 19%. Worryingly, this might be due to relatively high price levels in Ireland. Comparative Price Levels for Household Final Consumption Expenditure from the Purchasing Power Parity (PPP) surveys conducted by CSO on behalf of the European Commission show a marked deterioration in Ireland’s relative price competitiveness, going from 111.6 in 2000 to 123.4 in 2005, benchmarked against an EU-25 average of 100 (Eurostat, 2006), i.e. in 2000, overall price levels were estimated to be 11.6% higher than the EU-25 average. By 2005, this differential had widened to 23.4%.
2000 2001 2002 2003 2004 2005
EU - 25 100.0 100.0 100.0 100.0 100.0 100.0
Ireland 111.6 116.0 122.4 126.6 123.1 123.4
Italy 94.0 95.5 97.9 102.3 102.7 102.6
Spain 85.0 85.1 85.0 86.6 87.4 90.0
France 107.0 105.5 106.1 105.8 108.0 108.5
Netherlands 104.2 104.0 105.3 106.6 105.2 105.2
United Kingdom 117.3 114.3 110.7 103.8 105.6 104.9
United States 117.6 122.0 118.6 101.3 -
[image:12.595.99.494.386.559.2]-Source: Eurostat
Table 6: Household Final Consumption Expenditure - Comparative Price Level Indices (EU25=100)
If this is contrasted with some of the main travel destinations typically visited by Irish residents, the message is clear. For example, the UK went from 117.3 in 2000 to 104.9 in 2005. Despite some improvement since 2002, overall, Ireland has had the highest relative increase in price levels vis-à-vis the EU average.
In terms of benchmarking domestic tourism in Ireland, outbound travel to Northern Ireland is probably one of the more interesting comparisons that can be made as we share a border on the same island. Over the six years, trips to Northern Ireland grew by 44% but in terms of nights spent, the growth was less than 5%. Trips to Northern Ireland also witnessed a surprising decline
19
in average length of stay, falling from 3.9 nights in 2000 to 2.9 nights in 2005.20 On balance, it would appear that domestic travel has outperformed outbound trips to Northern Ireland.
It would be all too easy to attribute the loss of domestic market share to the outbound market to the impact of low cost airlines and the favourable relative cost of different markets. No doubt price, and presumably weather, are influencing factors on Irish residents when they make their decisions on where to holiday, particularly within the Euro zone where prices are easily compared. But perhaps there are other factors at work?
Approximately 9% (CSO, 2006b) of Irish residents are now non-nationals, immigrants from all over the world but in particular from the UK and Eastern Europe. Their decisions on where to holiday are probably not made exclusively on price (or weather) but on where their family and relatives are located.
Part of the explanation for the decline in domestic market share may lie in the fact that during the years 2000 – 2005 “we”, Irish residents, have changed dramatically. A decade ago, the concepts of “Irish resident” and “Irish national” were virtually interchangeable, but by the turn of the Century this was clearly no longer the case. Between the years 2000–2005 over 349,000 (CSO, 2005b) immigrants crossed to our shores, 80% of whom were aged between 15 and 44 and net migration was almost 215,000 persons21 and accounting for almost two thirds of the population growth during that time. No longer can Irish residents be necessarily thought of as Irish nationals.
Unfortunately, the Household Travel Survey does not compile any data on nationality so this is somewhat speculative. But given that 9% of the population are now non-national compared with only 5.8% in 2002 (CSO, 2006b), it is reasonable to assume that such a dramatic structural change in the population must be having some impact on travel patterns. It is reasonable to assume that recent immigrants to Ireland, now resident, will use their holidays to return home to their native countries to visit friends and family in the same way that Irish emigrants have done for so long. Certainly, this hypothesis is not inconsistent with the growth in outbound trips by Irish residents to countries like Poland etc. Whether these trips are being taken by resident nationals or resident non-nationals is not clear however.
For the Internal tourism market, this might not be as important perhaps as it might seem at first glance, as the change in population is creating a trade-off. It is hard to be certain but arguably, the presence of non-nationals in Ireland has more than compensated for the decline in the domestic share of national tourism by attracting their friends and relatives to Ireland. Between 2000 and 2005, inbound VFR has increased by 36%, compared with a 2% growth in holidays and a decline of 10% in business trips. Visitors from Other Europe have also shown the highest growth at 32%.
10. THE ACCOMODATION MARKET
The 6 year period 2000–2005 has seen some startling structural changes within the tourism industry, but none more so than within the accommodation sector. One of the most noticeable changes has been the decline of the Guesthouse/B&B sector.
In 2000, Guesthouses and B&Bs accounted for 11% of all domestic nights (roughly 2.3 million nights) whereas by 2005 this sector only accounted for 7% (or 1.8 million nights) of market share.22 This dramatic fall in relative market share was the combination of growth in other sectors
20
See Appendix 3 – Table I 21
See Appendix 3 – Table J 22
and an incredible fall of half a million bed nights within the sector itself. This trend has been mirrored by a significant decline on the supply side, with the number of registered Guesthouses/ B&Bs and bed spaces available falling by 22% and 16% respectively.23 Interestingly though, certain specialist sectors have survived or even expanded. For example, the number of health farms and residential activity B&Bs have increased, both in terms of premises and beds available. Equally, within the Guesthouse market, the 3 and 4 star grades have increased in numbers while the 1 and 2 star grades have suffered a decline.
The Caravan & Camping market also suffered a decline over the period. Similar to the Guesthouse and B&B market, Caravan & Camping suffered an absolute and relative decline. In terms of market share, Caravan & Camping lost about 2% of market share, falling from almost 9% in 2000 to 7% in 2005.
Of course, these declines have been balanced by growth elsewhere, most notably within the Hotel and the Owned Holiday Home sectors. In 2000, Hotels catered for roughly 4.7 million domestic bed nights, whereas in 2005 this had grown to 6.4 million nights, a growth of 36%. This growth saw the Hotel share of the accommodation market grew from 23% to 26%. Again, this trend was mirrored on the supply side. Although the number of actual hotels only increased by 1%, the available rooms and beds increased by 20% and 22%24 respectively. What is also striking about the Hotel sector, has been the apparent increase in quality of hotels, i.e. the number of hotels being awarded additional stars. The number of 1 and 2 star hotels has declined in real and absolute terms and by 2005 only accounted for 27% of all Hotels. In contrast, the growth in 4 star hotels is significant, with 26 additional 4 star hotels being registered between 2001 and 2005, a growth rate of 41%.
Nights
% Market
Share Nights
% Market
Share Nights
% Market Share
000's 000's 000's
Total Domestic - Nights 20,703 24,651 45,354
Caravan/Camping 1,808 8.7 1,641 6.7 3,458 7.6
Guest House/B&B 2,275 11.0 1,816 7.4 4,102 9.0
Own Holiday Home 1,082 5.2 2,174 8.8 3,261 7.2
Hotel/Conference Centre 4,689 22.6 6,357 25.8 11,069 24.4
Self Catering/Rented House 3,090 14.9 3,582 14.5 6,687 14.7
Friends/Relatives 6,594 31.9 7,562 30.7 14,188 31.3
Other 1,165 5.6 1,520 6.2 2,691 5.9
[image:14.595.101.493.409.588.2]2000 2005 2000 - 2005
Table 7: Domestic Nights by Type of Accommodation, 2000 - 2005
Owned Holiday Homes also enjoyed boom times, witnessing a staggering 100% growth in just 5 years and snatching a larger slice of the market share, going from 5% in 2000 to almost 9% in 2005. The Owned Holiday Home sector was also only one of two accommodation categories that enjoyed an increase in the average length of stay when comparing 2000 and 2005.
Although Staying with Friends and Relatives experienced a slight decline in share, it remained the most popular choice of accommodation for domestic trips, accounting for 31% of all bed nights over the 2000 – 2005 period.
23
11. AGE PROFILE OF DOMESTIC TOURISTS
For the purposes of this paper domestic tourists have been grouped into four age categories: 0-19 which roughly corresponds to those in full-time education; 20-29 further education and early career; 30-59 established career/life choice and 60+ retired. One could quibble over the actual band thresholds but they suffice for the purposes at hand.
he age cohort 30-59 or those that could be considered most likely to be in an established career or
he close relationship can clearly be seen if the data are grouped by quarter. Clearly the 0-19 and
12. MOST COMMON AND AVERAGE LENGTH OF STAY
[image:15.595.104.490.184.389.2]Over the period 2000–2005, the average length o stay for domestic trips has been falling, from an
Figure 2: Seasonal Pattern of Domestic Trips by Age Cohort 2000 - 2005
0 200 400 600 800 1,000 1,200
Jan - Mar A pr - Jun Jul - Sep Oct - Dec Trips
0-19
20-29
30-59
60+
T
life choice, account for the biggest share of domestic trips. This group took over 20 million trips and accounted for 52% of all the domestic trips taken during the 2000–2005 period. The 0-19 group, with almost 10 million trips, were the next biggest travelling group. Obviously, there is some overlap between these two groups, particularly for the 0-14 sub-group, who in the majority of cases probably accompanied their parents, who are most likely in the 30-59 group. The 0-14 group accounted for over 8 million of the 10 million trips taken by the 0-19 group. While the 60+ group only accounted for about 12% of domestic trips and 14% of nights spent, this group saw the biggest growth over the period, going from almost 0.7 million trips in 2000 to 1 million in 2005, a growth of 49%. This group also accounted for a 41% growth in nights, double the growth of any other age group.
T
the 30-59 age cohorts move together, and are much more seasonal in their behaviour than the 20-29 and 60+ age cohorts. Presumably, there is a high degree of correlation between the 0-19 and 30-59 age cohort patterns and school holidays.
f
Examining trips by purpose, the decline in average length of stay has been more consistent across most trip types, although business trips have suffered the biggest reduction, falling from 3 nights in 2000 to 2.6 nights in 2005.
In contrast, the most common length of stay (mode) has remained unchanged over the six years at 2 nights. Across all the accommodation sectors, the most common length of stay was also 2 nights, with the exception of Self Catering, where the most common length of stay remained at 7 nights. The most common length of stay for a holiday was 2 nights and for business trips was 1 night.
Over the 2000–2005 period, the average length of stay of a domestic trip was 3.6 nights. When broken down into the four age cohorts outlined above, one can see that the 0-19 and 60+ groups spent on average an extra day per trip than the 20-29 and 30-59 groups, typically spending over 4 days in comparison to 3.2 days.
F ig u re 3 : A ve ra g e L e n g t h o f S t a y b y A g e c o h o rt
3 .0 3 .5 4 .0 4 .5
0 - 1 9 y e a r s 2 0 - 2 9 y e a r s 3 0 - 5 9 y e a r s 6 0 + y e a r s Da y s
13. REGIONAL PATTERNS25
Throughout the 2000–2005 period, the relative share between the Southern and Eastern (SE) and Border, Midlands and Western (BMW) regions remained fairly stable. The SE region was clearly dominant, accounting for roughly 67% of all domestic trips and nights. This dominance was in no small measure attributable to the popularity of the South-West as holiday destination and Dublin as a business destination. Although the SE region took an even larger share of total expenditure, the BMW region secured a marked increase in expenditure share, going from 21% in 2000 to 24% in 2005, despite a less significant growth in trips and nights.
The South-West was the most visited region, with 8.5 million overnight trips between 2000 and 2005, attracting almost 1.5 million more trips than its nearest competitor, the West. Equally, more nights were spent in the South-West, with an impressive 34.7 million nights, compared to the next highest, again the West, with 25.3 million nights – a difference of 9.4 million nights. Interestingly, the South-West has consistently maintained the longest Average Length of Stay (ALS) and over the six year period has sustained an average ALS of 4.1 nights.
[image:16.595.103.493.269.475.2]
Region
Visited 2000
% Share
2000 2005
% Share 2005
% Change 2000 - 2005
'000
Trips BMW 1,750 32.0 2,366 33.0 35.2
SE 3,727 68.0 4,807 67.0 29.0
'000
Nights BMW 6,674 32.2 8,199 33.3 22.8
SE 14,029 67.8 16,408 66.7 17.0
€ Million
Total Expenditure BMW 147.4 20.9 281.3 24.2 90.8
SE 559.2 79.1 883.2 75.8 57.9
€ Average Per Diem
Expenditure BMW 35.3 46.3 31.1
[image:17.595.112.498.138.406.2]SE 33.8 47.7 40.9
Table 8: Comparison of NUTS 2 regions
In contrast, fewer nights were spent in the Midlands region than any other, attracting only 1.7 million trips and 4.3 million nights over the six-year period. The Midlands has also had the shortest ALS of all regions, averaging only 2.6 nights. However on a more positive note for the Midlands, the region has experienced the greatest level of growth in trips taken of all the regions, growing steadily from 209,000 trips in 2000 to 341,000 trips in 2005 – a growth rate of 63%. The growth in nights spent was a more modest 22% however. The next highest growth rate for trips was experienced in the Dublin region at 46%.
In terms of overall market share, the South-West accounted for 21.7% of all domestic overnight trips and 25% of all domestic nights, followed by the West at 17.9% (trips) and 18.2% (nights). The Dublin region had a share of 13.7% (trips) and 10.7% (nights).
When purpose of journey is taken into consideration, the regional spread takes on a somewhat different complexion. The Dublin region accounted for more business trips than any other region, 1.1 million trips or 28% of all domestic business trips taken during the 2000–2005 period. The magnetic pull of the Dublin region as the business centre of Ireland was evident across all regions, with the exception of the Greater Dublin Area itself. For example, 55% of all business trips taken by residents of the South-West region were to Dublin.
The South-West region came in a distant second with 0.7 million business trips or 18%. In fact, Dublin accounted for nearly as many Business trips as the entire BMW region put together, 1.07 million and 1.13 million trips respectively. Interestingly, while there were significantly different growth rates across the individual regions, the growth in the number of business trips to the BMW and SE regions was remarkably similar at 41% and 39% respectively.
South-West and West regions favoured their own regions as their most popular holiday destination. For all other regions, the bulk of holidays were taken outside their own region. Typically, the favoured region for holidays was a neighbouring one. For example, the South-East was the favoured holiday destination for Dublin and Mid-East residents while the West was favoured by those living in the Border region.26
In terms of growth however, it was Dublin and the Midlands that led the way, both in terms of
ne of the advantages of examining aggregated data over a six year period is that we can mine
14. TRAVELLING WITH CHILDREN
omestic Tourism is an umbrella term for a plethora of industries and market segments. One
2000, the number of trips taken by adults only was broadly speaking at parity with the number
ver the six years, expenditure for adult only trips massively exceeded that of adult and children
holiday trips and nights. Over the six year period, the Midlands experienced growth of 122% while Dublin grew by 117%. Growth in nights spent for these regions was also impressive with 58% for the Midlands and 74% for Dublin. This saw the Dublin region increase its market share for holiday trips from just under 5% in 2000 to almost 8% in 2006, while the Midlands increased their share from 2% to 3% in the same period.
O
down to County level. At NUTS 4 county level, Dublin, which is identical to the NUTS 3 region Dublin accounts for the greatest share of trips (5.3 million from 2000 to 2005) but Cork reaped the greatest number of nights with 17.6 million. Kerry came in a close second with 17 million nights and Galway third with 16 million nights. Wexford had the longest average length of stay with 4.4 nights, followed closely by Kerry and Clare, with 4.3 and 4.2 nights respectively. Offaly had the shortest average length of stay with only 2.4 nights.27
D
interesting tourism market is the sector catering for families and children (i.e. those under 18 years of age). For the purposes of this paper, the data have been classified into two groups; those comprising of adults only and those made up of adults and children together.
In
of trips taken involving children and adults. By 2005, this had changed, with adult only trips accounting for 56% of all trips taken. By 2005, the number of nights spent involving adults and children were still greater than that for adults only, but this simply due to the fact that trips involving children had a longer average length of stay. Trips involving children were typically a night longer than those without.28
O
trips by a ratio of almost 2 to 1, €3.7 billion compared with €1.9 billion. Per diem expenditure for adult only trips were on average almost 2.4 times that of adult and children trips, €58.90 compared with €25. Six years is a relatively short period from which to draw conclusions, but it is possible that changes in population composition such as immigration and the reducing number of “nuclear families” are having an impact.
26
See Appendix 3 – Tables O, P and Q 27
Figure 4: Travelling with Children Accommodation used with and without children
0 20 40 60 80 100
Hot el
B&B/ Gues
thous e
Ca rava
n & C amp
ing
Self C ater
ing
Holid ay H
om e
%
Adults Only
Adults & Children
Not surprisingly, 88% of business trips were adult only. Trips involving adults and children, only accounted for 41% of nights spent in hotels, 35% on nights spent in Guesthouse/B&B’s but 76% of all nights spent camping, 70% of nights spent in self catering accommodation and 63% of all nights spent in owned holiday homes.
15. CONCLUSIONS
One of the aims of this paper was, having examined the 2000–2005 data, was to see if there were any clear lessons that can be learned, and clearly there are!
Although the 2000–2005 period was arguably one of the most turbulent periods for the tourism industry in recent times, it was also one of the most economically buoyant in Ireland’s history. This climate appears to have had a clear beneficial impact on domestic tourism. Over the six years in question, the domestic tourism market not only survived but also apparently thrived with a nominal growth in trips and expenditure of 31% and 65% respectively. While growth in population and employment undoubtedly contributed to this growth, they clearly do not account for all of it. Even allowing for population and employment growth, trips per head of population increased from 1.4 to 1.7 and trips per employee increased from 2.6 to 3.0.
In the past six years, the domestic market has witnessed a dramatic change within the accommodation sector. The B&B sector in particular has undergone a significant decline, whereas the Hotel and Owned Holiday Home sectors have enjoyed an impressive expansion. These changes have taken place both on the supply and demand side. The supply side has also witnessed significant structural change with a move to higher quality accommodation being offered in a number of sectors, but particularly within the Guesthouse and Hotel sectors.
The 60+ market is growing faster, roughly twice as fast, as any other age cohort in the market. This group typically takes longer trips and travels all year round, i.e. is less seasonal than most than most other age cohorts. Their per diem spend, although on the lower end of the spectrum, is one of the fastest rising among the age categories.
in favour of the South-East, South-West and West regions. There is also an evident pattern, where residents tend to holiday either in their own or a neighbouring region. Relatively speaking, there is very little traffic between the Border regions and the Southern regions, in either direction. Nor is there much holiday traffic from the West to the East, although the same cannot be said from East to West.
Because the tourism industry is so difficult to pinpoint, it is difficult to isolate price changes that affect the tourism industry from price changes coming from within the industry itself. While one might quibble with the Tourism Index constructed for this paper, the lesson is clear. There has been much discussion about “Rip off Ireland” in recent times and if price inflation for the tourism product exceeds that of headline inflation, it must impact on domestic tourism as will the relative purchasing power in Ireland compared with other attractive holiday destinations.
It is likely that immigration is having an impact on domestic tourism, in the short to medium term at any rate. While price is no doubt a contributing factor in the decline of the relative market share of the domestic market versus the outbound market, the structure of our population may also be exerting a significant influence. Recent immigrants will probably return home for some years to visit their friends and family. The extent to which this continues into the future is anyone’s guess but what is already clear from the inbound tourism data, is that many tourists from Eastern Europe and elsewhere are now coming to visit their friends and relatives in Ireland.
This paper has suggested that in terms of generating revenue, domestic tourism may possibly be every bit as important to Internal tourism as inbound tourism, or at any rate, is undoubtedly more important than traditionally thought. Also, domestic tourism is less vulnerable to external shocks, such as September 11 etc. Perhaps less glamorous than inbound tourism, domestic tourism has arguably been the stable bedrock of Irish internal tourism, as was particularly evident in 2001.
BIBLIOGRAPHY
CSO (Q1 2000 – Q4 2005), Household Travel Survey Database, Cork.
CSO (Q1 2000 – Q4 2005), Household Travel Survey, Dublin: The Stationery Office. CSO (2005a), National Income and Expenditure, Dublin: The Stationery Office. CSO (2005b), Population and Migration Estimates, Dublin: The Stationery Office. CSO (2005c), Tourism and Travel, Q1 2000 – Q4 2005, Dublin: The Stationery Office. CSO (2005d), Retail Sales Index, M1 2000 – M12 2005, Dublin: The Stationery Office. CSO (2006a), Domestic Tourism in Ireland, 2000 – 2005, Dublin: The Stationery Office. CSO (2006b), Census 2006 – Preliminary Report, Dublin: The Stationery Office.
CSO (2006c), Quarterly National Household Survey Q2 2006, Dublin: The Stationery Office. CSO (2000 – 2006), Consumer Price Index, Dublin: The Stationery Office.
Eurostat (2006), Purchasing Power Parities, NewCronos Database.
Deegan J., Kenneally, M., Moloney, R., O’Sullivan, D. & Wanhill, S. (2004), Ireland Tourism Satellite Account First Steps Project for The Republic of Ireland and Northern Ireland, Fáilte Ireland, Dublin.
Deegan J., Kenneally, M., Moloney, R. & Wanhill, S. (2006), Understanding the Economic Contribution of Irish Tourism to the National Economy – Paper presented to the 29th Annual Economic Policy Conference, Kenmare.
Enterprise Ireland (2003), Ireland: Economic Profile. Dublin.
Fáilte Ireland (2000 – 2005), Gulliver - Registered Accommodation Database.
Honohan P. & Walsh, B. (2002), Catching up with the leaders: The Irish Hare, Brookings Panel on Economic Activity, Washington DC.
International Labour Organisation (2000), Current International Recommendations on Labour Statistics, Geneva.
Travers J., Furlong, P., Murphy, J., O’Donoghue, M., O’Mara Walsh, E., Rooney, R. & Tansey, P. (2004), First Progress Report of the Tourism Action Implementation Group.
United Nations – World Tourism Organisation (1994), Recommendations on Tourism Statistics, Madrid and New York.
APPENDIX 1: NUTS REGIONAL CLASSIFICATION
The regional classifications in the Household Travel Survey and this paper are based on the NUTS (Nomenclature of Territorial Units) classification used by Eurostat. The NUTS 3 regions correspond to the eight Regional Authorities established under the Local Government Act, 1991 (Regional Authorities) (Establishment) Order, 1993, which came into operation on 1 January 1994. The NUTS 2 regions, which were proposed by Government and agreed by Eurostat in 1999, are groupings of the NUTS 3 regions. The composition of the regions is set out below.
NUTS 2 Region
NUTS 3 Regional Authority
NUTS 4 County
Border, Midlands and
W estern (BMW ) Border Cavan
Donegal Leitrim Louth Monaghan Sligo
Midland Laoghis
Longford Offaly W estm eath
W est Galway City
Galway Mayo Roscom m on
Southern and Eastern
(SE) Dublin Dublin City
Dun-Laoghaire Fingal
South Dublin
Mid-East Kildare
Meath W icklow
Mid-W est Clare
Lim erick North Tipperary
South-East Carlow
Kilkenny South Tipperary W aterford City W aterford W exford
APPENDIX 2
Region 1 Adult 2 Adults 3 Adults 4 Adults 5 Adults 6+ Adults
Total Number of Households
1 Border x x x x x x x
2 Dublin x x x x x x x
3 Mid-East x x x x x x x
4 Midlands x x x x x x x
5 Mid-West x x x x x x x
6 South-East x x x x x x x
7 South-West x x x x x x x
8 West x x x x x x x
Total x x x x x x x
[image:23.595.98.498.134.324.2]Source: CSO, Quarterly National Household Survey
APPENDIX 3: TABLES
€ million
2000 2001 2002 2003 2004 2005
2000 - 2005
Domestic - Expenditure 706.6 879.9 849.4 970.9 1,037.20 1,164.50 5,608.50
Holiday 447.7 549.7 501.6 575.9 624.9 706.8 3,406.60
Business 109.5 149.3 152.9 157.6 162.5 188.3 920.1
Visiting Friends/Relatives 81.3 86.6 97.2 114 121.1 142.4 642.6
Other 68.1 94.3 97.7 123.4 128.7 127 639.2
€ Average Per Diem Expenditure 34.1 37.9 38.2 41.1 42.9 47.3 40.5
Holiday 39.0 41.6 41.5 44.3 46.3 51.7 44.3
Business 65.5 84.0 93.6 88.1 97.6 95.4 87.6
Visiting Friends/Relatives 14.4 14.9 15.9 17.5 18.7 21.8 17.3
Other 35.5 39.6 41.2 53.4 50.7 52.4 45.9
[image:24.595.94.491.169.348.2]Source: CSO (2006), Domestic Tourism in Ireland, 2000 - 2005: Table 7
Table A: Total Estimated and Per Diem Expenditure by Reason for Journey, 2000 - 2005
2000 2001 2002 2003 2004 2005
CPI-M 100.0 104.3 109.5 114.0 116.3 118.6
CPI-T 100.0 106.0 113.8 120.9 125.8 129.9
Current prices
Total Expenditure (€ million) 706.6 879.9 849.4 970.9 1,037.2 1,164.5
Average Per Diem (€) 34.1 37.9 38.2 41.1 42.9 47.3
Total Expenditure - Index 100.0 124.5 120.2 137.4 146.8 164.8 Average Per Diem - Index 100.0 111.1 112.0 120.5 125.6 138.7
Constant prices - CPI-M
Total Expenditure (€ million) - Constant Prices 706.6 843.6 775.7 851.7 891.8 981.9 Average Per Diem (€) - Constant Prices 34.1 36.4 34.9 36.1 36.9 39.9 Total Expenditure - Index 100.0 119.4 109.8 120.5 126.2 139.0 Average Per Diem - Index 100.0 106.5 102.3 105.7 108.0 116.9
Constant prices - CPI-T
Total Expenditure (€ million) - Constant Prices 706.6 830.1 746.4 803.1 824.5 896.5 Average Per Diem (€) - Constant Prices 34.1 35.8 33.6 34.0 34.1 36.4 Total Expenditure - Index 100.0 117.5 105.6 113.7 116.7 126.9 Average Per Diem - Index 100.0 104.8 98.4 99.6 99.9 106.7
Source: CSO, Consumer Price Index sub-indices and Household Travel Survey, 2000 - 2005
[image:24.595.92.490.417.733.2]2000 100.0
2001 101.5
2002 101.7
2003 102.6
2004 105.7
2005 110.8
[image:25.595.103.498.93.461.2]Source: CSO (2006) Retail Sales Index Table C: Retail Sales Index Unadjusted Volume - All Businesses
(Base: Year 2000 = 100)
€ Million
2000 2001 2002 2003 2004 2005*
GNI 107,325 111,338 114,984 120,998 125,818 132,559
2000 - 2005
2000 - 2001
2001 - 2002
2002 - 2003
2003 - 2004
2004 - 2005
GNI (annual % change) 4.3 3.7 3.3 5.2 4.0 5.4
Source: CSO (2006), National Income & Expenditure: Table 4 * Preliminary
Table D: Gross National Income at Constant Market Prices 2000 - 2005
€ Million
2000 2001 2002 2003 2004 2005*
Agriculture 484 483 493 505 547 554
Non-Agricultural 41,915 46,695 50,267 53,995 59,391 65,825
Self Employment 2,395 2,453 2,293 2,314 2,356 2,846
Total 44,794 49,631 53,053 56,814 62,294 69,225 Source: CSO (2006), National Income & Expenditure: Table 1
* Preliminary
Table E: W ages & Salaries and Self Employment & Other Trading Income at Market Prices (Including Employers' contribution to Social Insurance)
€ Million
2000 2001 2002 2003 2004 2005*
Personal Consumption of
Goods and Services 58,669 61,833 64,176 66,231 68,719 73,282
2000 - 2005
2000 - 2001
2001 - 2002
2002 - 2003
2003 - 2004
2004 - 2005
Personal Consumption of Goods and Services
(annual % change) 4.5 5.4 3.8 3.2 3.8 6.6
[image:26.595.94.490.120.316.2]Source: CSO (2006), National Income & Expenditure: Table 6 & 6.1 * Preliminary
Table F: Personal Consumption of Goods and Services at Constant Market Prices
2000 - 2005
Tourism Products
SDV Share
Other Food & Drink 0.43
Sightseeing/Entertainment 0.09
Transport 0.12
Shopping 0.28
Miscellaneous 0.08
Total 1.00
Inbound
'000 Trips Trips % Share Trips % Share
2000 6,310 5,478 59.2 3,768 40.8
2001 5,990 6,307 60.2 4,162 39.8
2002 6,065 6,452 58.4 4,597 41.6
2003 6,369 6,657 57.2 4,974 42.8
2004 6,574 7,001 56.2 5,465 43.8
2005 6,977 7,173 53.7 6,189 46.3
2000
- 2005 38,285 39,068 57.3 29,155 42.7
% Change
2000 - 2005 10.6 30.9 64.3
'000 Nights Nights % Share Nights % Share
2000 46,169 20,703 36.8 35,544 63.2
2001 45,276 23,207 37.9 37,953 62.1
2002 44,339 22,222 35.3 40,660 64.7
2003 46,846 23,616 35.1 43,702 64.9
2004 46,604 24,189 34.3 46,302 65.7
2005 49,451 24,607 32.3 51,503 67.7
2000
- 2005 278,685 138,544 35.1 255,664 64.9
% Change
2000 - 2005 7.1 18.9 44.9
€ Million Spend Spend% Share Spend % Share
2000 3,637 707 18.1 3,187 81.9
2001 3,935 880 19.9 3,550 80.1
2002 3,989 849 17.8 3,924 82.2
2003 4,057 971 19.2 4,092 80.8
2004 4,065 1,037 19.6 4,258 80.4
2005 4,272 1,165 18.8 5,044 81.2
2000
- 2005 23,955 5,609 18.9 24,056 81.1
% Change
2000 - 2005 17.5 64.8 58.3
Source: CSO, Household Travel Survey, 2000 - 2005
[image:27.595.136.464.141.677.2]Domestic Outbound
'000
2000 2001 2002 2003 2004 2005
2000 - 2005
Trips - ROI 5,478 6,307 6,452 6,657 7,001 7,173 39,068
Trips - NI 188 200 204 223 252 271 1,338
Nights - ROI 20,703 23,207 22,222 23,616 24,189 24,607 138,544
Nights - NI 740 653 603 799 716 775 4,286
Nights
ALS - ROI 3.8 3.7 3.4 3.5 3.5 3.4 3.5
ALS - NI 3.9 3.3 3.0 3.6 2.8 2.9 3.2
[image:28.595.103.490.134.311.2]Source: CSO (2006) Household Travel Survey, 2000-2005
Table I: Trips, Nights, ALS for Republic of Ireland and Northern Ireland
2000 2001 2002 2003* 2004* 2005*
Nationality
Irish 24.8 26.3 27.0 17.5 16.9 19.0
UK 8.4 9.0 7.4 6.9 5.9 6.9
Rest of EU 15** 8.2 6.5 8.1 6.9 10.6 7.1
EU 10*** - - - 26.4
USA 2.5 3.7 2.7 1.6 1.8 1.6
Rest of world 8.6 13.6 21.7 17.7 14.9 9.0
Total 52.6 59.0 66.9 50.5 50.1 70.0
Country of Origin
UK 20.8 20.6 19.1 13.5 13.0 13.8
Rest of EU 15** 11.7 10.3 11.3 9.7 12.6 8.9
EU 10*** - - - 26.2
USA 5.5 6.7 6.6 4.7 4.8 4.3
Rest of world 14.5 21.5 29.9 22.5 19.7 16.8
Total 52.6 59.0 66.9 50.5 50.1 70.0
Net Migration 26.0 32.8 41.3 29.8 31.6 53.4
Source: CSO (2005), Population and Migration Estimates, April 2005: Tables 6 and 8 * Preliminary
**Rest of EU 15: countries before enlargement on 1 May 2004
Table J: Number of Immigrants by Nationality & Country of Origin, 2000 - 2005
[image:28.595.100.492.390.647.2]'000
2000 2001 2002 2003 2004 2005
2000 - 2005
Total Domestic - Trips 5,478 6,307 6,452 6,657 7,001 7,173 39,068
Caravan/Camping 295 323 293 282 277 298 1,768
Guest House/B&B 724 675 729 720 699 661 4,208
Own Holiday Home 185 211 289 259 294 365 1,603
Hotel/Conference Centre 1,669 2,042 2,041 2,160 2,355 2,597 12,864 Self Catering/Rented House 456 550 494 576 583 547 3,206 Friends/Relatives 1,935 2,241 2,359 2,363 2,512 2,430 13,840
Other 214 264 246 298 282 278 1,582
Total Domestic - Nights 20,703 23,207 22,222 23,616 24,189 24,607 138,544
Caravan/Camping 1,808 2,177 1,706 1,879 1,635 1,595 10,800 Guest House/B&B 2,275 2,217 2,038 2,067 1,963 1,816 12,376 Own Holiday Home 1,082 1,405 1,742 1,572 2,014 2,174 9,989 Hotel/Conference Centre 4,689 5,316 5,357 5,762 5,836 6,358 33,318 Self Catering/Rented House 3,090 3,749 3,168 3,754 3,701 3,582 21,044 Friends/Relatives 6,594 7,023 6,912 7,175 7,736 7,562 43,002
Other 1,165 1,320 1,298 1,407 1,303 1,520 8,013
Nights
Average Length of Stay 3.8 3.7 3.4 3.5 3.5 3.4 3.5
Caravan/Camping 6.1 6.7 5.8 6.7 5.9 5.4 6
Guest House/B&B 3.1 3.3 2.8 2.9 2.8 2.7 2.9
Own Holiday Home 5.8 6.7 6.0 6.1 6.9 6.0 6.2
Hotel/Conference Centre 2.8 2.6 2.6 2.7 2.5 2.4 2.6
Self Catering/Rented House 6.8 6.8 6.4 6.5 6.3 6.5 6.6
Friends/Relatives 3.4 3.1 2.9 3.0 3.1 3.1 3.1
Other 5.4 5.0 5.3 4.7 4.6 5.5 5.1
Most Common Length of Stay 2 2 2 2 2 2 2
Caravan/Camping 2 2 2 2 2 3 2
Guest House/B&B 2 2 2 1 2 2 2
Own Holiday Home 2 2 2 3 3 2 2
Hotel/Conference Centre 2 2 2 2 2 2 2
Self Catering/Rented House 7 7 7 7 7 7 7
Friends/Relatives 2 2 2 2 2 2 2
Other 2 2 2 2 2 2 2
Source: CSO (2006) Domestic Tourism in Ireland, 2000-2005 - Table 20 2000 - 2005
[image:29.595.109.497.180.660.2]