Journal of Chemical and Pharmaceutical Research, 2012, 4(2):1271-1280
Research Article
CODEN(USA) : JCPRC5
ISSN : 0975-7384
Structural, optical and thermal studies of cobalt doped hexagonal ZnO by
simple chemical precipitation method
S. Udayakumar
1, V.Renuka
2, K.Kavitha
21
Department of Chemistry, Kings College of Engineering, Punalkulam, Thanjavur
2
Department of Chemistry, National College, Tiruchirapalli
3
Department of Chemistry, S.T.E.T Womens College, Mannargudi
______________________________________________________________________________
ABSTRACT
Cobalt doped zinc oxide nanoparticles were prepared through simple chemical precipitation method. X-ray diffraction studies confirm the prepared particles are in Wurtzite structure. Scanning Electron Microscopy and TEM studies show the shape and morphology of the particles. To identify the presence of cobalt in ZnO, XRD and FTIR studies were done. A thermal property of undoped and doped ZnO were studied by TGA &DTA analysis. Optical absorption measurements confirm the presence of exciton peak at 341 nm. Photoluminescence studies were done with the excitation wavelength of 395 nm.
Key words: Cobalt, nanoparticles, wurtzite, photoluminescence, TEM.
______________________________________________________________________________
INTRODUCTION
Nanoscience and technology needs new materials which will be useful to make new class of nanodevices (1). Semiconductor, metallic nanoclusters and carbon based nanostructures are the materials gained more interests. Among these, Semiconductor nanoparticles obtained more importance because of its exciting optical properties like size dependent absorption and emission properties (2, 3). These novel physical and chemical properties which are essential for nano electronics (4), biological (5), and catalytic applications. These applications drive scientific community to probe its electronic structure through exciton dynamics. Zinc oxide (ZnO) is a II –VI group semiconductor with Wurtzite crystal structure a direct and wide band gap of 3.37eV, a large exciton binding energy (60meV) and high optical gain at room temperature (6-8). Wurtzite ZnO has been widely used to demonstrate numerous applications including field effect transistor (9) optical device (10), dye-sensitized solar cell (11) and solid state gas sensor (12, 13).
Currently, modification of ZnO properties by impurities/ dopant incorporation has become a hot topic. Doping ions in ZnO will make scientists to tailor its optical, electrical and magnetic properties through altering its electronic structure (14).
______________________________________________________________________________
EXPERIMENTAL SECTION
2.1. Chemicals
Zinc acetate, Zn (CH3COO) 2. 2H2O, cobalt acetate, and polyvinylpyrrolidone (PVP MWt 4000) used in this study were received from Aldrich, USA and all other chemicals and solvents used were obtained from commercial sources with high purity analytical grade reagent. Double distilled (DI) water was used for the preparation of all reagents.
2.2 Synthesis of ZnO: Co2+ nanoparticles
ZnO nanoparticles doped with Co2+ (0.5-2.5 %) ions were prepared by simple chemical precipitation method. The
reactants were zinc acetate, cobalt acetate, and polyvinyl pyrolidone (PVP mw4000) which are all of analytical purity. Ultra pure deionized water and ethanol (equal volume) were used as the reaction medium. In a typical procedure, ethanol –water mixture solution of 100 ml of 0.2M Zinc acetate and different concentration of cobalt acetate in 25 ml water were added by constant stirring using magnetic stirrer. A selected concentration of PVP (1g) was added to the precursor solution, followed by an addition of 0.2M NaOH drop by drop to form the precipitate. The precipitate was washed with water and ethanol for several times and dried in oven for 2hrs at 120oC.
2.3 Apparatus
The XRD patterns of the powdered samples were recorded using X PERT-PRO diffractometer with a Cu Kα
radiation (λ=1.5406 Ao). The crystallite size was estimated using the Debye-Scherer equation of the major XRD peak. The size and morphology of the nanoparticles were studied using SEM (HITACHI model S-3000H), and TEM (PHILIPS-CM 200; 20-200 kv) microscopes. All samples were prepared by Drop Cost Method using carbon coated copper grid. The UV spectra of all the samples in deionized water were recorded using UV-1650PC SHIMADZU spectrometer. Fluorescence measurement was performed on a RF-5301PC spectrophotometer. Emission (350-600 nm) spectra were recorded under the different excitation wavelength at room temperature. The FT-IR spectra were obtained on an AVATOR 360 spectrometer using KBr pellet technique. Thermo gravimetric and differential thermal analysis (TG-DTA) was carried out with SDT Q 60020 thermometer in air atmosphere.
RESULTS AND DISCUSSION
3.1 XRD
The powder samples were characterized by XRD and the diffraction patterns are shown in fig (1). These patterns were compared with standard JCPDS (JCPDS 89-1397) [20] value.
The average grain size of the pure ZnO: Co samples were calculated from the full width half maximum (FWHM) of the diffraction peaks using the Debye–Scherrer equation [21];
D= kλ/ (βcosθ)
Where D= Crystalline diameter.
λ = wave length of X- ray radiation.
β= FWHM and θ is the Bragg angle.
By changing the concentration of the dopant varying the temp of the reaction medium, the size of the ZnO nanoparticles vary from 18 to 34 nm. The increases in size of ZnO is due to Co ions get substituted in more number on the surface of ZnO.
All the XRD peaks were be indexed which confirms the prepared nanoparticles are hexagonal Wurtzite structure of ZnO. This is very much in agreement with existing literature (22). The crystallinity in the Wurtzite structure of ZnO is restored by the addition of Co as a dopant which is confirmed by increase in the intensity of main peak (101) as the concentration of Co increased from 0.5 to 2.5. No extra peaks were found in the pattern show the formation of single phase.Zn1-x Cox o. This indicates that the doped Co atoms substitute Zn atoms without changing ZnO Wurtzite structure.
3.2 SEM and TEM study 3.2.1 SEM analysis
______________________________________________________________________________
Fig: 2(a, b) SEM Micrograph of ZnO Nanoparticles
3.2.2 TEM ANALYSIS
TEM images are used to study the microstructures of the prepared samples andto measure several particles. The variations in XRD results were well supported by TEM measurements. Fig (2) shows the representative TEM images of the prepared samples. The morphology of the sample was found to be nearly spherical in nature having diameters ranging from 10 to 16nm for different samples.
Fig: 3. (A B C D E and F) shows TEM images of ZnO; Co
Fig (3B) shows that the previously formed nano ball is grown to form nano rods. It looks like ginger in shape. Figs (3C) and (3d) present a rod like structure which indicates the formation of nano rods by combination of nano particles. Fig (3d) shows a well crystallized nanorods formation and looks similar to ice bars. Furtherthe areas of various dark shades gives information about the presence of nano particles in close to each other.
[image:5.595.146.453.181.722.2]Fig (3D and 3F) show that the representative Selected Area Electron Diffraction (SAED) pattern for the sample with 1.5 % Co doped ZnO. This SAED pattern shows that the prepared ZnO nanoparticles were crystalline in nature.
______________________________________________________________________________
3.3 Optical studies.
3.3.1UV-VISIBLE
Fig (4) shows the UV-Visible absorption spectra collected from different Zn1-x Cox o thin films. The absorption band between 338-341.4 originates from ZnO. The position of the absorption spectra is observed to shift towards the lower wavelength side with increasing Co doping concentration in ZnO. This indicates that the band gap of ZnO material increase with doping concentration of Co2+ ions. The increase in the band gap (or) blue shift can be explained by the Burstein–effect. This is the phenomenon that the Fermi level merges into the conduction band with the increase of the carrier concentration. Thus the low energy transitions are blocked (23, 24)
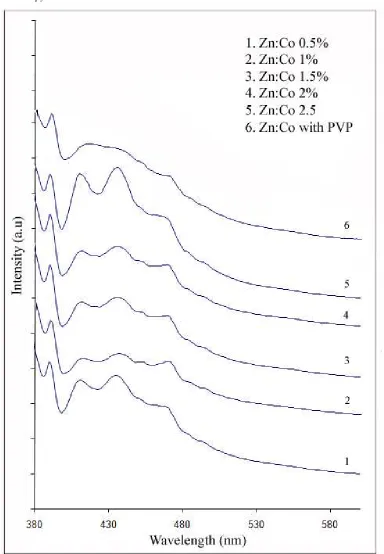
[image:6.595.117.501.185.739.2]Fig(5) shows the photoluminescence (PL) spectrum of Zn1-x Cox o textured thin films at room temperature with different levels of Co contents which is an effective method for the investigation of intrinsic point defects in ZnO such as Zinc vacancies, interstitial oxygen, interstitial zinc and oxygen vacancies (25). As shown in fig (5) all
samples exhibit a strong UV emission at 395nm, 420nm and 440nm and two relatively weak emission bands centre
at 445 and 480nm. The UV luminescence band belongs to the exciton recombination corresponding to near-band-edge emission of the Zn1-x Cox o films (26). The position of each samples UV emission peak is marked in the spectra and it can be clearly observed that the UV emission peaks generate red- shift phenomenon. This could mainly due to the sp-d exchange interactions between the band electrons and the localized electrons of the Co2+ ions substituting Zn ions (27-29).
The s-d and p-d exchange interactions cause a negative and positive correction to the conduction and valence band edges respectively, which therefore leads to band gap narrowing (30). Besides the intensity of UV emission decreases successively with the concentration of Co2+ increasing from 0.5% to 2.5%. This may be due to more defect states below the conduction band occurs via Co doping, so that some of the excited electrons in the conduction band relax to the defect states which leads to decreasing in UV emission intensity (31). The weak peak at 455nm and 480nm is blue emission is attributed to the transition from extended Zn; states.(ie), the electrons can first transit to the conduction band or Zn; state and finally transit to the valence band with blue emission.
3.4 FT-IR STUDY
______________________________________________________________________________
between 1650 and 1400cm_1 corresponding to the asymmetric and symmetric stretching of the carboxyl group (C=O) [32]. FTIR spectrum of the film annealed at room temperature shows decrease in absorption of carboxylate group (C=O) suggesting the removal of organic residuals. The spectra show absorptionpeakat437cm_1 corresponding to the stretching mode of Zn–O. These results confirm the formation of ZnO Wurtzite structure in the Co doped ZnO thin films annealed at room temperatuere.
3.5. TG DTA STUDY:
Fig: 7. TG-DTA curves of ZnO; cobalt with pvp.
Fig (7) shows that the typical DTA-TGA curves for the prepared Co doped ZnO nanoparticles (2wt %) precursor. The exothermic peak round 1500 C is associated with the decomposition of residual OH groups and the condensation
of non bonded oxygen, which causes 20% of the weight loss. An exothermic peak at 3500 C was clearly observed,
which is possibly related to the crystallization of ZnO. (33)
CONCLUSION
______________________________________________________________________________
temperature, the emission peak position of doped nanoparticles show a shift in UV region and the luminescence performance enhances in the VL region, which are respectively attributed to the tune effect of Co-doping on the energy level of ZnO nanoparticle and increase in the amount of defects because of doping. In addition, the emission property of Co-doped ZnO nanorod arrays exhibit novel performance towards low temperature in the VL region, which is ascribed to the abundance of surface states due to Co-doping and decrease in the vibration of phonons in wurzite hexagonal nanoparticles. Thermal properties of ZnO nanoparticles shows can withstand up to 1011 o C. These properties of Co doped ZnO nanoparticles can be used in opto-electronics and thermally stable devices.
Acknowledgements
The authors are deeply indebted to Dr.K.Pandian Professor and Head Dept. Of Nano technology, Alagappa College of technology, Chennai, G. Murugadoss Annamalai University, for their inspiring help, constant support and for providing adequate laboratory facilities in the department to carry out the research work.
REFERENCES
[1]. G.W.Walker; V.C.Sundar; A.W.Wun; M.G.Bawendi; D.G.Nocera, Appl.Phys.Lett., 2003 83 3555. [2]. M.Hong; M.Gua-Hong; G.Xue-Xi; M.Hong-Liang; Chin, Phys. 2008, B 17 1280.
[3]. S.Neelshwer; C.L.Chen; C.B. Tsai; Y.Y.Chen; S.G.Shyu; M.S.Seehra, Phys.Rev. B. 2005, 71 201370 (R). [4]. O.Stier; M.Grundmann; D.Bimberg, Phys.Rev. B1999, 59 5688.
[5]. A. Hosino; K. Fujioka; T. Oku; S.Nakamura; M. Suga;Y.Yamaguchi; K.Suzuki; M. Yasukara; K. Yamamoto,
Microbiol. Immunol. 2004,48 985.
[6]. M. Huang; S.Mao; H.Feick; H.Yan; Y.Wu; H.kind; E.Weber; R.Russo, p.Yang, Science 2001292 1897. [7]. E.Wong; P.Searson, Appl.Phys. Lett. 1999,74 2939.
[8]. S.Choopun;R.Vispute; W. Vispute ;W. Noch; A. Balsamo; R. Sharma; T.Venkatesan; A. Iliadis; D.Look,
Appl.Phys. Lett. 1999, 75 3947.
[9]. X.D.Wang; J.Zhou; J.H. Song; J.Liu; N.Xu; Z.L.Wang, Nano Lett. 2006, 6 2768.
[10]. P.D.Yang; H.Q.Yan; S.Mao; R.Russo; J.Johnson; R.Saykally; N.Morris; J.Pham; R.He, H.J.Choi,Adv.
Funct.Mater. 2002, 12 323.
[11]. M.Law;L.E.Greene; J.C./Jhonson; R.Saykally; P.D.Yang, Nat.Mater, 2005, 4 455. [12]. S.C.Navale; S.W.Gosavi; I.S. Mulla, Talanta 2008, 75 1315.
[13]. Jun Zhang; Shurong Wang; Yan Wang; Mijuan Xu; Huijuan Xia; Shoumin Zhang; Weiping Huang; Xiannzhi Guo; shihua Wu, Sens.Actuators B 2009,139 411p.
[14]. Z.Tao; X.Yu; X.Fej; J.Liu; G.Yang; Y.Zhao; S.Yang; L.Yang, Opt.Matter. 2008 31 [15]. A.Sedky; M.Abu-Abdeen; Abdalaziz A.Almulhem, Physica B 2007, 388 266.
[16]. D.Yuan, G.S.Wang; Y.Xiang; Y.Chen; X.Q.Gao; G.Lin, J.Alloys Compd. 2009, 478 489. [17]. X.C.Wang; W.B. Mi; S.Dong; X.M.Chen; B.H.Yang, J.Alloys of compd. 2009, 478 507. [18]. R.M.Mamta Sharma; Mehra, Appl.Surf.Sci. 2008, 255 2527.
[19]. SalihaIlican; Yesimin Caglar; Mujdat Cagler; Fahrettin Yakuphonaglu, Appl.Surf.Sci 2008, 255 2353. [20]. Deka; S., Joy, P.A, Chem.Mater. 2005, 17 6507.
[21].Takuya Tsuzuki; Zoe Smith; Andrew Parker; Rongliang He; Xungai Wang, Journal of the Australian Ceramic
Society 2009,Volume 45[1], 58-62.
[22]. P.S. Cho; K-W; Kim; J.H.Lee, J.Electroceram, 2006, 17 975. [23]. Yang Huuaming; Nie Sha, Matter Chem Phys 2009; 114:279-82.
[24]. Sakai K; Kakeno T; Ikari T; Sirakata S; Sakemi T; Awai K; Yamamoto T, J.Appl phys 2006; 99:043508-4. [25]. Y.C.Qiu; W.Chen; S.H.Yang; B. Zhang; X.X. Zhang; Y.C.Zhong; K.S. Wong, Cryst,Growth Des, 2010, 10 1. [26]. J.J.Wu; S.C.Liu, Adv.Mater, 2002, 14 215.
[27]. J.Diouri; J.P.Lascaray; M.Amrani, Phys.Rev. B 1985,31 7995.
[28]. R.B.Bylsma; W.M.Becker; J.Kossut; U.Debska; D.Yoder-Short, Phys.Rev. B1986, 33 8207-8215. [29]. Y.D. Kim;S.L.Cooper; M.V.Klein; B.T. Jonker, Phys. Rev. B 1994, 49 1732-1742.
[30]. Y.R.Lee;A.K.Ramdas; R.L.Agarwal,Phys.Rev. B1988, 38 10600.
[31]. A.H. Wang; B.L.Zhang; X.C.Wang; N.Yao; Z.F.Gao; Y.K.Ma; L.Zhang; H.Z.Ma, J.Phys. D: Appl.Phys. 2008, 41 215-308.