Comparison of Detection Techniques in Optical CDMA Access Network for
Point to Multipoint Configuration
M. Othman
1, M.F.M. Rejab
1, R. Talib
1, N.A. Cholan
1, M.F.L. Abdullah
1, S.A. Aljunid
2and M.K. Abdullah
3.
1
Department of Communication Engineering, Faculty of Electrical and Electronic Engineering,
Universiti Tun Hussein Onn Malaysia , 86400 Parit Raja, Batu Pahat, Johor, Malaysia.
2
School of Computer & Communication Engineering Universiti Malaysia Perlis, No 12 & 14,
Jalan Satu, Taman Seberang Jaya, Fasa 3, 02000 Kuala Perlis, Perlis Malaysia
3
Photonics Laboratory, Department of Computer and Communication System, Faculty of
Engineering, Universiti Putra Malaysia, 43400 Serdang, Selangor, Malaysia.
email :
[email protected]
,
[email protected]
,
[email protected]
Abstract
In this paper, we are proposing a detection scheme known as spectral direct detection technique implemented with Fiber Bragg Grating (FBG) act as encoder/decoder. This FBG based is used to encode and decode the spectral amplitude coding namely modified double weight (MDW) code in Optical Code Division Multiple Access (OCDMA). This code is used due to its flexibility where its weight can be any even number that greater than two. Moreover, it can maintain the cross-correlation parameter equal to one. The performance of spectral direct detection technique against AND-subtraction technique which is both implemented with FBG based encoder/decoder is compared via simulation in downstream and upstream access network at point to multipoint (P2MP) configuration. The simulation will be carried out using OptiSystem version 6.0 and the performance is characterized through bit error rate (BER) and power received at various bit rate.
1.
I
NTRODUCTIONIn optical CDMA systems, the detection process affects the design of receiver and transmitter. Basically, there are two types of detection technique; coherent and incoherent. The coherent detection technique refers to detection signal with knowledge of phase information of the carrier, while incoherent detection technique is reversely from coherent detection
technique. By referring to incoherent detection technique, this technique does not need phase synchronization. Therefore, it will reduce the hardware’s complexity of the systems. Due to this advantage, we prefer to choose incoherent detection technique rather than coherent detection technique for this paper.
In optical systems, rectangular filters are used as the encoder/decoder in front of LED in order to narrow down the linewidth before transmission [1]. In this paper, we used Fiber Bragg Grating (FBG) as encoder/decoder because it acts as a perfect filter. In FBG based encoder/decoder, the strain and temperature that introduced to the grating have direct effect to the Bragg wavelength [2-4]. Thus, the value of the Bragg wavelength of the FBG will be shifted by these two elements. Generally, the existing Optical CDMA coding scheme are using an arrayed of FBG as the encoder and decoder to provide an all-optical signal processing to the systems and a balanced photo detection scheme at the receiver [5].
same time decrease the number of FBG as encoder/decoder.
2.
T
HEORYA. AND Subtraction Detection Technique
In AND subtraction technique [8], the cross-correlation θXY
( )
k is substituted byθ(X&Y)Y, where) &
(X Y
θ represents the AND operation between
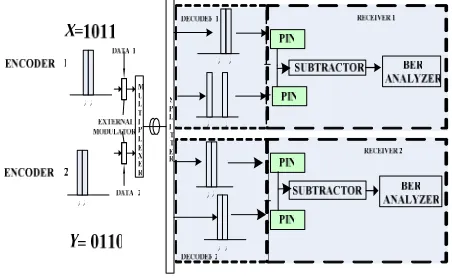
sequences X and Y. For example, let X = 1011 and Y = 0110 and therefore (X AND Y) = 0010. Example of an AND receiver is shown in Figure 1.
At the receiver,
( )
−
( & )( )
=
0
=
k
k
Z
ANDθ
XYθ
X Y Y (1) [image:2.612.315.554.73.201.2]Equation (1) shows that, with AND subtraction technique, the multiple access interference or the interference from other channels can also be cancelled out. This subtraction technique can be implemented with any OCDMA codes, but for comparison purposes, the Modified Double Weight (MDW) code [9] is used as an example.
Figure 1: Implementation of the AND Subtraction Technique
B. Spectral Direct Detection Technique
The implementation of spectral direct detection
technique is completely different from AND
subtraction detection technique. Figure 2 shows the implementation of spectral direct detection technique.
[image:2.612.72.298.389.528.2]
Figure 2: Spectral direct detection technique for optical spectrum CDMA
For this detection scheme, only wanted spectral chip in the optical domain is filtered. This detection scheme doesn’t need subtraction detection technique at electric side. Therefore, MAI and Phase Induced Intensity Noise (PIIN) will not exist in this detection scheme. Nevertheless, this technique is only applicable to codes, which the spectral chips are not overlapped with other spectral chips of the other channel, i.e. a minimum of one clean chip in every code sequence. MDW and modified frequency hopping (MFH) [10] are the examples of codes that have this property.
3.
S
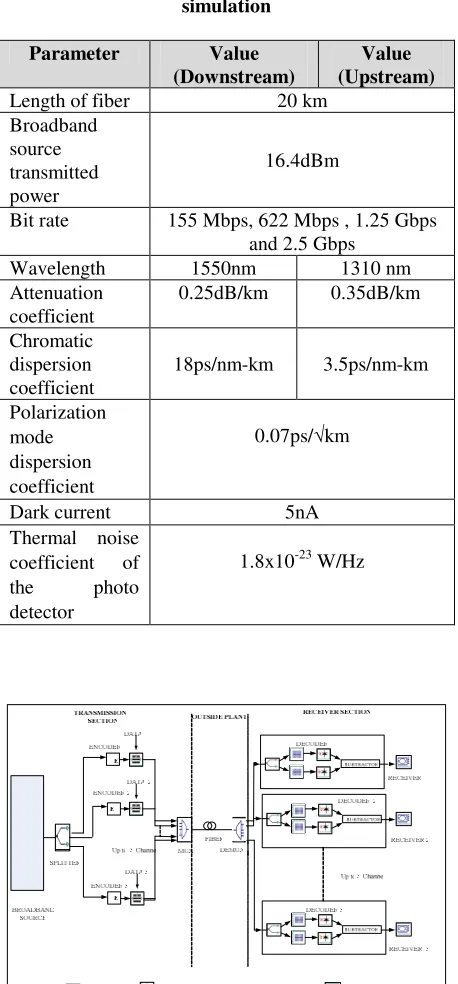
IMULATION SETUP OF OPTICAL CDMAThe setups of the detection scheme with MDW are illustrated in Figure 3 and 4 respectively for point to multipoint network. The ITU-T G.652 standard single mode optical fiber is used in the simulation. Table 1 shows the parameter values used for the simulation of the OCDMA system.
Table 1. Parameter values used for experimental simulation
Parameter Value
(Downstream)
Value (Upstream)
Length of fiber 20 km
Broadband source transmitted power
16.4dBm
Bit rate 155 Mbps, 622 Mbps , 1.25 Gbps
and 2.5 Gbps
Wavelength 1550nm 1310 nm
Attenuation coefficient
0.25dB/km 0.35dB/km
Chromatic dispersion coefficient
18ps/nm-km 3.5ps/nm-km
Polarization mode dispersion coefficient
0.07ps/√km
Dark current 5nA
Thermal noise coefficient of
the photo
detector
1.8x10⁻²³ W/Hz
Figure 3: Point-to-Multipoint Network Simulation Setup for AND Subtraction Detection Technique
At the receiver side of the system, the incoming signal splits into two parts, one to the decoder that has an identical filter structure with the encoder and the other to the decoder that has AND filter (Figure 3) structures. A subtractor is then used to subtract the
overlapping data from the intended code. For spectral direct detection technique (Figure 4), there will be no subtractor used to subtract the overlapping data. In this detection scheme only desire spectral chip in the optical domain is filtered. The results taken after the subtraction are discussed in the next section.
[image:3.612.316.540.168.332.2]
Figure 4: Point-to-Multipoint Network Simulation Setup for Spectral Direct Detection Technique
4.
R
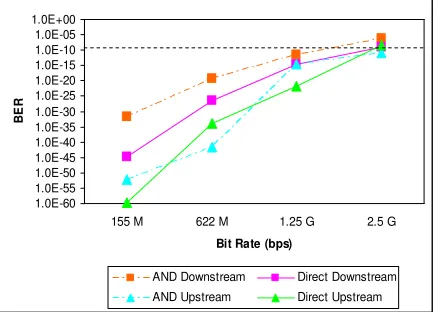
ESULTS AND DISCUSSIONSFigure 5 and Figure 6 shows the results of experimental simulation using AND subtraction detection technique and spectral direct detection techniques for point-to-multipoint network in downstream and upstream direction at various bit rate. The distance was set at 20 km.
By increasing the bit rate, it will decrease the pulse width; consequently, changing the bit rate will affect the received signals. Figure 5 shows the performance of spectral direct detection technique and AND subtraction detection technique for BER against various bit rate.
From the graph we can see that the acceptable bit rate for both techniques is 1.25 Gbps for downstream application. While for upstream, at 2.5 Gbps it still shows a considerable reading which is 1x10⁻⁹. This is due to different attenuation and dispersion for 1550 nm and 1310 nm will cause different result for downstream and upstream direction. The attenuation at 1310 nm (upstream) was higher than attenuation at 1550 nm. Thus, the BER for upstream direction is higher than downstream direction. So, it clearly shows that upstream direction has higher BER than downstream direction due to the effect of attenuation and dispersion at different wavelength.
1.0E-60 1.0E-55 1.0E-50 1.0E-45 1.0E-40 1.0E-35 1.0E-30 1.0E-25 1.0E-20 1.0E-15 1.0E-10 1.0E-05 1.0E+00
155 M 622 M 1.25 G 2.5 G
Bit Rate (bps)
B
E
R
AND Downstream Direct Downstream AND Upstream Direct Upstream
Figure 5: BER versus bit rate for spectral direct detection technique and AND subtraction detection technique at 20 km for P2MP network
The power received for both detection schemes is decreased due to increased of bit rate. Increasing the bit rate will decrease the pulse width, making the signal to be more sensitive to fiber dispersion and receiver circuitry noise. Figure 6 shows the performance of spectral direct detection and AND subtraction detection technique in different bit rate at downstream and upstream directions.
At 155 Mbps, the power received for spectral direct detection for downstream directions is about -49 dBm while for AND subtraction at same bit rate and directions, the power received is about -59 dBm. The power loss is high at AND subtraction detection
technique is due to more FBG used as
encoder/decoder. Thus, it is clear that spectral direct detection can support higher bit rate than AND subtraction due to the less power loss.
-75 -70 -65 -60 -55 -50 -45
155 M 622 M 1.25 G 2.5 G
Bit Rate (bps)
P o w e r R e c e iv e d ( d B m )
[image:4.612.318.543.71.229.2]AND Downstream Direct Downstream AND Upstream Direct Upstream
Figure 6: Power received versus bit rate for spectral direct detection technique and AND subtraction detection technique at 20 km for P2MP network
From the figure we can see that, the graph pattern for AND subtraction technique does not show so much different due to power loss between downstream and upstream application. However, for direct detection for upstream application it shows that the power received decreased sharply from 155 Mbps to 2.5 Gbps. Compared with direct detection for downstream direction it start to dropped steadily from -49 dBm to -55 dBm at 155 Mbps until 622 Mbps. After 622 Mbps the power received remain stable at -55 dBm. From these results, it can be seen that the power received at upstream is slightly lower compared to power received at downstream direction. These phenomena happened due to higher attenuation at 1310 nm where it is used as a center wavelength for upstream direction. Therefore, the power received at downstream is better than power received at upstream directions.
5.
C
ONCLUSIONSGenerally, the performance of the OCDMA system is decrease as the bit rate is increased. This is because the effect of attenuation and dispersion in the fiber. In this paper, we have used spectral direct detection technique and it implemented with MDW codes with weight equal to 4. For this detection scheme, the performance of OCDMA is improved compared to AND subtraction detection technique. It has been proved from the result of the simulation. This is because effect of MAI and PIIN has been eliminated.
[image:4.612.75.294.251.407.2]technique is lesser compared to AND subtraction detection technique. Thus, the power loss of both designs especially for AND subtraction can be reduced if less number of FBGs are used. Therefore, the complexity, cost and total power loss of the systems is reduced.
R
EFERENCES[1] H. J. R. Dutton, Understanding Optical Communication, New Jersey; Prentice Hall, 1998. [2] F. Ouellette, Tutorial on Fiber Bragg Gratings, Spie's
OE Magazine, January 2001.
[3] M.R. Mokhtar, M. Ibsen, P.C. Teh, & D.J. Richardson,Simple Dynamically Reconfigurable OCDMA Encoder/Decoder Based on a Uniform Fiber Bragg Grating, Optical Fiber Communication Conference and Exhibit, pp 688 – 690, 2002.
[4] Z. Zan, M. K Abdullah, S.A. Aljunid, R. K. Z. Sahbudin, M. H. Yaacob, M. Mokhtar & S. Shaari, Wavelength Shifting in the Fiber Bragg Grating (FBG) based Encoder and Decoder Modules for SAC-OCDMA System, IEEE International Conference on Semiconductor Electronics, pp. 996 – 1000, October 2006.
[5] Z. Zan, S. A. Aljunid, M. H. Yaacob, M. K. Abdullah & S. Shaari, Design Configuration of Encoder And Decoder Modules for Modified Double Weight (MDW) Code Spectral Amplitudes Coding (SAC) Optical Code Division Multiple Access (OCDMA) Based On Fiber Bragg Grating, Second International Conference on Advanced Optoelectronics and Lasers, 2, September 2005, 249 - 252.
[6] Lei Xu, I. Glesk, V. Baby & P.R. Prucnal, Multiple Access Interference (MAI) Noise Reduction in A 2D Optical CDMA Systems Using Ultrafast Optical Thresholding, 17th Annual Meeting of the IEEE Laser and Electro-Optics Society, 2, November 2004, 591-592.
[7] Jen-Fa Huang and Chao-Chin Yang, Reductions of Multiple-Access Interference in Fiber-Grating-Based Optical CDMA Network, IEEE Transactions on Communications, 50(10), October 2002, 1680-1687,. [8] S.A. Aljunid, Feras N.Hasson, M.D.A.Samad,
M.K.Abdullah, M. Othman & S. Shaari, Performance of OCDMA Systems Using AND Subtraction Technique, IEEE International Conference on Semiconductor Electronics, October 2006, 464 – 467.
[9] S. A. AlJunid, M. Ismail, B. M. Ali, A. R. Ramli, M. K. Abdullah, A New Family of Optical Code Sequences For Spectral-Amplitude-Coding Optical CDMA Systems, IEEE Photonics Technology Letters, 16(10), 2004, 2383-2385.