An Exploratory Study of Student Perception of Instructor
Traits in Effective Learning
Deepa S.
1,*, Manisha Seth
21Indian Institute of Management, Kozhikode (IIMK) 2Jaipuria Institute of Management, Lucknow
*Corresponding Author: [email protected]
Copyright © 2014 Horizon Research Publishing All rights reserved.
Abstract
Effective learning is an outcome of effective teaching. Effective teaching, in turn, requires effective instructors. This study addresses relevant issues related to effective learning by comparing student perceptions of instructor characteristics in a b-school. It is based on the conceptual premise that effective college learning depends more on personality characteristics which students perceive to be relevant in the teaching/learning environment. Even though an instructor may be an expert in his field and very rich academically, it is the manner in which he transfers information and knowledge to the students that matters the most. The results of the factor analysis applied in the study indicate that the six most vital factors for learning effectiveness are: style of managing class, evaluation of student performance, facilitation, teaching style, communication skills and attitude.Keywords
InstructorCharacteristics, Students’ Perceptions, Effective Learning1. Introduction
Effective instruction is an important constituent of the process of education. Comprehending student perceptions of an effective instructor has traditionally been a vital consideration. However, with the introduction of technology in education, online teaching and an increase in exchange programs among universities all over the world, it becomes imperative to understand what characteristics make an effective instructor from student perspectives. Therefore, instructors should be aware of student expectations.
This study addresses relevant issues related to effective learning by comparing student perceptions of instructor characteristics in a b-school. It is based on the conceptual premise that effective college learning depends more on personality characteristics which students perceive to be relevant in the teaching/learning environment. It can be stated that an instructor’s skill in organizing and managing his course requirements is an essential but not adequate
condition for achieving efficiency in the classroom. It is the personal characteristics which the instructor as an individual brings to the educational setting that bring out the difference between success and failure as an instructor, at least according to the student judgments.
2. Literature Review
Students and professors work together in divergent educational environments that disagree in any number of ways, including instructional approaches and equipment and facility resources. However, student perceptions regarding their educational experiences exist. According to Doyle (1977), in the research efforts on teacher effectiveness several impediments related to such things as uniformity of outcomes, methodology, and theoretical reflections are involved. After a long gap, Tuckman (1995) observed that there was an absence of consensus about definitions of effective teaching and absence of agreement over how to quantify it.
Bousfield (1940), Duncan and Leach (1934), and Kilcoyne (1949) conducted research that involved student ratings of instruction. Further, Voeks and French (1960) wanted to learn if there were variations between student ratings and grades received. Quick and Wolfe (1965) studied the responses of students responses in order to find out factors that depicted perfect college professors. It was Cashin (1996), who noted that research on student evaluation of instruction progressed substantially from the beginning of 1970s.
Costin, Greenough, and Menges (1971) appraised various studies which involved connections between student assessments and grades. Although some researchers found no relationships, others observed noteworthy positive relationships. Ahmadi, Helms, and Raiszadeh (2001) tested business students and stated that they were not in agreement that giving higher ratings than professors were worthy of, would have a negative effect on course grades. Moreover, students did not agree that higher ratings were given to professors who gave modest homework, if any. The respondents also specified that giving simple assessments did not produce higher rankings. Results of a study by Greenwald and Gillmore (1979) on a sample of 200 undergraduate classes at the University of Washington, maintained the viewpoint that lenient instructors received higher student rankings.
In a survey conducted on students and faculty at a Midwestern university to establish perceptions toward student ratings, Sojka, Gupta, and Detter-Schmelz (2002) found that students did not agree that rankings of instructors resulted in changes in courses or even teaching styles. However, faculty felt that easy and more amusing instructors were fitting to be more highly rated. The conclusion of Griffin’s study (2001) of instructor reputations indicated that positive information about instructors resulted in higher student ratings for courses and instructors, as against ratings by students who heard negative information. On investigating instructor behavior, Best and Addison (2000) observed that professors recognized as displaying warm behaviors most probably obtained higher ratings from students. Research studies into the emotional field have identified convincing associations between positive emotions, and better learning and creative thought (Norman, 2005).
There were other interesting observations when Badri, Abdulla, Kamali, and Dodeen (2006) appraised student evaluations in business programs at United Arab Emirates University. Students who predicted higher grades gave higher ratings to professors as compared to those who anticipated lower grades. Fassinger (2000) examined data from 51 classes and found that classes with higher levels of participation showed greater collaboration and association with the professors perceived as being more approachable and encouraging of students. In classes where there was lower student participation, professors held more positive outlook toward a class than that held by their students.
Axelrod (2008) has found that students’ perceptions of what constitutes effective instruction transcend time and mode of delivery.
3. Methodology
For the purpose of the study, primary data was collected from students of a private business school using a questionnaire. A sample of 250 students was selected through non-probabilistic convenience sampling, as it is
suitable for studies that are exploratory in nature. Convenience sampling method basically serves two-fold purpose: firstly respondents are selected because they are in the right place at the right time and secondly, convenience sampling technique is not recommended for descriptive or casual research but they can be used in exploratory research for generating ideas (Malhotra, 2005). The survey asked for information about perceptions of importance for instructor characteristics. The structure for the questionnaire and numerous items were adopted from a study by Moorman (2004). Participants responded to statements using a 5-point Likert scale, which ranged from not important (1) to very important (5).
4. Data Analysis & Findings
According to the chosen methodological research approach, statistical package SPSS version 15 was used. Factor analysis has been employed particularly for the statistical analysis.
Factor analysis is a data reduction statistical technique that allows simplifying the correlation relationships between numbers of variables. Various steps were performed to identify the important factors of Student perception of Key Instructor Characteristics in Effective Learning.
Step1:
The correlation matrices were computed, which revealed that there is enough correlation to go ahead for factor analysis.
Step2:
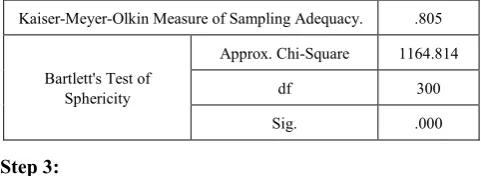
To test the sampling adequacy, Kaiser-Meyer-Olkin Measure of Sampling Adequacy (MSA) was computed and found to be 0.805 significant at .01 level. It indicates that sample is good enough for sampling (Table 1).
Table 1. Results of Sampling Adequacy Test and Validity of Factor Analysis Data
Kaiser-Meyer-Olkin Measure of Sampling Adequacy. .805
Bartlett's Test of Sphericity
Approx. Chi-Square 1164.814
df 300
Sig. .000
Step 3:
[image:2.595.311.552.545.633.2]was employed for extracting the data, which allowed determining the factor underlying the relationship between a numbers of variables. The factor analysis was performed on the 30 items.
Loadings on factors can be positive or negative. A negative loading indicates that this variable has an inverse relationship with the rest of the factors. The higher the loading, the more important is the factor. All the loadings in this research are positive (Table 2).
Rotation is necessary when extraction technique suggests that there are two or more factors. The rotation of factors is designed to give an idea of how the factors initially extracted differ from each other and to provide a clear picture of which item loads on which factor (Table 2).
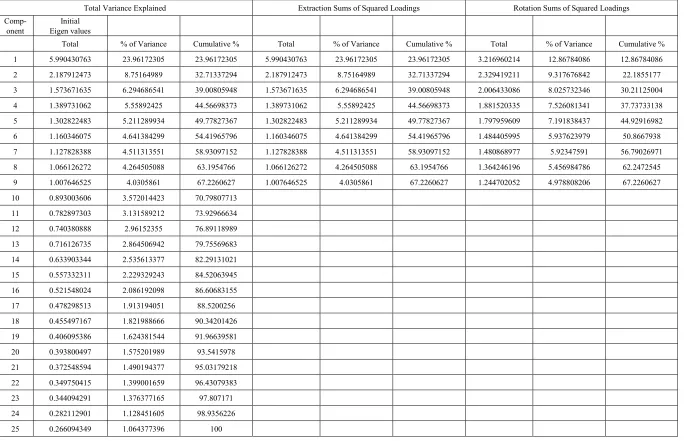
There are only nine factors, each having Eigen value exceeding 1 for learning effectiveness (Table 3). The Eigen values for the nine factors are 5.990, 2.188, 1.573, 1.390, 1.303, 1.160, 1.128, 1.066, and 1.008 respectively. The percentage of the total variance is used as an index to determine how well the total factor solution accounts for
what the variables together represent. The index for the present solution accounts for 67.23 percent of the total variations for learning effectiveness. It is pretty good extraction as it can economize on the number of factors (from twenty five factors to nine factors). The percentage of variance explained by factor one to nine in learning effectiveness are 23.962, 8.752, 6.295, 5.559, 5.211, 4.641, 4.511, 4.264, 4.030 respectively.
After nine factors are extracted and retained, the communality is .629 for variable 1, .708 for variable 3 and so on (Table 4). It means that 63 percent of the variance of variable 1 is captured by the nine extracted factors together. The proportion of variance in any one of the original variables, which is being captured by the factor, is known as communality (Nargundkar 2002). Large communalities indicate that a large number of variance has been accounted for by the factor solution.
The varimax rotated factor analysis results for factors of learning effectiveness can be understood with the help of the computed data (Table 5).
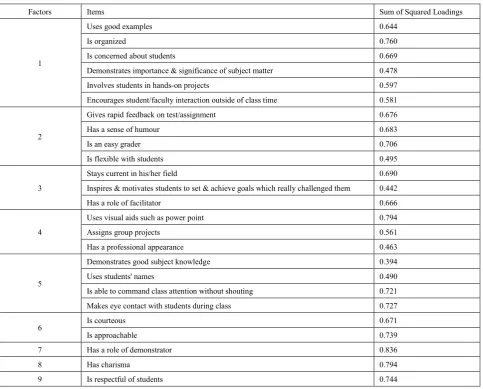
Table 2. Factor wise Sum of Squared Loadings for Learning Effectiveness
Factors Items Sum of Squared Loadings
1
Uses good examples 0.644
Is organized 0.760
Is concerned about students 0.669
Demonstrates importance & significance of subject matter 0.478
Involves students in hands-on projects 0.597
Encourages student/faculty interaction outside of class time 0.581
2
Gives rapid feedback on test/assignment 0.676
Has a sense of humour 0.683
Is an easy grader 0.706
Is flexible with students 0.495
3
Stays current in his/her field 0.690
Inspires & motivates students to set & achieve goals which really challenged them 0.442
Has a role of facilitator 0.666
4
Uses visual aids such as power point 0.794
Assigns group projects 0.561
Has a professional appearance 0.463
5
Demonstrates good subject knowledge 0.394
Uses students' names 0.490
Is able to command class attention without shouting 0.721
Makes eye contact with students during class 0.727
6 Is courteous 0.671
Is approachable 0.739
7 Has a role of demonstrator 0.836
8 Has charisma 0.794
[image:3.595.65.549.336.725.2]Table 3. Total Variations, Extracted and Rotated Sum of Square Loadings for Learning Effectiveness
Total Variance Explained Extraction Sums of Squared Loadings Rotation Sums of Squared Loadings
Comp-
onent Eigen values Initial
Total % of Variance Cumulative % Total % of Variance Cumulative % Total % of Variance Cumulative %
1 5.990430763 23.96172305 23.96172305 5.990430763 23.96172305 23.96172305 3.216960214 12.86784086 12.86784086
2 2.187912473 8.75164989 32.71337294 2.187912473 8.75164989 32.71337294 2.329419211 9.317676842 22.1855177
3 1.573671635 6.294686541 39.00805948 1.573671635 6.294686541 39.00805948 2.006433086 8.025732346 30.21125004
4 1.389731062 5.55892425 44.56698373 1.389731062 5.55892425 44.56698373 1.881520335 7.526081341 37.73733138
5 1.302822483 5.211289934 49.77827367 1.302822483 5.211289934 49.77827367 1.797959609 7.191838437 44.92916982
6 1.160346075 4.641384299 54.41965796 1.160346075 4.641384299 54.41965796 1.484405995 5.937623979 50.8667938
7 1.127828388 4.511313551 58.93097152 1.127828388 4.511313551 58.93097152 1.480868977 5.92347591 56.79026971
8 1.066126272 4.264505088 63.1954766 1.066126272 4.264505088 63.1954766 1.364246196 5.456984786 62.2472545
9 1.007646525 4.0305861 67.2260627 1.007646525 4.0305861 67.2260627 1.244702052 4.978808206 67.2260627
10 0.893003606 3.572014423 70.79807713
11 0.782897303 3.131589212 73.92966634
12 0.740380888 2.96152355 76.89118989
13 0.716126735 2.864506942 79.75569683
14 0.633903344 2.535613377 82.29131021
15 0.557332311 2.229329243 84.52063945
16 0.521548024 2.086192098 86.60683155
17 0.478298513 1.913194051 88.5200256
18 0.455497167 1.821988666 90.34201426
19 0.406095386 1.624381544 91.96639581
20 0.393800497 1.575201989 93.5415978
21 0.372548594 1.490194377 95.03179218
22 0.349750415 1.399001659 96.43079383
23 0.344094291 1.376377165 97.807171
24 0.282112901 1.128451605 98.9356226
[image:4.808.67.751.95.536.2]Table 4. Extracted Communalities for Factors of Learning Effectiveness
Communalities Initial Extraction
Is courteous 1 0.629
Is approachable 1 0.649
Gives rapid feedback on test/assignment 1 0.708
Is respectful of students 1 0.715
Stays current in his/her field 1 0.570
Has a sense of humour 1 0.655
Uses visual aids such as powerpoint 1 0.702
Is an easy grader 1 0.604
Demonstrates good subject knowledge 1 0.778
Is flexible with students 1 0.568
Assigns group projects 1 0.611
Uses students' names 1 0.644
Uses good examples 1 0.603
Is organized 1 0.646
Is concerned about students 1 0.683
Is able to command class attention without shouting 1 0.707
Makes eye contact with students during class 1 0.790
Has a professional appearance 1 0.705
Demonstrates importance & significance of subject matter 1 0.608
Involves students in hands-on projects 1 0.695
Inspires & motivates students to set & achieve goals which really challenged them 1 0.608
Encourages student/faculty interaction outside of class time 1 0.698
Has charisma 1 0.726
Has a role of facilitator 1 0.736
Has a role of demonstrator 1 0.767
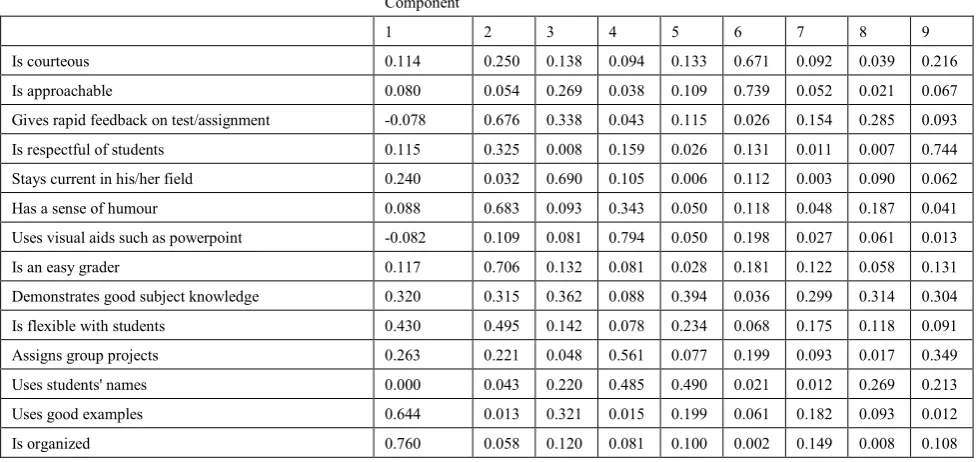
Table 5. Factor wise Results of Varimax Rotation Rotated Component Matrix(a)
Component
1 2 3 4 5 6 7 8 9
Is courteous 0.114 0.250 0.138 0.094 0.133 0.671 0.092 0.039 0.216
Is approachable 0.080 0.054 0.269 0.038 0.109 0.739 0.052 0.021 0.067
Gives rapid feedback on test/assignment -0.078 0.676 0.338 0.043 0.115 0.026 0.154 0.285 0.093
Is respectful of students 0.115 0.325 0.008 0.159 0.026 0.131 0.011 0.007 0.744
Stays current in his/her field 0.240 0.032 0.690 0.105 0.006 0.112 0.003 0.090 0.062
Has a sense of humour 0.088 0.683 0.093 0.343 0.050 0.118 0.048 0.187 0.041
Uses visual aids such as powerpoint -0.082 0.109 0.081 0.794 0.050 0.198 0.027 0.061 0.013
Is an easy grader 0.117 0.706 0.132 0.081 0.028 0.181 0.122 0.058 0.131
Demonstrates good subject knowledge 0.320 0.315 0.362 0.088 0.394 0.036 0.299 0.314 0.304
Is flexible with students 0.430 0.495 0.142 0.078 0.234 0.068 0.175 0.118 0.091
Assigns group projects 0.263 0.221 0.048 0.561 0.077 0.199 0.093 0.017 0.349
Uses students' names 0.000 0.043 0.220 0.485 0.490 0.021 0.012 0.269 0.213
Uses good examples 0.644 0.013 0.321 0.015 0.199 0.061 0.182 0.093 0.012
[image:5.595.64.546.86.485.2] [image:5.595.61.550.521.752.2]Is concerned about students 0.669 0.312 0.125 0.138 0.046 0.244 0.073 0.188 0.018 Is able to command class attention
without shouting 0.295 0.071 0.050 0.210 0.721 0.134 0.113 0.067 0.116
Makes eye contact with students during class 0.109 0.059 0.049 0.302 0.727 0.176 0.274 0.092 0.196 Has a professional appearance 0.260 0.298 0.205 0.463 0.091 0.024 0.229 0.260 0.404 Demonstrates importance & significance
of subject matter 0.478 0.309 0.403 0.064 0.124 0.060 0.046 0.071 0.303
Involves students in hands-on projects 0.597 0.101 0.117 0.345 0.223 0.098 0.158 0.331 0.048 Inspires & motivates students to set &
achieve goals which really challenged them 0.358 0.075 0.442 0.075 0.139 0.313 0.220 0.303 0.125 Encourages student/faculty interaction
outside of class time 0.581 0.029 0.217 0.086 0.075 0.319 0.407 0.178 0.029
Has charisma 0.132 0.071 0.187 0.042 0.180 0.012 0.034 0.794 0.046
Has a role of facilitator 0.244 0.116 0.666 0.010 0.131 0.008 0.396 0.216 0.003
Has a role of demonstrator 0.038 0.031 0.118 0.022 0.214 0.005 0.836 0.070 0.005
Extraction Method: Principal Component Analysis. Rotation Method: Varimax with Kaiser Normalization.
A Rotation converged in 12 iterations.
Has a role of facilitator 0.244 0.116 0.666 0.010 0.131 0.008 0.396 0.216 0.003
Has a role of demonstrator 0.038 0.031 0.118 0.022 0.214 0.005 0.836 0.070 0.005
Extraction Method: Principal Component Analysis Rotation Method: Varimax with Kaiser Normalization. Rotation converged in 12 iterations.
5. Discussion
Nine factors have been extracted. However, it is clear that significant factor loadings can be seen only in 6 factors thus the nine factors are further reduced to only six, which are representing the critical factors of learning effectiveness from the students’ perspective (Table 5). The factors are discussed below:
Factor 1: Style of Managing Class
It is the most vital factor which explains 23.961 percent of the variation and this factor has six significant variables such as: Uses good examples (.644), Is organized (.760), Is concerned about students (.699), Demonstrates importance & significance of subject matter (.478), Involves students in hands-on projects (.597), Encourages student/faculty interaction outside of class time (.581). These variables with positive correlations emerge as important factors of style of managing class influencing the learning effectiveness.
Factor 2: Evaluation of Student Performance
There are four loads to this factor of instructor characteristics. The variables that fall under this factor are: Gives rapid feedback on test/assignment (.676), Has a sense of humour (.683), Is an easy grader (.706), Is flexible with students (.495). This factor is extracted as the second most important factor which accounts for 8.752 percent variation.
Factor 3: Facilitation
This factor has three significant variables which have 6.295 percent of the total variation. The variables are: Stays
current in his/her field (.690), Inspires & motivates students to set & achieve goals which really challenged them (.442), Has a role of facilitator (.666).
Factor 4: Teaching Style
This factor also has three significant variables which account for 5.559 percent of variation and the variables are: Uses visual aids such as power point (.794), Assigns group projects (.561), Has a professional appearance (.463).
Factor 5: Communication Skills: Verbal & Nonverbal
This is the next important factor, which influences the student perception of instructor characteristics in effective learning. This factor has four factor loadings, namely: Demonstrates good subject knowledge (.394), Uses students' names (.490), Is able to command class attention without shouting (.721), Makes eye contact with students during class (.727). This factor accounts for .521 percent of total variance.
Factor 6: Attitude
There are two factor loads in this factor which have 5.853 percent of the variation .These variables are: Is courteous (.671), Is approachable (.739). This shows that attitude plays a significant role in determining effective learning.
6. Conclusion
it is evident that students do get affected favorably or adversely due to the personality traits of the instructors. In this era of raised self-esteem, students perceive those instructors better who consider the students as grown up individuals with their independent identity, who give them personalized attention, who believe in facilitating the transfer of information and knowledge rather than just imparting the same, who manage the class professionally, who are clear in thought process and communicate efficiently, who are approachable, who are updated in their field, who understand the importance of working in teams.
Thus this research evaluated the effect of instructor characteristics on effective learning by using Factor Analysis. On the basis of the statistical analysis, it was concluded that the critical factors which affect effective learning are: excellent communication skills, attitude, interactive teaching style, a real-world focus, empathy for others, and both organization as well as presentation skills.
This study carries a great potential to update research in related areas. These results may be useful to researchers exploring the gap between students’ and faculty perceptions of effective teaching; how students’ perceptions of effective teaching have changes with time. This work will be the beginning of a more wide-ranging research agenda in the area of effective teaching at the undergraduate and postgraduate levels.
7. Managerial Implications
Our findings have several important implications for the management institutes. Based on these findings, the management institutes/business schools can design Faculty Development Programs, workshops and other training schedules with a special emphasis on the enhancement of these skills which go a long way in determining the success or otherwise of the instructors.
8. Limitations and Future Research
Since this study is exploratory in nature, it has some limitations that should be acknowledged. First of all, the comparatively small sample size should be made a note of. Future research might comprise the study of student perception of instructor characteristics in private and public business schools in India and also include a considerably larger number of respondents. It might also be conducted in engineering and medical colleges as well as institutions and universities offering other professional courses.A follow-up study may be designed in order to gain insight into perceptions of students some years after their formal education. In addition, an ensuing study might entail respondents from a larger number of countries having different cultural uniqueness to find out their perceptions toward various instructor characteristics.
There is a need to conduct further researches in different
cultures, locations and setups for a further validation and empirical realization of the findings of the present study. A comparative study of students enrolled in different professional courses can be carried out to ascertain the commonalities’ and differences in students’ perception across various courses.
A study can be carried out to find out whether demographic variables like age, gender, culture etc. have any impact on student perception. A study can be carried out to find out whether mode of learning/preferred learning style influences student perception.
REFERENCES
[1] Ahmadi, M., Helms, M., & Raiszadeh, F. (2001). Business students’ perceptions of faculty evaluations. The International Journal of Educational Management, 15, 12-22.
[2] Axelrod, P. (2008). Student perspectives on good teaching: What history reveals. Academic Matters: The Journal of Higher Education, February 2008, 24-27. Retrieved October 30, 2013, fromhttp://www.ocufa.on.ca/AM_Feb08/FEB08-P 24.pdf
[3] Badri, M., Abdulla, M., Kamali, M., & Dodeen, H. (2006). Identifying potential biasing variables in student evaluation of teaching in a newly accredited business program in the UAE.
International Journal of Educational Management, 20, 43-59.
[4] Best, J., & Addison, W. (2000). A preliminary study of perceived warmth of professor and student evaluations.
Teaching of Psychology, 27, 60-62.
[5] Bousfield, W. (1940). Students’ rating of qualities considered desirable in college professors. School and Society, 51, 253-256.
[6] Costin, F., Greenough, W., & Menges, R. (1971). Student ratings of college teaching: reliability, validity, and usefulness. Review of Educational Research, 41, 511-535. [7] Doyle, W. (1977). Paradigms for research on teacher
effectiveness. Review of Research in Education, 5, 163-198. [8] Duncan, H., & Leach, W. (1934). Student-teacher
relationships. Sociology and Social Research, 18, 535-540. [9] Faranda, W., & Clarke, I. (2004). Student observations of
outstanding teaching: implications for marketing educators.
Journal of Marketing Education, 26, 271-281.
[10] Fassinger, P. (2000). How classes influence students’ participation in college classrooms. Journal of Classroom Interaction, 35, 38-47.
[11] Greenwald, A., & Gillmore, G. (1979). No pain, no gain? the importance of measuring course workload in student ratings of instruction. Journal of Educational Psychology, 89, 743-751.
[13] Kilcoyne, F. (1949). He sure knows his stuff, but he’s a lousy teacher. School and Society, 69, 437-438.
[14] Malhotra, N K (2005). Marketing Research: an applied Orientation, Pearson Education. (India Branch), New Delhi. [15] Moorman J. (2004). Traits of Effective Professors. The
International Academy of Business and Public Administration Conference Proceedings. Tunica, Mississippi, May 2004.
[16] Nargundkar, Rajendra (2002). Marketing Research: Text and Cases, Tata McGraw Hill, New Delhi.
[17] Norman, D. (2005). Emotional design: Why we love (hate) everyday things. Toronto: Basic Books.
[18] Quick, A., & Wolfe, A. (1965). The ideal professor.
Improving College and University Teaching, 13, 133-134.
[19] Sherman, Barbara R., & Blackburn, Robert T. (1975). Personal characteristics and teaching effectiveness of college faculty. Journal of Educational Psychology, 67, 124-131. [20] Sojka, J., Gupta, A., & Detter-Schmelz, D. (2002). Student
and faculty perceptions of student evaluations of teaching.
College Teaching, 50, 44-49.
[21] Tang, T. (1997). Teaching effectiveness at a public institution of higher education: factors related to the overall teaching effectiveness. Public Personnel Management, 26, 379-387. [22] Tuckman, B. (1995). Assessing effective teaching. Peabody
Journal of Education, 70, 127-138.