Effect of Phase Composition on the Anodic Dissolution
and Passivation of Zinc-based Alloys
Viktor I. Korobov , Lina V. Petrenko
*, Veronika V. Poltavets
Department of Chemistry, Oles Honchar Dnipropetrovsk National University, 49010 Dnipropetrovsk, Ukraine *Corresponding Author: [email protected]
Copyright © 2014 Horizon Research Publishing All rights reserved.
Abstract
The influence of phase composition on the anodic behavior of electrolytic zinc-based alloys in alkaline solutions was investigated. The following materials were studied: Zn-Sn alloys consisting solely of Zn and Sn crystallites in a mechanical mixture, Zn-Fe, Zn-Co, and Zn-Ni alloys consisting of both solid solutions and intermetallic compounds. The anodic behavior of low-alloy solid solutions is similar to that of pure Zn. Solid-solution alloys consisting of an η-phase had a distinctive feature: the descent of the anode current prior to the complete passivation takes place at more positive potentials compared to pure zinc and its mechanical mixtures. The same sequence of anodic dissolution and passivation of zinc alloys as for the pure zinc anode polarization were observed during anodic polarization of both solid solutions and intermetallic phases of zinc alloys. Alloying led to a change in the thermodynamic and kinetic characteristics of anodic processes. Typical peaks of anodic behavior of Zn and Sn were observed on the voltammetrycurves of a broad range of heterogeneous Zn-Sn alloys. Peak currents depended on the alloy composition. The dependence between the alloy phase composition and the corresponding electrochemical behavior can be used in determination of the phase composition.Keywords
Electrolytic Zinc Alloys, Phase Composition, Anodic Behavior, Alkaline Solutions1. Introduction
Electrolytic zinc alloy coatings attract significant interest due to their improved anti-corrosion properties compared to pure zinc [1-5]. Zn-Fe and Zn-Ni alloys found many industrial applications [6], while Zn-Co coatings are less common. Zn-Mn and Sn-Zn alloys are used for special purposes. Most of electrolytic zinc-based alloys, with an exception of the Zn-Sn ones, contain up to 20% of the secondary component.
The properties of electroplated alloys are determined by their structure. The latter in turn depends on the alloy composition, working electrolytes, the nature of the plating
substrate and the deposition conditions. The phase structure of an alloy is the major factor determining its corrosion resistance.
Unusual features of electrocrystallisation can be exemplified by the differences between the composition of electroplated and metallurgical alloys. For example, there is ample literature evidence that electroplating of zinc with metals from the iron subgroup leads to solid solutions supersaturated in Fe, Ni or Co [7-11]. In such solutions, the content of Fe, Ni or Co can reach 20 at.% [7], while the corresponding thermodynamic solubilities are below 0.03% [12-14].
Intermetallic compounds in electroplated alloys can be either unsaturated and supersaturated. It was found that the Zn-Ni system consisted exclusively of the γ-phase when nickel content was below 45% [15], and of γ-Ni-Zn/α-Ni-Zn/Ni mixtures below 69% of nickel [16]. This greatly exceeds the normal boundaries of the phase diagram (26% and 48%, respectively [13]).
There is very scarce literature on anodic dissolution and passivation of alloys within reasonably large ranges of phase composition and electrode potentials. Therefore, it would be of great interest to investigate anodic behavior of zinc alloys as function of phase composition. This work presents the results obtained for: (a) galvanic Zn-Sn alloys consisting solely of Zn and Sn crystallites, and (b) Zn-Fe, Zn-Co, and Zn-Ni alloys that could include solid solutions and intermetallic compounds.
Anodic dissolution and passivation of the zinc alloys was performed in alkaline media. Such conditions are considered more convenient for study of passive behavior of metals [17] because there is no spontaneous passivation in open circuit (zinc oxide is thermodynamically unstable in strongly alkaline solutions). At the same time, the passive state can be easily established by applying anodic polarization or anodic current.
2. Materials and Methods
Zn: ZnO 10-20 gl-1; NaOH 100 gl-1; TAS (tetraalkylam monium salt of the polymer: poly(N,N-dimethyl-3-methylen e-5-pyridine sulfonyl chloride)) 2 mll-1. ik=5 Adm-2.
Zn-Fe: ZnO 20-30 g l-1; NaOH 100-200 gl-1; Fe2(SO4)3× 9H2O 0.8-30 gl-1; triethanolamine ((HOCH2CH2)3N) 30 mll-1; TAS 2-2.5 mll-1. ik=4 Adm-2.
Zn-Co: ZnO 10 gl-1; NaOH 100 gl-1; CoCl2×6H2O 8 gl-1; (HOCH2CH2)3N 10 ml l-1; aminoacetic acid (CH2NH2COOH) 0-10 gl-1; TAS 2 mll-1. ik=5 Adm-2.
Zn-Ni: ZnO 5 g l-1; NaOH 50 gl-1; NiCl2×6H2O 5-50 gl-1; polyethylenepolyamine 0-10 mll-1; trilon B 10-70 gl-1; TAS 2 mll-1. ik=4 and 5 Adm-2.
Zn-Sn: SnSO4 0,2-40 gl-1; ZnSO4×7H2O 10-30 gl-1; citric acid (С3Н4ОН(СООН)3) 100 gl-1; (NH4)2SO4 0-50 gl-1; CH2NH2COOH 0-40 gl-1; gelatin 1–6 g l-1. ik=0.5-5 Adm-2.
Electrolytes for electrodeposition of Zn-Fe, Zn-Co and Zn-Ni alloys were developed by the authors. Zn-Sn alloys were electrodeposited from electrolytes described in [18].
The iron content in the Zn-Fe alloys was determined by photoelectric colorimetry using thiocyanate in acidic medium [19]. The cobalt content in the Zn-Co alloys was determined using X-ray fluorescence (XRF) on Spektroskan MAKS-GV. The nickel content in the Zn-Ni alloys was determined by photoelectric colorimetry with dimethylglyoxime in alkaline medium in the presence of an oxidant, (NH4)2S2O8 [19]. The metal content in the Zn-Sn alloys was determined by complexometric titration [20]. The values are reported at atomic percentages.
The phase composition of alloy was studied by X-ray diffraction (XRD) using DRON-2 diffractometer under graphite monochromatized CuKα irradiation. The analysis was performed on thin films electrodeposited onto copper support or passivated brass. The support reflections of the passivated brass were excluded. Phases were identified using JCPDS database.
Polarization was measured using a three-electrode cell in solutions of sodium hydroxide prepared from analytically pure NaOH and bidistilled water. The auxiliary electrode was a low-carbon steel plate (mark 3). The reference electrode was a saturated silver chloride electrode with a Luggin capillary. The values are reported relative to the standard hydrogen electrode.
Zinc and its alloys were deposited onto a copper electrode (working area 0.28 cm2) as films at least 10 μm thick. Prior to voltammetry, the freshly deposited coatings were cleaned with fine abrasive paper, polished with filter paper, degreased with Vienna lime, and rinsed with bidistilled
water.
Potential sweep rate was 2 mVs-1. The measurements were performed at 20 °C using PI-50-1 potentiostat, PR-8 programmator, and N-307/1 potentiometer.
3. Results and Discussion
3.1. Anodic Behavior of Solid Solutions
A solid solution is a crystalline formation that consists of different atom types arranged in a shared crystal lattice [21]. The crystal lattice of solid solution is similar to that of the base metal (the "solvent"). At the same time, the lattice contains defects, the extent of which increases proportionally to the concentration of the dissolved metal. The properties of solid solutions differ from the properties of the corresponding base metals in proportion to the atomic fraction of the solute. According to literature [7-10], electroplated zinc alloys containing small amounts of Fe, Ni or Co generally consist of a zinc-based solid solution phase (η-phase).
We studied the following electrolytic Zn alloys: Zn-0.27 at.% Fe, Zn-(≤0.26 at.%) Co, and Zn-(≤1.0 at.%) Ni.
XRD diffractograms for the coatings of pure zinc and its low-alloys are shown in Fig. 1. The diffractogram of the zinc coating contains almost all of the characteristic zinc lines within the observed angle range. The XRD patterns of the alloys are similar and contain the same peaks. The observed differences in reflex intensities are caused by the differences in the crystallographic textures of the corresponding coatings [22].
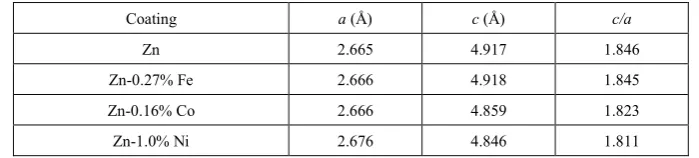
Crystal lattice parameters of substitutional solid solutions are different from those for pure zinc. For example, it is known [7,8,10,11] that the formation of zinc η-phase with iron subgroup metals leads to the increase in a and decrease in c values of the original hexagonal lattice. The c/a ratio is decreasing and approaches that of densely packed hexagonal lattice (c/a=1.633). This can be explained by the smaller size of Fe, Co, and Ni atoms compared to Zn.
[image:2.595.129.479.685.764.2]Similar trends were observed for the Zn-0.16% Co and Zn-1.0% Ni alloys (Table 1). The data implied that these alloys were substitutional solid solutions − an η-phase. At the same time, the crystal lattice parameter set for the Zn-0.27% Fe alloy is almost indistinguishable from that of pure zinc. It precludes the possibility of solid solution formation. Most likely, the Zn-0.27% Fe alloy consists of a pure zinc phase and one or more iron-containing phases.
Table 1. Crystal lattice parameters of zinc coatings, as determined by X-ray diffraction on the electrodeposited samples
Coating а (Å) с (Å) с/а
Zn 2.665 4.917 1.846
Zn-0.27% Fe 2.666 4.918 1.845
Zn-0.16% Со 2.666 4.859 1.823
Figure 1. The XRD patterns of electrodeposited coatings: (a) Zn; (b) Zn-0.27% Fe; (c) Zn-0.16% Co; (d) Zn-1.0% Ni
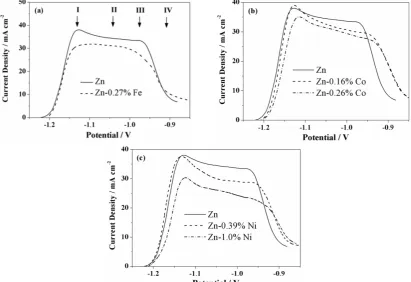
Given the similarities in chemical composition and crystal structure of low alloys (which consist of substitutional solid solutions) and the corresponding base metal, one could expect equally similar electrochemical behavior. Fig. 2 shows polarization curves of low alloys and pure zinc measured in 1.0 M NaOH solutions. There were no significant changes of the voltammetry curve shapes when the zinc matrix was doped with up to 1 at.% of supplements.
[image:3.595.100.512.465.747.2]
Table 2. Reactions occurring during anodic polarization of zinc in alkaline solutions [23]
I
Zn + OH- ⇄ ZnOH + e- (1)
ZnOH + 2OH- → Zn(OH)
3- + e- rds (2)
ZnOH + OH- ⇄ Zn(OH)
2 + e- (3)
Zn(OH)2 + OH- → Zn(OH)3- rds (4)
Zn(OH)3- + OH- ⇄ Zn(OH)42- (5)
II
ZnOH + OH- ⇄ Zn(OH)
2 + e- (3)
Zn(OH)2 + OH- → Zn(OH)3- rds (4)
Zn(OH)3- + OH- ⇄ Zn(OH)42- (5)
III
Zn(OH)2 + OH- → Zn(OH)3- rds (4)
Zn(OH)3- + OH- ⇄ Zn(OH)42- (5)
Zn(OH)2 + Zn + 2OH- → Zn(OH)3- + ZnOH + e- rds (6)
IV Zn(OH) Passivation of zinc
2 + Zn + 2OH- ⇄ 2ZnO + 2H2O + 2e- (7)
The anodic i,E-curves contained four characteristic points (Fig. 2). Table 2 lists the reactions of anodic dissolution and passivation of zinc, which most likely occur at potentials of each point.
Under certain conditions, the anodic polarization of the Zn(Fe, Co, Ni) alloys is known to lead to the anodic dissolution and passivation of the doping supplements. The standard potentials in alkaline media are known [24]:
Zn + 2OH-⇄ Zn(OH)2 + 2e-, –1.222 V; Fe + 2OH-⇄ Fe(OH)2 + 2e-, –0.89 V; Co + 2OH-⇄ Co(OH)2 + 2e-, –0.722 V; Ni + 2OH-⇄ Ni(OH)2 + 2e-, –0.688 V.
We subjected several electrolytic alloys, Zn-(0.27−9.4)% Fe, to the potentials ranging from the open circuit potential up to −0.5 V, until the anode current reached zero. After that, we determined the iron and zinc concentrations in the resulting coatings. It was found that the iron content remained unchanged irrespectively of the exposure potential, while the amount of zinc was reduced by 60−90%. Thus, anodic polarization within the applied range led exclusively to zinc dissolution. However, it is also possible that passive films were formed containing oxygenated compounds of Fe, Co, or Ni.
Polarization curves for the alloys, consisting of solid solutions Zn-Co and Zn-Ni, and those for pure zinc differ by: (a) slightly increased open circuit potentials, (b) decreased anodic currents, and (c) slightly increased potentials at which the current drops prior to the complete passivation.
The increase of the open circuit potential associated with the doping can be explained in thermodynamic terms: the formation of solid solutions and intermetallic compounds leads to a decrease in the partial Gibbs energies of the alloy components. For an ideal alloy, this decrease depends on the electrochemical work as follows [25]:
( )
j j jj
RT
N
n
F
G
=
ln
=
−
∆
, (7) where Nj is the atomic fraction of the j-th component of the alloy, ∆j=Ealloy,j–Ej is the difference between the equilibriumpotential of the j-th component within the alloy and the corresponding potential of the pure j-th component.
Rearrangement of eq. (7) gives:
( )
jln
N
F
n
RT
j j
=
−
∆
. (8)Since Nj<1, then ∆j>0. In other words, the partial
potentials of the alloy components are always more positive than the corresponding values for the free metals. This means that metals in alloys will undergo oxidation at more positive potentials. It also follows from (8) that the changes in the partial potentials depend on the component concentration.
The difference between the complete passivation potentials of the η-phase and of pure zinc coating is even larger than the difference between the corresponding open circuit potentials (Fig. 2). This can be explained by the fact that anodic polarization of alloys is accompanied by predominant dissolution of the more electronegative component, which in turn leads the constantly changing composition of the surface layer (the latter depends on the electrode potential). In other words, an increase in the electrode potential leads to an increase in the atomic fraction of zinc in the surface layer; this leads to an increase in ∆Zn and, thus, to a shift in the partial potential of zinc toward more positive values.
confirmed by the fact that the Zn-0.27% Fe alloy, which is heterogeneous and consists mainly of pure zinc phase, did not have the widening of the anodic peak. In summary, solid alloys are characterized by the smoothening of the current-voltage peaks compared to the base metal.
The decrease of current density during anodic dissolution of zinc, which leads to the formation of solid solutions, is not proportional to the atomic fraction of the doping additives in the alloy. Usually, the anodic current is decreased to a greater extent. This is because the formation of substituional solid solutions from Zn-Fe, Zn-Co, and Zn-Ni alloys leads to more densely packed crystal lattices, which in turn inhibits anodic dissolution of zinc.
Interestingly, the overall shape of anodic polarization curves for zinc-based solid solutions did not depend neither on the nature and content of the auxiliary metal, nor on the structural characteristics (other than the phase composition) of the coatings. These parameters influenced only anode current densities and characteristic point potentials of the
i,E-curves.
3.2. Anodic Behavior of Intermetallic Phases
The intermetallic compound usually has a crystal structure which differs from that of the pure components. For example, the majority of the of intermetallic phases most commonly prepared by electrodeposition of zinc alloys (Г1-Zn-Fe,
Г-Zn-Fe, γ1-Zn-Co, γ-Zn-Co, γ-Zn-Ni) are characterized by cubic crystal lattice, while zinc itself has a densely packed hexagonal lattice.
The decrease in partial Gibbs energies during the formation of intermetallic compounds (and thus the increase in zinc partial potential) is greater than during the formation of solid solutions. This should lead to a significant shift of the anodic voltammetry curves toward more positive potentials. Since both chemical and structural properties of intermetallic compounds differ from that of the base metal, their electrochemical behavior will also differ. This will lead to a change of the i,E-curve shape and its characteristic
points.
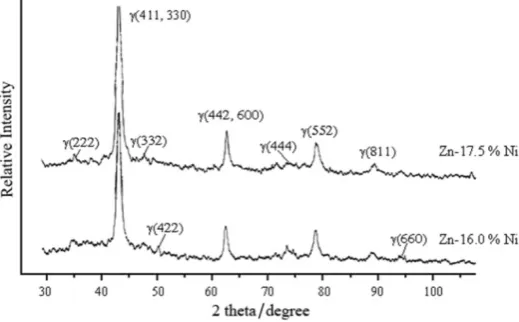
Let us discuss the anodic behavior of intermetallic phases using Zn-16.0% Ni and Zn-17.5% Ni as examples. Both these alloys consisted only of γ-phase (Ni5Zn21 or NiZn3) according to XRD analysis (Fig. 3). Also, the zinc phase diagram [13] indicates the existence of γ-phase between 15 and 25% Ni, and both of the alloys are within this range.
The i,E-curves of the intermetallic phase contain four characteristic points, similar to those of pure zinc (Fig. 4). Thus, anodic polarization of the zinc-based intermetallic phases is accompanied by the processes similar to those in zinc itself. However, the curves of the intermetallic-containg alloys are broadened, which is explained by the same factors as with solid solutions. The γ-phase is an electron compound with a rather wide homogeneity range.
Interestingly, the i,E-curve of the Zn-16.0% Ni coating (Fig. 4) spanned over the potentials typical of those for pure zinc. This may mean that this electrolytic alloy also contains a small amount of zinc phase which was not detected by XRD analysis.
Overall, the anodic i,E-curves of zinc intermetallics are shifted significantly toward the more positive potentials compared to pure zinc. The maximal currents observed during anodic polarization of intermetallics are much smaller.
3.3. Anodic Behavior of Heterogeneous Alloys
Heterogeneous alloys consist of several phases with different chemical composition and crystallographic parameters. Furthermore, these phases differ by many physical and physicochemical characteristics: adsorption, structure of the electrical double layer, kinetic parameters of redox reactions, passivation potentials etc. [25].
[image:5.595.175.435.559.720.2]We studied the behavior of eutectic alloys in a Zn-Sn system. Galvanic alloys Zn-Sn, similarly to metallurgical ones, are heterogeneous mixtures of Zn and Sn crystallites irrespectively of the component ratios and deposition conditions [5,26,27].
Figure 4. Polarization curves of electrodeposits of Zn and its alloys in 1.0 M NaOH
The influence of small amounts of Sn on the anodic behavior of zinc coatings is shown on Fig. 5. The polarization curves recorded in 0.5 M NaOH remained essentially unchanged after doping the zinc matrix with ≤4% of tin. Some change in contributions of the partial stages (Table 2) toward the total process of anodic dissolution and passivation of zinc was observed. Thus, stage 6 was less important in case of the alloy than for pure zinc. Also, a slight decrease of the complete passivation potential and an increase of the passivation current density were observed.
[image:6.595.81.528.384.547.2]
Figure 5. Polarization curves for zinc, tin, and Zn-Sn alloys in 0.5 M (a) and 1.0 M (b) NaOH
[image:6.595.79.527.576.740.2]
Table 3. Phase composition of the Zn-Fe alloys (based on XRD patterns) and zinc lattice parameters
Fe, at.% Phase composition а (Å) с (Å) с/а
0.27 Zn + (phase containing Fe) 2.666 4.918 1.845 0.88 Zn + (FeZn7 + Fe3Zn10) 2.679 4.829 1.803
3.5 hcp (Zn-Fe) + (Zn + FeZn7 + Fe3Zn10) 2.711 4.656 1.717
8.4 hcp (Zn-Fe) + (Zn + FeZn7+Fe3Zn10) 2.717 4.530 1.667
9.4 hcp (Zn-Fe) + (Zn + FeZn7+Fe3Zn10) 2.724 4.516 1.658
The i,E-curves recorded in 1.0 M NaOH solutions show more pronounced changes in the anodic behavior of alloys compared to zinc (Fig. 5b). Complete passivation of alloys occured at more positive potentials and the complete passivation currents were much higher than for pure zinc. This is likely caused by anodic dissolution of Sn occurring simultaneously with that of Zn, while the amount of Sn in alloys not being high enough for the appearance a separate peak at the i,E-curves. The fact that anodic dissolution of Sn in the alloy occured at more negative potentials compared to the pure metal can be explained by the selective dissolution of zinc and concomitant enrichment of the surface with tin and non-equilibrium vacancies [25].
The change in the i,E-curve shapes for zinc in alkaline media associated with the formation of a heterogeneous system Zn-Sn is broadly similar to the consequences of doping the zinc matrix with 0.27% Fe (Fig. 2a). This can be another proof that the Zn-0.27% Fe alloy is a mechanical mixture of pure zinc crystallites and an iron-containing phase.
Fig. 6 shows the anodic polarization curves for zinc alloys with Sn content ranging from 21% to 86%. The increase in the Sn content initially led to an increase in the current (associated with anodic processes of zinc) and then to a decrease. The current maximums that correspond to anodic processes in Sn gradually increased as the tin content increased. Open circuit potentials of Zn-Sn coating across the entire range of concentrations are almost equal to the open circuit potential of zinc, which was the more electronegative alloy component.
Passivation of Sn in alloys containing over 70% of zinc occurred at more negative potentials than passivation of pure Sn. This is explained by the formation of a nonequilibrium surface layer enriched in Sn and structural defects as a result of selective dissolution of zinc. This leads to higher thermodynamic activity of Sn atoms and its easier passivation. The dissolution of Sn is additionally inhibited by an inert film of oxygenated zinc compounds.
Thus, for heterogeneous systems, a small amount of an additional phase in zinc-based alloys resulted in a decrease of the current originating from stage 6 (Table 2). The complete passivation potential may be more positive than the potential of complete passivation of zinc, which is due to the presence of the additional phase. When the amount of this phase increased, extra peaks could be detected in voltammetry diagrams, which corresponded to the additional anodic processes.
3.3. The Relationship of the Electrochemical Behavior and Phase Ccomposition of Alloys
[image:7.595.321.537.330.636.2]There appears to be a certain well-defined correlation between phase composition of alloys and their electrochemical behavior. Thus, the knowledge of the latter could be used in determination of the phase composition. However, one should remember that electrochemical measurements are associated with a number of side-effects which result in a complex functional dependence between the alloy composition and its properties.
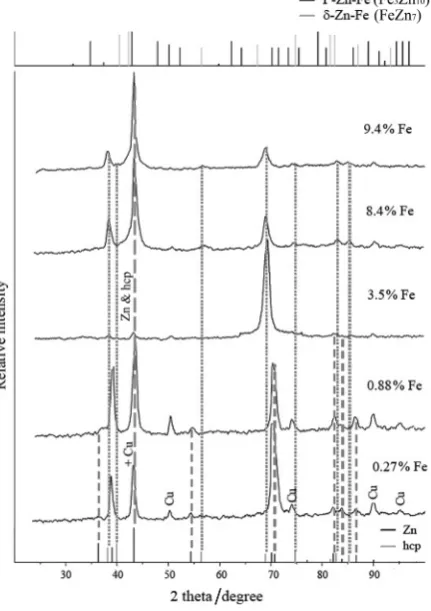
Figure 7. XRD patterns of Zn-Fe alloys
The formation of substitutional solid solutions resulted in a considerable shift of the XRD lines of zinc (Fig. 7) as well as in significantly altered zinc lattice parameters (Tables 1 and 3; hcp (Zn-Fe) denotes a solid solution phase). The theoretical XRD diagram of the hcp (Zn-Fe) phase (Fig. 7) was calculated using the values of a and c obtained for the Zn-9.4% Fe alloy (Table 3).
[image:8.595.61.294.314.488.2]Anodic polarization curves for zinc and Zn-Fe alloys are shown in Fig. 8. As noted earlier, the Zn-0.27% Fe alloy, based on its structural characteristics and electrochemical behavior, must consist of a heterogeneous mixture of pure zinc phase and minute amount of iron-containing phase(s). Current density maxima, denoted as B (Fig. 8), are explained by the presence of the hcp (Zn-Fe) phase. The curves for the Zn-0.88% Fe and Zn-3.5% Fe alloys contained peak "shoulders", C, which could originate from the anodic activity of more iron-rich phases, such as FeZn7 and Fe3Zn10. The latter, however, is debatable since the XRD analysis failed to detect FeZn7 or Fe3Zn10.
Figure 8. Polarization curves for pure zinc and the Zn-Fe alloys in 1.0 M NaOH
XRD phase identification analysis and anodic voltammetry of the Zn-Fe alloys in alkaline media allowed to identify the following phases (Table 4):
Table 4. Phase composition of the Zn-Fe alloys as determined by XRD analysis and voltammetry in alkaline media
Fe, at.% Phase composition
0.27 Zn + (phase containing Fe)↓*
0.88 Zn+ hcp (Zn-Fe)↓ + FeZn7↓+Fe3Zn10↓
3.5 Zn+ hcp (Zn-Fe)+FeZn7↓+Fe3Zn10↓
8.4 Zn↓+ hcp (Zn-Fe)
9.4 Zn↓+ hcp (Zn-Fe)
*↓ – very small content.
Interestingly, the anodic behavior of the hcp (Zn-Fe) phase (Fig. 8, curves 5 and 6), which is a zinc-based substitutional solid solution, resembled more that of an intermetallic compound. This could explained as follows.
Solid solutions (electron phase) of hexagonal symmetry can form several phases depending on the number of valence electrons per atom (е/а) [28]:
η-phase – limited solid solution. e/a 1.93-2.00; c/a
1.7-1.85;
ε-phase. e/a 1.65-1.89; c/a~1.58; ζ-phase. e/a 1.32-1.83; c/a~1.63.
The values e/a and c/a may vary for different systems. Thus, the axes of the hexagonal lattice of such alloys depend on the electronic structure, atom size and their electronegativity.
Electron concentration ranges for the Zn-Fe alloys depended on the iron content as follows:
≤3.5% – е/а 2.0-1.93; (3.5–9.4)% – е/а 1.93-1.82.
Here we assumed the valency of Zn to be 2, the valency of Fe – 0 [28]. Based on the e/a and c/a values, it can be concluded that alloys with iron content below 3.5% form an η-phase, while those with over 3.5% Fe can form an ε-phase. It should be noted that, at the thermodynamic equilibrium, Zn-Fe alloys form δ-phase (FeZn7 or FeZn10) with a homogeneity range (87−92) at.% Zn and electron concentration 1.74−1.84. This δ-phase has a complex hexagonal overstructure (a=12.787 Å; с=57.222 Å;
c/a=4.475), which contains 52 iron and 504 zinc atoms per unit cell and consists of very densely-packed icosahedrons and some other polyhedrons [29].
It can be assumed that the solid solution phase, which we labeled as ε-phase, was in fact a disordered δ-phase of Zn-Fe alloy. A disordered solid solution has a statistically uniform distribution of atoms at the atomic positions. An ordered alloy has a more regular (repeating) atom order where crystal lattice sites are occupied by the atoms of a particular kind. Disordered solid solutions can transform into ordered ones under certain specific conditions (low temperatures). There exist a number of alloys with ordered structure (or overstructure), for which no unordered modification has been detected.
The existence of two different phases in zinc-based alloys is described in literature [9]. It has been shown that electrolytic alloys Zn-(4-8)% Fe contains simultaneously two solid solution phases with the c/a values of 1.73 and 1.61, respectively.
4. Conclusions
We have studied the relationship between the anodic behavior of several zinc-based alloys in alkaline media and their phase composition. It was found that:
1. The anodic behavior of low-alloyed solid solutions of zinc resembled that of pure zinc metal due to the similarities in the chemical composition and crystal structure. The formation of Zn η-phase led to a shift of both the open circuit potentials and the complete passivation potentials toward more positive values, as well as to lowering of the maximal currents. The increase of the electrode potentials could be explained by the decreased partial Gibbs free energies of the alloy components due to the formation of solid solutions or intermetallics. The decrease in current density for dissolution of zinc from solid solutions was the result of denser crystal lattice.
Low-alloys, which were substitutional solid-solutions, had another feature. The anode current drop prior to the complete passivation occured at more positive values of the electrode potentials compared to pure zinc and the alloys consisting of mechanical mixture of components.
2. The formation of intermetallic phases caused significant shift of the anodic i,E-curves toward more positive potentials compared to pure zinc. The peak values of the voltammetry curves for intermetallic compounds were significantly reduced compared to zinc as a result of the bond strengthening in the intermetallics.
3. The anodic polarization of solid solutions and intermetallic phases of zinc alloys proceeded via the same stages of Zn dissolution and passivation as for pure zinc. Alloying led to a change in the thermodynamic and kinetic parameters of the anodic processes.
4. The electrochemical behavior of heterogeneous alloys depended on their components. For a wide range of component concentrations, the i,E-curves of Zn-Sn alloys contained peaks that were characteristic of both Zn and Sn. The peak height depended on the concentration of the respective component.
The decrease of electrode potentials for Sn dissolution and passivation was observed in Zn-Sn alloys. This was explained by the selective dissolution of the more electronegative component and the resulting formation of the surface layer enriched in Sn, nonequilibrium vacancies, and structural defects. The thermodynamic activity of Sn atoms thus increased and this facilitated the anodic dissolution and passivation.
5. There was a certain correlation between the phase composition of the studied alloys and their electrochemical behavior in alkaline media. This correlation can be used in determination of the phase composition.
Acknowledgements
The work was supported by the Ministry of Education and Science of Ukraine (Grant No. 1-255-12). The authors would
like to thank Dr. Oleksandr Zhurakovskyi (Harvard University) for the help with manuscript preparation.
REFERENCES
[1] H. L. Hu, Y. M. Zhu, Z. M. Tu, W. J. Liu. High Anticorrosion Nano Zn-Fe Coatings by Pulse Electrodepositing, Advanced Materials Research, Vol.194-196, 2209-2215, 2011.
[2] N. Boshkov, N. Tsvetkova, P. Petrov, D. Koleva, K. Petrov, G. Avdeev, Ch. Tsvetanov, G. Raichevsky, R. Raicheff. Corrosion behavior and protective ability of Zn and Zn-Co electrodeposits with embedded polymeric nanoparticles, Applied Surface Science, Vol.254, 5618-5625, 2008.
[3] K. R. Baldwin, C. J. E Smith, M. J. Robinson. Cathodic Protection of Steel by Electrodeposited Zinc-Nickel Coatings, Corrosion, Vol.51, 932-940, 1995.
[4] W. Tian, F. Q. Xie, X. Q. Wu, Z. Z. Yang. Study on corrosion resistance of electroplating zinc-nickel alloy coatings, Surface and Interface Analysis, Vol.41, 251-254, 2009.
[5] O. A. Ashiru, J. Shirokoff. Electrodeposition and
characterization of tin-zinc alloy coatings, J Applied Surface Science, Vol.103, 159-169, 1996.
[6] F. Fontenay. Electrodeposited zinc and zinc alloy coatings and their corrosion resistance. Part 1, Galvanotechnik, Vol.93, 2534-2541, 2002.
[7] Y. Shima, S. Terasaka, K. Nakaoka, Т. Hara, T. Honma. Structures of Electrodeposited Fe-Zn, AlloysTetsu-to-Hagané, Vol.72, 954-960, 1986.
[8] Bruet-Hotellaz, J. P. Bonino, A. Rousset. Structure of zinc-nickel alloy electrodeposits, Journal of Materials Science, Vol.34, 881-886, 1999.
[9] T. Fujieda, A. Naganawa, M. Toyota, S. Higuchi, S.
Takahashi. Structure of Electrodeposited Zn-Fe Alloy in the Zinc Rich Region, ISIJ International, Vol.32, 1044-1046, 1992.
[10] E. Gómez, X. Alcobe, E. Vallés. Characterisation of zinc+cobalt alloy phases obtained by electrodeposition, Journal of Electroanalytical Chemistry, Vol.505, 54-61, 2001.
[11] K. Kondo. Morphology and Microstructure of
Electrodeposited Zinc-Nickel Binary Alloys, Tetsu-to-Hagané, Vol.77, 886-891, 1991.
[12] H. Okamoto. Co-Zn (Cobalt-Zinc), Journal of Phase
Equilibria and Diffusion, Vol.28, 315, 2007.
[13] H. Okamoto. Ni-Zn (nickel-zinc), Journal of Phase Equilibria, Vol.24, 280-281, 2003.
[14] H. Okamoto. Fe-Zn (Iron-Zinc), Journal of Phase Equilibria and Diffusion, Vol.28, 317-318, 2007.
[15] H. Park, J. A. Szpunar. The role of texture and morphology in optimizing the corrosion resistance of zinc-based electrogalvanized coatings, Corrosion Science, Vol.40, 525-545, 1998.
acetate-chloride electrolyte by using XRD and potentiodynanamic stripping, Electrochimica Acta, Vol.50, 1189-1196, 2005.
[17] C. van den Bos, H. C. Schnitger, X. Zhang, A. Hovestad, H.Terryn, J. H. W de Wit. Influence of alloying elements on the corrosion resistance of rolled zinc sheet, Corrosion Science, Vol.48, 1483-1499, 2006.
[18] Т. А. Vahramyan, B. Odeh Osama, E. V. Kharlamova. Electrodeposition of zinc-tin from citrate-glycine electrolyte, Russian Journal of Electrochemistry, Vol. 22, 998-1000, 1986.
[19] Z. Marchenko. Photometrical determination of elements (in russian), Mir, Moscow, 1971.
[20] G. Schwarzenbach, H. Flaschka. Die komplexometrische titration, Ferdinand Enke Verlag, Stuttgart, 1965.
[21] A. H. Cottrell. An Introduction to Metallurgy, Institute of Materials, 1995.
[22] C. Barret, T.B. Massalski. Structure of Metals, Petgamon, Oxford, 1980.
[23] G. Prentice, Y. C. Chang, X. Shan. A Model for the Passivation of the Zinc Electrode in Alkaline Electrolyte, Journal of The Electrochemical Society, Vol.138, 890-894,
1991.
[24] S. G. Bratsch. Standard Electrode Potentials and Temperature Coefficients in Water at 298.15 K, Journal of Physical and Chemical Reference Data, Vol.18, 1-21, 1989.
[25] I. K. Marshakov, A. V. Vvedenskii, V. Yu. Kondrashin, G. A. Bokov. Anodic dissolution and selective corrosion of alloys (in russian), Voronezh Univ, Voronezh, 1988.
[26] C. C. Hu, C. K. Wang, G. L. Lee. Composition control of tin– zinc deposits using experimental strategies, Electrochimica Acta, Vol.51, 3692-3698, 2006.
[27] C. C. Hu, C. K. Wang. Effects of composition and reflowing on the corrosion behavior of Sn–Zn deposits in brine media, Electrochimica Acta, Vol.51, 4125-4134, 2006.
[28] C. S. Barrett, T. B. Massalski. Structure of metals, Pergamon Press, Oxford, 1980.
![Table 2. Reactions occurring during anodic polarization of zinc in alkaline solutions [23]](https://thumb-us.123doks.com/thumbv2/123dok_us/8787913.907877/4.595.135.478.91.305/table-reactions-occurring-anodic-polarization-zinc-alkaline-solutions.webp)