329 Abstract - This research is about an economic dispatch study for
IEEE 14 bus distribution system. The aim of this project is to minimize the total cost of generation and to reduce the total losses at the bus. Besides that, this paper also presented the effect of the total system loss when embedded generation (EG) is penetrated. There are numerous methods that can be used to solve the economic dispatch but for this project, the λ (lambda) iteration method was chosen. This method is quite conventional but there are still some advantages that make this method very useful to the beginner. Furthermore, this method are easy to understand and it is simpler than any other methods. This paper also discussed about the economic dispatch of the interaction between embedded generation and the distribution network. The result of this research ensures that it will reduce the total cost and as well as the losses at the line or bus. From this research, expectantly the industries are able to save on resources and also can improve the profit on the investment beside helping the society and consumer with the total cost reduction.
Index Terms—Distribution, Economic dispatch, Embedded generation, iteration method.
I. INTRODUCTION
In this new era, the generation of power system is important. The factor influencing power generations at minimum cost are operating efficiency of generators, fuel costs and transmission losses. The most efficient generator in the system does not guarantee minimum cost as it may be located at the place where the fuel prices are high. When the plant is located far from the load center, transmission losses maybe considerable higher and hence the plant may be overly uneconomic. Hence, we can determine the generation of difference plants based on the total operating cost and the reliability. Therefore, the economic scheduling is important.
The power flow solution provides voltage phase angle and the reactive power generation. In a practical power system, the power plants are not located at the same distance from the center of the loads and the fuel costs are different from one place to another. Under normal operating conditions, the generation capacity is more than total load demand and losses [1]. So there is a lot of power that has been wasted under those conditions.
Electric utility investment operations have been designed to ensure affordable, reliable electricity
The authors are with the Department of Electrical Power Engineering, Faculty of Electrical & Electronic Engineering, Universiti Tun Hussein Onn Malaysia (UTHM), 86400 Parit Raja, Batu Pahat, Johor, Malaysia. (e-mails: [email protected] and [email protected] ).
service to consumers. Affordability and reliability require
thoughtful, long-term investments in generation and transmission [2]. Economic dispatch focuses on short-term operational decisions, specifically how to best use available resources to meet customers electricity needs such as reliability and lower cost. Economic dispatch is a straightforward concept whereby the costs to serve a level of electricity demand are minimized by dispatching lower-cost generation before dispatching higher cost generation. A number of considerations must be addressed to ensure that the resulting system operation is secure and reliable as well as achieving the lowest cost.
In the economic dispatch problem, the total loss and the loss coefficient are both the greatest concern. The total loss of the system will give a big effect to the economic dispatch. When the loss is high, the resultant cost increases and vice versa.
In this paper, the fast decoupled load flow is used to determine the total generation, total load, losses in each line and the total losses in the system. From the results of load flow, the data is then used to solve the economic dispatch problem by using the lambda iteration method. The total losses are then being compared with the losses when the embedded generation (EG) is used at different bus.
II. LITERATURE REVIEW A. Embedded Generation (EG)
Recently there has been a considerable revival in interest in connecting generation to the distribution network and this has come to be known as embedded generation. The term ‘embedded generation’ comes from the concept of generation embedded in distribution network [3]. Embedded generation is new way to save the cost of the generation cost and in the meanwhile reducing the total losses in distribution system. EG is very popular in Europe region where usually the renewable energy is used as the source of the generation such as wind, combine heat and power and solar. The total generation output of the EG is small and is below 20 MW and this generator is placed in the big building such as hospital, hotel, flat, shopping mall and others.
Normally, the role of the distribution system is mainly confined to the interconnection between generator and the transmission system on one side and load centers on the other side. EG have an impact on losses in a network. The strategic placement of EG on the network can reduce losses normally seen by the system while improper placement may
Economic Dispatch Studies for IEEE 14-Bus
Distribution
G. H. Hwang1, Member, IET & Member, IEEE, K. B. Ching2,Member, IEEE and M.Z. Samsuddin3 Department of Electrical Power Engineering, Faculty of Electrical and Electronic, University Tun Hussein Onn
Malaysia, 86400 Parit Raja, Batu Pahat, Johor, MALAYSIA. Tel: +607-4537544 Fax: +607-4536060
E-mail: [email protected], [email protected],[email protected]
The 5th Student Conference on Research and Development –SCO 11-12 December 2007, Malaysia
330 actually increase the network losses [4]. Placing of EGs to
minimize losses is like placing the capacitor banks for loss reduction. The only difference is that EG will impact both real and reactive power flow, whereas capacitors only impact the reactive power flow. A small penetration of a strategically placed EG with an output of just 10-20% of the feeder demand can have a significant loss reduction benefit for the system.
B. Relation Between Economic and the Embedded Generation
By generating power locally, embedded generation changes the flows and voltages in distribution system and affects the reliability profile of the network. Consequently, EG has an impact on the demand for distribution and transmission and the most important is it changes system operating costs and influences the value of the services delivered.
The principles of distribution system operation and development, in terms of the network operational practices such as protection, voltage control as well as system development and pricing policies are very much inherited from the period of passive distribution network and supply business. The restructuring of the industry and potential large scale penetration of embedded generation into these networks is now challenging the traditional views on the relationship between security economies of the supply. This indicated that there is a need, not only to reassess the suitability of the planning and pricing practices but also to investigate alternative approaches to these important issues.
[image:2.612.75.299.435.644.2]III. METHODOLOGY
Fig. 1 : IEEE 14 bus system
This project use IEEE 14-bus distribution. The data for the system must be matching the 14-bus diagram like the total generator and the load at each bus.
A. Fast Decoupled Load Flow
For this project, fast decoupled method is used to determine the load flow. Fast decoupled method is use for
this load flow because it works very fast compare to another type load flow like Gauss-Seidel and Newton Raphson. The advantages of this method very work when lot of buses is use in load flow like for 300-bus system. The time needed for every iteration is less compared to any other methods. To solve the fast decoupled power flow, the Jacobian matrix is present like:
(1) If the and independencies are applied, the sub matrices and become zero and the matrix become to:
(2)
or
(3)
The two equations above shows that the matrix equation is separated two decoupled equation requiring considerably less time to solve compared. Furthermore, considerable simplification can be made to eliminate the need for recomputing and during each iteration.
Finally, after the some assumption and algorithm the equation become
(4)
(5)
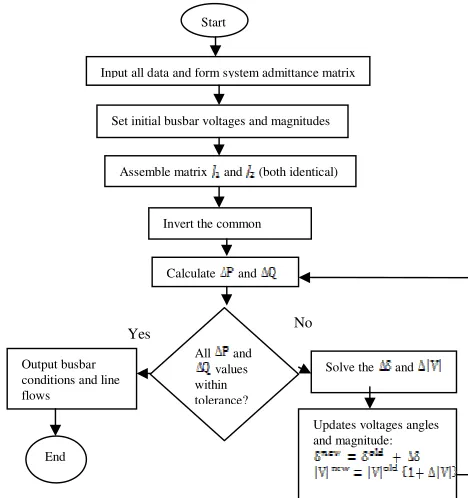
[image:2.612.306.540.462.711.2]where and are the imaginary part of the bus admittance matrix Ybus. The fast decoupled power flow solution requires more iterations than the Newton-Raphson method, but requires considerably less time per iteration, and a power flow solution is obtained very rapidly.
Fig 2: Flow chart for Fast Decoupled method
Yes No
Input all data and form system admittance matrix
Output busbar conditions and line flows
Set initial busbar voltages and magnitudes
Updates voltages angles and magnitude:
Solve the and Assemble matrix and (both identical)
Invert the common matrix
Calculate and Start
End
331 The load flow data from the load flow analysis is
extremely important to get the result of the economic dispatch. The net losses, total generation total load of the system will be used to get the economic dispatch. For the economic dispatch, the fuel cost and the limit for each generator are set. Those values are used to determine the total real power loss and the total generation cost of the system.
B. Economic Dispatch using λ iteration method
Generally, some formulas that related to find the Economic Dispatch are shown below:
(6)
where:
= Total cost of supplying the dedicated demand (US dollar per hour)
= Total cost for each unit (US dollar per hour) = Power generated for each unit (Megawatts)
The cost function is the form of:
(7)
where parameter , and of equation above is represent the unit cost coefficient.
The objective function is subjected to total power generated:
(8)
where = Total power generated (Megawatt) = Total load demand (Megawatt) = Total transmission loss (Megawatt)
Power generated for each unit are subjected to certain limit,
(9)
where; lower limit of power generated by each unit (MW)
Upper limit of power generated by each unit (MW)
The derivation for the economic dispatch including losses is shown by express the total transmission losses as a quadratic function of the generator power outputs. The simplest quadratic form is
(10)
A more general formula containing a linear term and a constant term, referred to as Kron’s loss formula, is
(11)
The coefficient is called coefficients or B-coefficients. B-coefficients are assumed as constant and there is various way of arriving at a loss equation.
The economic problem is to minimize the overall generating cost which is the function of plant output.
(12) Using the Langrange multiplier and adding additional terms to include the inequality constrains, we obtain
The constrains should be understood to mean the
=0 when < and that = 0 when > .
The minimum of this unconstrained function is found at the point where the partials of the function to its variables are zero.
0 = ∂
∂
i
P L
(14)
=0 ∂ ∂ λ L
(15)
First condition, given by (14)
(16) Since
(17)
Then
(18)
and therefore the condition for optimum economic dispatch is
λ =λ
∂ ∂ +
i L i
i
P P dP dC
, i=1,….ng (19)
The term is known as the incremental transmission loss. Second condition, given by (19) results in
∑
=
+ =
g
n
i
L D i P P
P 1
(20)
Equation (20) is precisely the equality constrain that was to be imposed.
Classically, equation (19) is arranged as
× =λ
∂ ∂
− i
i
i L dP
dC
P P 1
1
, i=1,….ng
(21)
or
=λ
i i i
dP dC
332 where is known as the penalty factor of plant i and is
given by i L i P P L ∂ ∂ − = 1 1 (23)
Hence, effect of the transmission loss is introduced a penalty factor with a value that depends on the location of the plant. Equation (21) shows that minimum cost is obtained when the incremental cost of each plant multiplied by its penalty factor is the same for all plants. The incremental production cost is given by
i i i
i i P dP dC β γ +
=2 (24)
and the incremental transmission loss is obtained from loss formula (12) which yields
j i
ij n
j i
L B P B
dP dP g 0 1 2 + =
∑
= (25)Substituting the expression for the incremental cost and the incremental transmission loss in (19) give
+ γ + λ
∑
+ λ=λ= i j ij n j i i
i P B P B
B
g
0 1
2
2 (26)
or
(1 )
2 1 ) ( 0 1 λ λ γ i i ij ij n j i ii
i B P B P B B
g − − = + +
∑
= (27)Extending (26) to all plants results in the matrix form or in short form
EP=D (28)
To find the optimal dispatch for an estimated value of
λ(1), the simultaneous linear equation given by (28) is solved.
Then the process is continued using the gradient method. To do this, from (27), Pi at the kth iteration is expressed as
) ( 2 2 ) 1 ( 1 ) ( 0 ) ( ii k i j k j ij k i i k k i B P B B B P λ γ λ λ + − − − =
∑
= (29)Substituting for from (29) in (21) give
( ) 1 1 ) ( 0 ) ( 2 2 ) 1 ( k L D n
i i k ii j k j ij k i i k P P B P B B B g + = + − − −
∑
∑
= = λ γ λ λ (30) orf(λk)=PD+PL(k) (31)
Expanding the left side of the equation by using Taylor series about an operating point and neglecting the higher order terms results
( k) ( ( ))(k), (k) PD PL(k) d
df
f + ∆λ = +
λ λ
λ (32)
or ) ( ) ( ) ( ) ) ( ( k k k d df P λ λ
λ = ∆
∆
∑
∆ = ) ( ) ( )( i k
k d dP P λ (33) where
∑
∑
∑
= = = + − − − = ∂ ∂ g g n i n i ii k i j k j ij k i i k k i B P B B B P 1 1 1 ) ( 0 ) ( ) ( 2 2 ) 1 ( ) ( λ γ λ λλ (34)
Therefore,
λ(k+1) =λ(k)+∆λ(k) (35)
where
∑
= − + = ∆ g n i k i k L Dk P P P
P 1 ) ( ) ( ) ( (36)
The process is continued until is less than a specified accuracy. If an approximate loss formula expressed by
∑
= = g n i i ii L B PP 1
2
(37)
is used, = 0, , and the solution of the simultaneous equation given (28) reduces to
) ( 2 ) ( ii k i i k k i B B P λ γ λ + −
= (38)
and equation (33) reduces to
∑
∑
= = + + = ∂ ∂ g g n i ni i k ii i ii i k i B B P 1 1 ) ( ) ( 2 ) ( λ γ β γ
λ (39)
333
Fig.3: Flow chart of Economic Dispatch using λ iteration method
IV.RESULTS
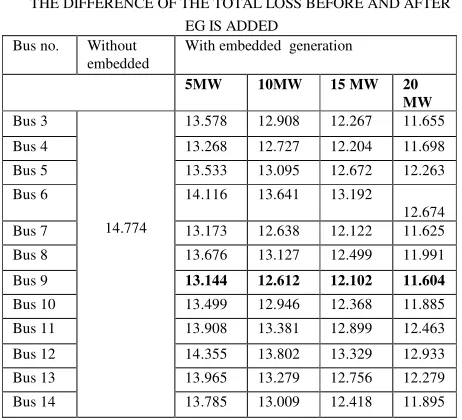
[image:5.612.330.512.93.188.2]The result is present in a table form to see clearly the difference at each bus when the EG is added. The analysis started with penetrated the EG at bus 3.Bus 1 and bus 2 are not used because this two bus is the slack bus and PV bus which refer to bus code 1 and 2. The data from the IEEE 14-bus shown the system have 12 load 14-bus which refer to 2 for the bus code. At first, the smallest value of EG which is 5 MW was used to see the total loss of the overall system and then followed by 10 MW, 15 MW and 20 MW. Then, all the load bus is tested to see the best location to penetrated the EG that can result the smallest value of loss.
TABLE 1
THE DIFFERENCE OF THE TOTAL LOSS BEFORE AND AFTER EG IS ADDED
Bus no. Without embedded
With embedded generation 5MW 10MW 15 MW 20
MW Bus 3
14.774
13.578 12.908 12.267 11.655 Bus 4 13.268 12.727 12.204 11.698 Bus 5 13.533 13.095 12.672 12.263 Bus 6 14.116 13.641 13.192
12.674 Bus 7 13.173 12.638 12.122 11.625 Bus 8 13.676 13.127 12.499 11.991 Bus 9 13.144 12.612 12.102 11.604 Bus 10 13.499 12.946 12.368 11.885 Bus 11 13.908 13.381 12.899 12.463 Bus 12 14.355 13.802 13.329 12.933 Bus 13 13.965 13.279 12.756 12.279 Bus 14 13.785 13.009 12.418 11.895
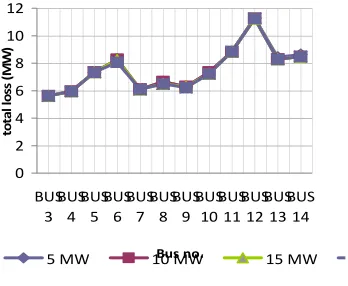
The results above has shown the total loss is the lowest when the EG is added at bus 9 compared at another bus. From the results, the total system loss is higher at bus 16 where there is not much difference from the loss when EG is not added at the system. The results presented that the most efficient bus to add the EG is at bus 9. The changing of the EG value also has shown that the bigger output from the EG, the lesser the losses of the system. But the EG is only for small generation and usually the size of the generator is not exceed 20 MW.
TABLE 2
THE DIFFERENCE OF THE TOTAL LOSS WHEN EG AND THE ECONOMIC DISPATCH IS ADDED
Without economic dispatch
With embedded generation and economic dispatch
5MW 10MW 15 MW
20 MW Bus 3
12.0052
5.61969 5.6192 5.6185 5.6185
Bus 4 5.95905 5.9592 5.9580 5.9581 Bus 5 7.34198 7.3410 7.3420 7.3420 Bus 6 8.28839 8.2655 8.2461 8.0731 Bus 7 6.09396 6.0946 6.094 6.0939 Bus 8 6.64797 6.6537 6.4891 6.4891 Bus 9 6.29447 6.2947 6.2943 6.2211 Bus 10 7.34568 7.3456 7.2352 7.2355 Bus 11 8.83372 8.8325 8.8323 8.8320 Bus 12 11.2648 11.264 11.264 11.264 Bus 13 8.4343 8.287 8.2854 8.2863 Bus 14 8.617 8.4862 8.486 8.4859
yes
no Start
End Determine λ
Output
Change λ
Calculate error, ɛ=Pload - Calculate Pi for i=1,2…N
|ɛ| « tolerance First iteration
yes no
0 5 10 15 20
B
U
S
3
B
U
S
4
B
U
S
5
B
U
S
6
B
U
S
7
B
U
S
8
B
U
S
9
B
U
S
1
0
B
U
S
1
1
B
U
S
1
2
B
U
S
1
3
B
U
S
1
4
to
ta
l l
os
s(
M
W
)
bus no.
5 MW
10 MW
15 MW
[image:5.612.314.539.387.583.2]20 MW
[image:5.612.70.301.517.727.2]334 For the economic dispatch, the total loss is lower when
[image:6.612.342.543.98.219.2]the EG is penetrated at bus 3. This result is difference compare to the loss when the economic dispatch is not applied because the calculation of the economic dispatch not only considered the loss of the system but also the plant cost, plan limit and the loss coefficient. This was the reason the economic dispatch loss is differ from the loss that not use the economic dispatch. The results also showed the loss is reducing almost half the original loss. If the loss without the economic dispatch is about 12 MW, after the EG is used at the bus and then dispatch is added to the system, the total loss reduced to around 5 MW for the EG that value of 5 MW. The change of the EG to 10 MW, 15 MW and 20 MW is not difference from the 5 MW EG for each every bus.
TABLE 3
THE DIFFERENT IN TOTAL GENERATION COST Without
economic dispatch
With embedded generation and economic dispatch 5MW 10MW 15 MW 20 MW
Bus 3
2530.98
2484.26 2484.26 2484.26 2484.26
Bus 4 2487.15 2487.15 2487.15 2487.15 Bus 5 2498.95 2498.95 2498.94 2498.94 Bus 6 2507.04 2506.85 2506.68 2505.20 Bus 7 2488.30 2488.30 2488.30 2488.30 Bus 8 2493.03 2493.08 2491.67 2491.67 Bus 9 2490.01 2490.01 2490.01 2489.39 Bus 10 2498.98 2498.98 2498.04 2498.04 Bus 11 2511.71 2511.70 2511.70 2511.70 Bus 12 2532.58 2532.57 2532.58 2532.58 Bus 13 2508.29 2507.03 2507.02 2507.02 Bus 14 2509.85 2508.73 2508.73 2508.73
Back to the objective to minimize the cost of the generation, the total cost of the system is shown and compared to the cost before the economic dispatch applied to the system. The cost before the economic dispatch is 2530.98 $/h and take the cost at bus 3 to make comparison since the cost at bus 3 less than another bus, 2484.26 $/h. The difference from this cost is around 46.72 $/h. That is, with the loading, the total annual saving may up to 400, 000 $/h.
V.CONCLUSION
The application of Embedded Generator and the economic dispatch was presented in this paper. These paper was show that the modification by put the embedded generation and the economic dispatch will decrease the total losses and reduce the total cost of generation. From the results, we can see the total loss is decrease when we put the Embedded Generation and when the economic dispatch is apply, the losses is decrease once again. When the total losses are reduced, it means the total generation is almost equal to the total demand. Means all the power generated is used to supply to load or demand. The generation cost also reduces when the total loss is decrease. A couple of recommendation has been concluded for future research should aim for less losses and generating cost. So, for the future aspect of this project, a couple of recommendation and suggestion that can be considered such as
• The Latest Studies Use to In Economic Dispatch.Recent years, there are several topics like neural network and fuzzy logic studies have been done by the researcher. These topics are very useful to implement into this economic dispatch especially the neural network where a lot of journal has been present about the use of neural network to solve the economic dispatch.
• Simulation Using Real Data for this project is obtained from IEEE which means all the data collected are assumed and considered in ideal condition. The line data 0
2 4 6 8 10 12
BUS
3 BUS
4 BUS
5 BUS
6 BUS
7 BUS
8 BUS
9 BUS
10 BUS
11 BUS
12 BUS
13 BUS
14
Bus no.
to
ta
l
lo
ss
(
M
W
)
[image:6.612.99.273.107.250.2]5 MW 10 MW 15 MW
Fig.4: Total loss versus bus no. where the embedded and the economic dispatch was applied to the system
2460 2470 2480 2490 2500 2510 2520 2530 2540
BU S 3
BU S 4
BU S 5
BU S 6
BU S 7
BU S 8
BU S 9
BU S 1
0
BU S 1
1
BU S 1
2
BU S 1
3
BU S 1
4
Bus no.
to
ta
l
co
st
(
$
/h
)
5 MW 10 MW 15 MW 20 MW
335 that has been used is the total loss and the real losses
caused by the nature phenomena such as weather, heat, wind, natural electromagnet charges for overhead line, the resistance from the soil for underground cable and others are not considered. By using the real data, it could ensure that this research can be applied and reliable to the real life application.
VI.ACKNOWLEDGMENT
The authors gratefully acknowledged the staffs in the Laboratory of Electric Machines and Drives as well as Laboratory of Electric Power, UTHM for their valuable contributions towards the success of this work. The authors would like to thank the Research Innovation and Management Center, UTHM for financially supporting this research under the short grant.
VII.REFERENCES
[1] United States of Department Energy (2005), “The Value of Economic Dispatch”
[2] Charles W. Ritcher, Jr. (2007), “Power System Stability and Control”, Electric Power Engineering Handbook 2nd edition Florida CRC Press.
[3] Marija Ilić and Francisco Galiana (2007), “Power System Restructuring :Engineer and Economics” Florida CRC Press.
[4] Hadi Saadat (1999), “Power System Analysis”. New York : Mcgraw-Hill.
VIII. BIOGRAPHIES
Hui Hwang, Goh, was born in 1974 in Kuching, Sarawak. He received his BEng, MEng and PhD from Universiti Teknologi Malaysia in 1998, 2003 and 2007, respectively all in Electrical Engineering. He is currently a senior lecturer in the Department of Electrical Power Engineering at Universiti Tun Hussein Onn Malaysia (UTHM) in Parit Raja, Batu Pahat, Malaysia. H. H. Goh is a Member of the Institution of Electrical & Electronic Engineers (IEEE) and a Member of the Institution of Engineering and Technology (IET). His field of interest includes Power System Modelling and Analysis, Embedded Power Generation, Economy dispatch, Power Quality, Analytical Hierarchy Process (AHP), Load Shedding, Machine and Drive and Data Mining.
Boon Ching, Kok, was born in 1974 in Melaka. He received his BEng, MEng and PhD from Universiti Teknologi Malaysia in 1998, 2002 and 2009, respectively all in Electrical Engineering. Dr. Kok is currently a lecturer in the Department of Electrical Power Engineering at Universiti Tun Hussein Onn Malaysia. Dr. Jamali is a member of the Institution of Electrical & Electronic Engineers (IEEE). His field of interest includes Power System Modelling and Analysis, Machine and Drive, HVDC and Renewable Energy.