Journal of Chemical and Pharmaceutical Research, 2013, 5(11):450-456
Research Article
CODEN(USA) : JCPRC5
ISSN : 0975-7384
Development and validation of RP-HPLC-PDA method for the analysis of
sumatriptan in invitro transdermal permeation studies
Shaik Firdose, R. Sri Bramhini, V. Sai Sri Anusha, V. L. Padmini and Buchi N. Nalluri*
Department of Pharmaceutical Analysis, KVSR Siddhartha College of Pharmaceutical Sciences,
Vijayawada, AP, India
_____________________________________________________________________________________________
ABSTRACT
The aim of the present work is to develop and validate a simple, efficient, economical RP-HPLC method for the analysis of Sumatriptan (SMT) in samples obtained from in vitro transdermal permeation studies. A Phenomenex C18 reverse phase column (150 x 4.6mm, 5µm) with mobile phase containing 10mM ammonium acetate: methanol
(75:25% v/v) at a flow rate of 1.2mL/min was used in isocratic mode and eluents were monitored at 230nm. The retention time of SMT was 3.61 min and showed a good linearity in the concentration range of 0.2-3µg/mL with a correlation coefficient >0.999. In vitro skin permeation studies were carried out using a Franz diffusion Cells. Absence of interference peaks at the retention time of SMT indicates that the method was specific for the analysis of SMT in samples obtained from in vitro transdermal permeation studies. The percent recoveries were ranged in between 98-102 (RSD < 2). The validation parameters like specificity, linearity, accuracy and limit of detection, limit of quantification, precision, robustness fulfilled regulatory requirements. The developed HPLC method was successfully used for the analysis of SMT in samples obtained from in vitro transdermal permeation studies.
Keywords: C18 reverse phase column, Method validation, PDA detection, Sumatriptan, Transdermal permeation
studies.
_____________________________________________________________________________________________
INTRODUCTION
SMT is a cholinesterase inhibitor and chemically it is 1-[3-(2-dimethyl amino ethyl)-1H-indol-5yl]-N-methyl-methane sulfonamide and used in the treatment of migraine headaches [1]. It is a 5-HT1B/1D/1F receptor agonist, it acts
by inhibiting trigeminal nerve transmission and it also constricts large arteries [2].
Various analytical methods have been reported in the literature for quantitative determination of SMT in combination with other drugs like Naproxen, Domperidone, by HPLC [3-6], spectrophotometry [7-9], fluorimetry [10-11], and by LC-MS [12-13]. Literature survey reveals that there were no validated RP-HPLC-PDA methods reported for the estimation of SMT in transdermal permeation studies. Hence, the present investigation was aimed at developing a validated RP-HPLC-PDA method for the analysis of SMT in samples obtained from in vitro
transdermal permeation studies.
EXPERIMENTAL SECTION
Chemicals
Equipment
A Shimadzu Prominence HPLC system provided with DGU-20A3 degasser, LC-20AD binary pumps, SIL-20AHT auto sampler, and SPD-M20A PDA detector was used. Data acquisition was carried out using LC solutions software. The chromatographic analysis was performed on C 18 reverse phase Phenomenex column (150 × 4.6mm,
5µ).
In Vitro Skin Permeation Studies
The in vitro transdermal permeation studies were performed using a vertical type Transdermal Diffusion Cell apparatus with a water circulation system, a water heater and an eight stage magnetic stirrer (Orchid Scientifics, Nashik, India). Franz diffusion cells with a diffusion area of 1.77 cm2 and a receptor volume of ~14 mL were used and 0.9%w/v sodium chloride (saline) was used as receptor fluid. In the case of skin permeation studies the porcine ear skin was mounted between donor and receptor chambers facing stratum corneum surface towards donor side and clamped. The surface of the skin was maintained at 32°C by keeping receptor fluid at 37°C using a circulation water bath. 500 µL of saturated SMT solution in propylene glycol: saline (70:30 v/v) was added to donor chamber. Samples of 500 µL were withdrawn at pre-determined time intervals and stored at 4°C until analysis. 500 µL of fresh saline was replaced at each sampling point. The study was carried out over a 48 hr period and the samples were analyzed for SMT content by developed HPLC method.
Chromatographic Conditions
Mobile phase consisting of 10mM ammonium acetate: methanol (75:25% v/v) was used in isocratic mode and the mobile phase was filtered through nylon disc filter of 0.45µ m (Millipore) and sonicated for 3 min before use. The flow rate was 1.2 mL/min and the injection volume was 10µL. PDA detection was performed at 230nm and the separation was achieved at ambient temperature.
Preparation of stock and standard solutions
The stock solution of SMT strength 1mg/mL was prepared by dissolving 14 mg of Sumatriptan succinate (equivalent to 10mg of sumatriptan) in water and volume was adjusted to the mark with the same. An appropriate volume of the stock solution was then further diluted with 0.9%w/v Sodium chloride to get the required concentrations of standard solutions of SMT at a concentration range of 0.2-3µg/mL.
Validation of the HPLC method
The proposed method was validated as per ICH guidelines.
Linearity
A linear relationship was evaluated across the range of the analytical procedure with a minimum of five concentrations. A series of standard dilutions of SMT were prepared over a concentration range of 0.2-3µg/mL (0.2, 0.5, 1, 2, 3µg/mL) from stock solution and injected in triplicate. Linearity is evaluated by a plot of peak areas as a function of analyte concentration, and the test results were evaluated by appropriate statistical methods where by slope, intercept, and regression (R2) correlation coefficients (R) were calculated and the data was given in Table1.
Precision
Precision is the measure of closeness of the data values to each other for a number of measurements under the same analytical conditions. Repeatability was assessed by using a minimum of six determinations at 100% of the test concentration. The standard deviation and the relative standard deviation were reported for precision. Less than 2% RSD for peak areas indicates the precision of the developed method and the data was presented in Table-1.
Specificity
The specificity of the method was determined by comparing the chromatograms obtained from the drug substance with that obtained from the samples obtained from in vitro transdermal permeation samples using PDA detector. The overlay of diluent, standard and sample were presented in Figure-2. Absence of interference of excipients indicates the specificity of the proposed method.
Accuracy
______________________________________________________________________________
Limit of Detection (LOD) and Limit of Quantification (LOQ)
LOD and LOQ were calculated based on calibration curves. They were expressed as LOD = (3.3 ×σ)/m; LOQ= (10.0×σ)/m (Where, σ is the standard deviation of the y-intercepts of the three regression lines and m is mean of the slopes of the three calibration curves).
Robustness
To determine the robustness of the method developed, the experimental conditions were deliberately altered and the chromatographic parameters viz., tailing factor, no. of theoretical plates were recorded. The flow rate of the mobile phase was 1.2mL/min. To study the effect of flow rate, the flow rate was changed by 20%, the effect of wavelength was studied by changing wavelength by ±2nm, the effect of mobile phase was studied by changing the mobile phase by 20% and the data was given in Table-2.
System suitability
System suitability was carried out by injecting a standard concentration at different injection volumes in the range of 10-50µL. The system suitability test parameters were noted and % RSD was calculated.
RESULTS AND DISCUSSION
Various HPLC-UV and LC-MS methods were published for the estimation of SMT in bulk and dosage form but so far no methods were reported on the quantification of SMT in transdermal permeation studies. Hence, the present investigation was aimed to develop a simple, economical RP-HPLC-PDA method for the determination of SMT in samples obtained fromin vitro transdermal permeation studies.
Method Development
Initially mobile phase optimization was carried out with Inertsil ODS column (250 x 4.6mm, 5µ) using water and acetonitrile (38:62% v/v) as mobile phase at a flow rate of 1 mL/min and 0.9% Sodium chloride was used as diluent and the eluents were monitored at 230nm. With these conditions, SMT was eluted with solvent front at 2.533 min. In another trial Phenomenex C18 column (250 x 4.6mm, 5µ) was used with formic acid (0.02% v/v) and
methanol (25:75% v/v) as mobile phase at a flow rate of 1mL/min and with these conditions SMT peak was eluted after solvent front with retention time 3.464 min but the eluted peak was broad. Finally, the mobile phase of 10mM ammonium acetate and methanol (75:25% v/v) with Phenomenex C18 column (150 x 4.6mm, 5µ) was selected at a
flow rate of 1.2mL/min using 0.9% sodium chloride as diluent and under these conditions sharp SMT peak was eluted at 3.61 min with good symmetry and tailing factor was within the limits. For quantitative purpose wavelength was set at 230 nm, which provided better reproducibility without interference. The peak purity index was found to be greater than 0.9999 and this indicating peak purity of the drug sample used in the analysis and the SMT chromatogram along with UV spectrum and peak purity profile was shown in Figure-1.
Method Validation
The method has been validated as per ICH-Guidelines for following parameters.
Linearity
The range of reliable quantification was set at the concentrations of 0.2-3µg/mL of SMT. This range was selected based on 80-120% of the standard concentration used for accuracy and were analyzed in triplicate. Peak areas and concentrations were subjected to least square regression analysis to calculate regression equation. The regression equation was y =64239x-1362 and correlation coefficient (R) was found to be 0.999 indicating a linear response over the range used. The data from the calibration curve was given in Table-1.
Precision
Precision studies were carried out in terms of repeatability. Repeatability of standard application was assessed by using six replicates of concentration at 1µg/mL level and the data was given in Table-1. The % RSD was found to be below 2 for peak areas, this shows the closeness of the data values to each other, indicating the precision of the method.
Accuracy
0.0 0.5 1.0 1.5 2.0 2.5 3.0 3.5 4.0 4.5 5.0 5.5 m in -9 -8 -7 -6 -5 -4 -3 -2 -1 0 1 2 3 4 5 6 7 8 m AU
230n m,4nm (1.00)
3
.6
1
6
3.40 3.45 3.50 3.55 3.60 3.65 3.70 3.75 3.80 3.85 3.90 3.95 m in
0.00 0.05 0.10 0.15 0.20 0.25 0.30 0.35 0.40 0.45 0.0 0.5 1.0 1.5 2.0 2.5 3.0 3.5 4.0 4.5 5.0 5.5 6.0 6.5 7.0 7.5 8.0 m AU Peak Zero Line Purity Curve
200.0 225.0 250.0 275.0 300.0 325.0 350.0 375.0 nm
[image:4.595.106.506.69.616.2]0 1 2 3 4 5 6 7 8 m AU 3.62/ 1.00 2 2 7 2 8 2
Fig. 1: A - Chromatogram of SMT (1µg/mL); B - Peak purity index of SMT and C - UV spectrum of SMT
Specificity
The specificity of the method was established by injecting the solutions of diluent, standard, diffusion sample individually to examine any interference, from the overlay of chromatograms as shown in (Figure-2) it can be inferred that there were no co-eluting peaks at the retention time of SMT. These results indicate that the peak of analyte was pure and the in vitro transdermal permeation samples did not show any interference with the sample analysis. The peak purity indices for sample and standard were found to be greater than 0.999 and this confirms specificity of the method by PDA detector.
A
B
______________________________________________________________________________
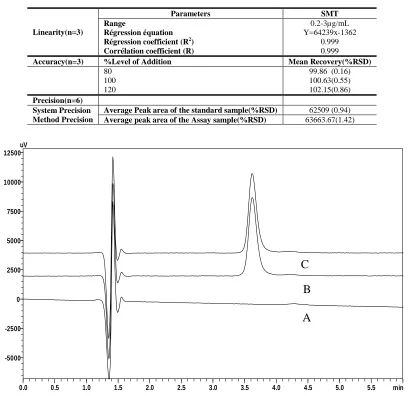
Table-1: Linearity, Precision and Accuracy data of SMT
Linearity(n=3)
Parameters SMT
Range
Régression équation
Régression coefficient (R2)
Corrélation coefficient (R)
0.2-3µg/mL Y=64239x-1362
0.999 0.999
Accuracy(n=3) %Level of Addition Mean Recovery(%RSD)
80 100 120
99.86 (0.16) 100.63(0.55) 102.15(0.86)
Precision(n=6) System Precision Method Precision
Average Peak area of the standard sample(%RSD) 62509 (0.94)
Average peak area of the Assay sample(%RSD) 63663.67(1.42)
0.0 0.5 1.0 1.5 2.0 2.5 3.0 3.5 4.0 4.5 5.0 5.5 min
-5000 -2500 0 2500 5000 7500 10000 12500 uV
Fig. 2: Overlay of the Diluent (A), SMT Standard (B) and SMT Sample (C) chromatograms
Limit of Detection (LOD) and Limit of Quantification (LOQ)
LOD and LOQ were determined based on statistical calculation from the calibration curves, where LOD = (3.3 ×σ)/m; LOQ= (10.0×σ)/m (σ is the standard deviation of the y-intercepts of the three regression lines and m is mean of the slopes of the three calibration curves). The limit of detection and limit of quantification were found to be 0.0134µg/mL and 0.0407µg/mL respectively and the SMT peaks were detected without any base line disturbances at this concentration.
Table-2: Robustness data of SMT:
Chromatographic parameter Retention time (min) Theoretical plates # Tailing factor (Tf)
Flow rate (mL/min)
[image:5.595.136.479.616.745.2]Robustness
As part of the robustness, a deliberate change in the flow rate, wavelength and mobile phase was made to evaluate the impact on the method. Retention times were significantly changed with flow rate, mobile phase and no change in the retention time was observed in wavelength change. The parameters like theoretical plate number, tailing factor were not changed and were within the limits. These results indicated that the method is robust in terms of changed flow rate, mobile phase and wavelength.
System suitability
System suitability testing is an integral part of the analytical procedure. System suitability studies were carried out by injecting five times a 1µg/mL standard concentration of SMT at different injection volumes ranging from 10µL to 50µL. The %RSD values for system suitability test parameters like retention time [Rt = 3.61 (1.182%)], tailing factor
[Tf = 1.216 (0.396%)] and theoretical plate number [# = 3452.4878 (0.631%)] were less than 2% indicating the
present conditions were suitable for the analysis of SMT in samples obtained from in vitro transdermal permeation studies.
Stability of the stock solution
The stability of the stock solution was determined by analyzing the samples under refrigeration (8±1oC) at different time intervals up to 24hrs. The variation in assay values at different time intervals were found to be less than 2% of the initial zero time interval solution, thus indicating that the solutions were stable for a period of 48hrs when stored at 8oC.
In vitro transdermal permeation studies
The validated method was used for the analysis of SMT in in vitro transdermal permeation studies. No interference peaks were observed with the SMT peak. Permeation profile was plotted with the cumulative amount permeated (nmol) versus time (hrs). The permeation profile was presented in Figure-3. From the permeation profile the transdermal flux in the steady state was found to be 283.40 nmol / cm2 / hr and the lag time of 2.6 hrs. The amount of drug retained in the skin after the transdermal permeation study was also estimated by the developed method. The method can be successfully used for the quantification of SMT in the skin permeation studies.
Fig.3: In vitro permeation profile of SMT
CONCLUSION
______________________________________________________________________________
Acknowledgements
The authors are thankful to Aurobindo Pharma Ltd, India for providing gift sample and also to the Siddhartha Academy of General and Technical Education, Vijayawada, for providing necessary facilities to carry out the research work.
REFERENCES
[1]Maryadele JO Neil. The Merck Index. 13th ed. Merck Research Lab publishers, White House Station, NJ, US.
2001, 9088 [1605].
[2]HP Rang; MM Dale; JM Ritter; RJ Flower; G Henderson. Pharmacology. 7th ed. Elsevier, Toronto. 2012, 202,271,469.
[3]M Franklin; J Odontiadis; EM Clement. J chromatogr B Biomed Sci Appl .1996, 681(2), 416-20. [4]P Minakshi; C Pooja; AS Shubhini. Asian J Pharm Clin Res.2012, 5(3), 176-178.
[5]DS Sagar; DRPU paresh. Int J Pharm Pharm Sci. 2012, 4(1), 276-278. [6]S Lokesh; N Sanju; C Rajiv. Chron Young Sci.2011, 2(1), 37-41.
[7]KN Prashanth; K Basavaiah; CM Xavier. Journal of the Association of Arab Universities for Basic and Applied
Sciences.2013, 2249-0337.
[8]M Trinath; SK Banerjee; D Hari Hara Teja; C.G.Bonde. Der Pharmacia Sinica.2010, 1(1), 36-41. [9]B Kalyanaramu; G Rupakumari; K Ramarao; K Raghubabu. Int J Pharm Pharm Sci.2011, 2249-0337. [10]Z Ge; E Tessier; L Neirinck; Z Zhu.J Chromatogr B Analyt Technol Biomed Life Sci.2004, 806(2), 299-303.
[11]DW Boulton; GF Dudcan; NN Vachharajani.Biomed. Chromatogr. 2003, 17(1), 48-52.
[12]KN Cheng; MJ Redrup; A Barrow; PN Williams.J. Pharm. Biomed. Anal. 1998, 17(3), 399-408.
[13]Xiaohui Xu; GB Michael; JT Stewart.J. Pharm. Biomed. Anal. 2001, 26(3), 367-377.
[14]PS reddy; S sait; G vasudevmurthy; M natarajan; V Prasad; SJ reddy.J.Chem.Pharm.Res.2012, 4(6), 3263-3274. [15]WH Visser; J Burggraof; LM Muller; RC Schoemaker; PA Fowler, AF Cohen; MD Ferrari . Clin pharmacol