CLIMATE CONTROL UTILIZING SOLAR POWERED VENTILATION SYSTEM FOR PARKED CAR
TENGKU MARISSA BINTI TENGKU AHMAD
A project report submitted in partial fulfillment of the requirement for the award of the Master of Electrical Engineering
Faculty of Electrical and Electronic Engineering Universiti Tun Hussein Onn Malaysia
ABSTRACT
vi
ABSTRAK
TABLE OF CONTENTS
TITLE i
DECLARATION ii
DEDICATION
ACKNOWLEDGEMENT
ABSTRACT
CONTENTS
LIST OF TABLE
LIST OF FIGURE
LIST OF SYMBOLS AND ABBREVIATIONS
LIST OF APPENDICES
iii
iv
v
vii
x
xi
xiii
xv
CHAPTER 1 INTRODUCTION
1.1 Overview of the Project 1.2 Problem statement
1 4
1.3 Objectives 5
1.4 Scope of Work 1.5 Thesis Structure
5 5
CHAPTER 2 LITERATURE REVIEW
2.1 Overview 7
viii
2.3 Studies on Preliminary Design of Ventilation System in The Car Using Solar Energy
2.3.1 Studies on Solar Energy 2.3.2 Solar Panel
2.3.4 Battery 2.4 Car Air Ventilation
2.5 Ventilation With Solar Energy 2.5.1 Ventilation Fan
2.6 Theory of Heat Analysis in Cars Based Solar Radiation 11 12 12 14 15 16 16 18
CHAPTER 3 METHODOLOGY
3.1 Introduction 21
3.2 Project Planning Flowchart 23
3.3 Device and Apparatus Selection
3.3.1 Fans As Heat Removing Device 3.3.2 Thermometer
3.3.3 Multimeter, Tachometer And Lux Meter Device
25 25 26 26
3.4 Designing and Fabricating the Ventilation System
3.4.1 Experiment Set Up 3.5 Analysis Method
27
28 29
CHAPTER 4 RESULT AND ANLYSIS
4.1 Introduction
4.2 Heat Analysis Inside The Car
4.2.1 Heat Analysis On Car Windscreen 4.2.2 Heat Analysis On Car Rear Mirror
4.2.3 Heat Analysis On Car Side Mirror 4.3 Ventilation Fan Sizing Analysis
4.4 Solar Panel Sizing Analysis 4.5 Battery Sizing Analysis 4.6 Result Data
4.7 DC Motor Controller Using PIC16F877A 4.7.1 The Motor Speed At Level 1
4.7.2 The Motor Speed At Level 2
4.7.3 The Motor Speed At Level 3
4.7.4 The Motor Speed At Level 4
4.7.5 The Motor Speed At Level 5
4.8 The Performance Of Battery Storage 4.9 Temperature Sensor Circuit
4.10 Temperature Analysis Without Ventilation System Install
4.11 Temperature Average Without Ventilation System Install
4.12 Temperature Analysis With Ventilation System Install
4.13 Temperature Average With Ventilation System Install
4.14 Temperature Comparison 4.15 Effectiveness Of The System 4.16 Propose New Design
40 40 41 42 43 44 45 46 47 48 50 51 52 53 54 55 56 57
CHAPTER 5 CONCLUSION AND RECOMMONDATION
5.1 Discussion 5.2 Conclusion
5.3 Future Recommendations
x
LIST OF TABLE
4.1 Result for the motor level and motor speed based on the 41 temperature range
4.2 Result for PWM Pulse 48
4.3 Result of the temperature and voltage from output LM35 50
LIST OF FIGURE
1.1 Type of accidents among children from 2006 until 2011 2 1.2 Graph the Number Death of Children in Vehicle cause by 3
Hyperthermia
2.1 Temperature variation with the time at different locations 8
2.2 Part of the simulation model 9
2.3 Temperature distribution in the car without ventilation rear 9 view
2.4 The Diagram of Percentage Temperatures Efficiency versus 10 Flow Rate Q Bjorn Jenssen Wachenfeldt
2.5 Typical trend of dashboard surface temperature during 11 parking conditions in summer
2.6 Flow of air when the vehicle moves forward 15 2.7 Squirrel cage that used to help move air throughout the 15
passenger compartment
2.8 Schematic diagram of light radiation through the glass 20
3.1 General Flow Chart Of The Project 21
3.2 Flow Chart Of Project Planning 23
3.3 Blower ( Centrifugal Fan Type) 25
3.4 Digital Temperature to measure temperature inside the 26 Car compartment
3.5 Tachometer and Digital Multimeter 27
3.6 Lux Meter 27
3.7 Schematic Diagram of the Project by using Proteous 28 Sofware
3.7 Diagram for Location of the System Components 29
xii
4.2 Side view Car Windscreen 34
4.3 Side view windows Front and Rear Side Car 37 4.4 Waveform of PWM during Time High (TH) cycle. 43 4.5 Waveform of PWM during Time Low (TL) cycle 44 4.6 Waveform of PWM during Time High (TH) cycle 44 4.7 Waveform of PWM during Time Low (TL) cycle 45 4.8 Waveform of PWM during Time High (TH) cycle 45 4.9 Waveform of PWM during Time Low (TL) cycle 46 4.10 Waveform of PWM during Time High (TH) cycle 46 4.11 Waveform of PWM during Time Low (TL) cycle 47 4.12 Waveform of PWM during Time High (TH) cycle 47 4.13 Graph of The Performance Of Battery Storage 49 4.14 Graph the performance of output voltage without solar 49
charging, and with solar charging
4.15 Graph of Voltage VS Temperature 51
4.16 Temperatures without Ventilation System Install 52 4.17 Average Temperatures chart for Without Ventilation System 53
Install
4.18 Temperatures with Ventilation System Install 54 4.19 Average Temperature chart with Ventilation System Install 55
4.20 Temperature’s Comparison Chart 56
4.21 Graph of Temperature Data 58
LIST OF ABBREVIATIONS
Dosp - Daily output of solar panel ( W h per day at 12V)
II - Current at load or other current specification of solar panel (A)
Di - Daily Insolation (peak-hour per day)
N
sp - Minimum number of solar panelRe - Daily equipment of appliances (W h per day) Dosp - Daily output of one module( W h per day at 12V) Ŋbc - Charging effiency of battery (%)
Ct - Total usable capacity needed (A h at 12V) Re - Daily requirement of appliances (W h per day) Sd - Period of storage required (days)
Nb - Minimum number of 12V batteries needed Ct - Total usable capacity needed (A h at 12V)
Cb - Full capacity specified for one 12V battery (A h) Rmaks - maximum depth of cycle (%)
RPM - Rotation Per Minutes W - Power (Watt)
V - Voltage (Volt) I - Current (Ampere)
AC - Alternating Current (Ampere) CFM - Cubit Per Minutes (ft3/min) Q - Total Heat Flux (Btu/ hr) Ti - Temperature Inside (oC) To - Temperature Outside (oC)
As - Area of the window surface expose to sunlight, ft2 F - Film coefficient of heat transfer
xiv U - The average heat transfer coefficient through the window framed
α - Absorptivity
τ - Transmittivity
Cn - Whether brightness number C - Radiation diffusion factor A - Solar radiation
B - Atmospheric extinction coefficient, β - Degrees declined
LIST OF APPENDICES
APPENDIX TITLE PAGE
A World Solar Energy Map # 7 Solarex. 70 B Coefficient of Solar Radiation Based on Average 71
Bright Day At The time of day 21 Per Month C Senses Human Relations, Pisikologi And Health 72
Response To Long-term exposure. (Reprint from ASHRAE Fundamentals 1993)
D Hardware Development Process 73
CHAPTER 1
INTRODUCTION
1.1 Overview of the Project
Global warming of earth has faced many problems due to the high temperature that can cause adverse effect including the car that we used every day. A car that's been exposed to direct sunlight for an extended period will develop a temperature built up inside it. The factors contributing to this is the temperature outside of the car, the temperature inside of the car directly proportional with the temperature outside. It is also depends on the inlet condition of a car, the place with more air circulation will have the highest temperature rise.
in-car temperature and humidity within a range that is comfortable for the people inside and provide fresh, clean air for ventilation. This temperature range helps keep the driver alert and attentive.
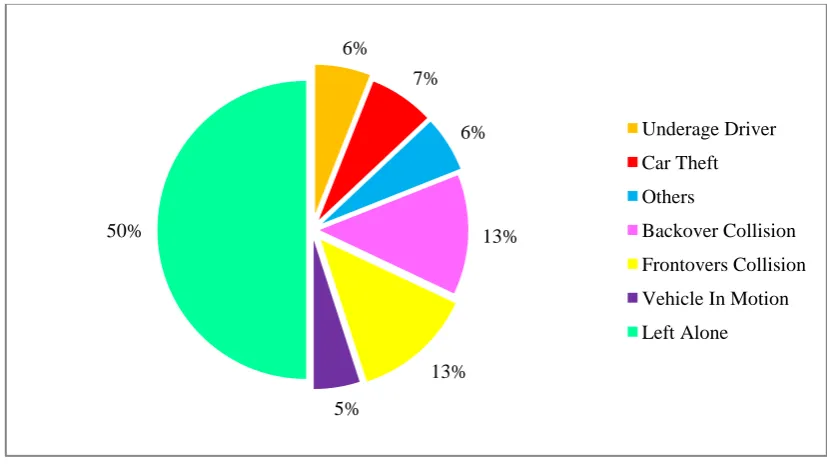
[image:14.595.112.526.276.510.2]Figure 1.1 shows the type of accidents among children from 2006 until 2011 at United State. From this observation, the pie chart shows the number of accidents involving children left in the car showed the highest percentage compared to other accidents such as underage driver, car theft, backovers, frontovers, vehicle in motion and etc. This caused the child left in a car in the hot condition inside the vehicle. This causes them to drown and can cause occurrence Hyperthermia.
Figure 1.1: Type of accidents among children from 2006 until 2011
Studies indicate that, each year children die from hyperthermia as a result of being left in parked vehicles. Hyperthermia is an acute condition that occurs when the body absorbs more heat than it can dissipate. Hyperthermia can occur even on a mild day. Studies have shown that the temperature inside a parked vehicle can rapidly rise to a dangerous level for children, adults and pets. Figure 1.1 shows the graph of number death among children that cause by hyperthermia due to suffocation inside the vehicle.
6%
7%
6%
13%
13%
5% 50%
Underage Driver
Car Theft
Others
Backover Collision
Frontovers Collision
Vehicle In Motion
3
Figure 1.2:Graph the Number Death of Children in Vehicle cause by Hyperthermia
Therefore, this 'Climate Control Utilizing Solar Powered Ventilation System For Parked Vehicle' was specifically designed to overcome heat problems occur in while their vehicles parked. The objective of this system is to eliminate or mitigate the effects of heat in the car while the car is parked. The project is intended for an invention of an independent ventilation system to maintain the thermal comfort range of a compartment car for pleasure of the passenger, for the safety precaution if there a case of self-lock happen, and it is also financially positive for fuel consumption and interior investment of the car.
This system will use the solar energy as a power source. Refers to the world of solar energy map as shown in (Appendix A), Malaysia receives direct sunlight during peak hours on average four to five hours a day. This makes Malaysia among one of the countries that receive the longest high levels of sunlight in the world. For saving electricity, the use of solar energy is very effective because duration sunlight receives in Malaysia is sufficient to generate electric power to an optimum level.
Solar was used to generate the energy as a power to move a fan to blow the fresh air inside the car that will make good air ventilation in the vehicles. The use of solar system thus can save the use of electricity and fuel consumption as fuel price is
0 5 10 15 20 25 30 35 40 45 50
going higher nowadays. Thus it would be a great way for vehicle to reduce air conditioning uses, thus increasing fuel economy.
Therefore, the study of the use of solar energy as a power source for ventilation systems for passenger cars is very important. Solar energy is used to ensure that the ventilation system is always working when the car engine is turned off thereby saving energy and costs as solely derived power from the sun is always available.
1.2 Problem Statement
The temperature inside the car cabin is easily controlled while the engine if the car is running. This can be achieved by using the air conditioning system. However, what happens if the passenger is waiting inside the car while the engine is not operating, is the passenger managing to be comfortable inside the car while the car is parked directly under sunlight and the heats inside the car cabin is increasing.
5
1.2 Objectives
The purposes of this project are;
(i) To determine the temperature increment inside the compartment car under direct sunlight.
(ii) To design a solar powered ventilation system that can eliminate and mitigate the effects of heat and suffocating inside car compartment.
(iii) To develop the heat analysis by determining the total heat flux produced in the static car compartment.
1.4 Scope of Work
This project is primarily concerned with theclimate control utilizing solar powered ventilation system for parked car.Scopes of this project are:
(i) Search, review and gather information about literatures reviews of car cabin ventilation from the journal and references book.
(ii) Run the experiment to determine the temperature distribution and its increment inside car cabin.
(iii) Modelling the intelligent actual climate control utilizing solar panel system by using Proteusand MPLAB software.
(iv) Design and implementation of the heat control algorithm with solar panel.
1.5 Thesis Structure
This thesis is divided into five main chapters, which in the first chapter is the introduction of the study. It covers topics such as sub-objectives and scope of the study.
Whereas in Chapter 2, involves the theories that relate to the study. In addition, the literature review also infused at this chapter as a reference for the development of this project and comparison of the results obtained from the research.
the design of this project is also shown to explain more clearly how the experiment was conducted.
After statistical work is done, the process of retrieval of information or data attached in Chapter 4. Data were recorded in the form of tables and graphs to analyze the process. In this part, the analysis and discussion were critically described.
CHAPTER 2
LITERATURE REVIEW
2.1 Overview
According to research Wan Mohd kamil Bin Yacob from Universiti Malaysia Pahang conducted in late 2009 on Waja Car, the maximum temperature inside the car that fully closed under direct of sunlight can be increased up to 72.7 °C. At temperature with that high it can cause of our car tax tag damaged when it frequently expose to the sun and the materials are made of plastic release Nox (Nitrogen monoxide mixing and nitrogen dioxide) that affect our health and damage cell membranes, proteins and acute inflammation of the respiratory tract in lung and cause asthma.
How many years ago there Vint brand car accessories install in the car which allows the car to breathe. It will draw cold air from the outside and remove the hot air in the car to lower the heat in the car. However it is not practical due to the fan using a car battery power. This is because, when the car is not moving for a period of two days (Saturday and Sunday) cause’s users burdened when they have work on Monday. Car battery is not capable of giving power to turn on the car engine.
expected. Moreover, there were no air holes for blowing hot air out of the car. How could little fan will be able to create a vacuum in the car.
Therefore, the planning studies take a leading role in the definitions of an issue. In this project, this system is designed to overcome these weaknesses. Due to several variables involved in the method and process, the planning activities had been before the actual product can be implemented.
2.2 Previous Study
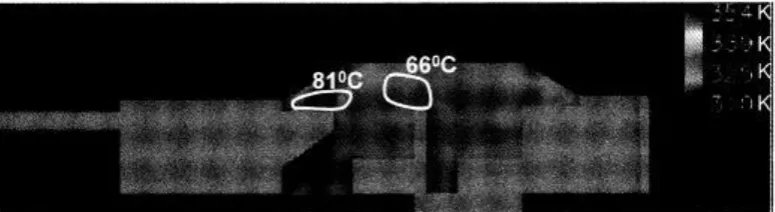
[image:20.595.170.466.526.720.2]Khan M.U et al, (1991) in [1] was developed development of ventilation technique to limit the car cabin temperature under a blazing sun. The temperature variation inside car cabin had been discussed in their investigation. From Figure 2.1 it shows the different of temperature at the top of the front panel and at the air temperature near driver head. These two places are the two highest temperatures in the car cabin. The same result achieved with simulation as shown in figure below. The simulation was did using three-dimensional Navier-Stokes equations. The software used is CFD2000, a Multi-disciplinary CFD and heat transfer software. The boundary condition is set to replicate the actual car used in the experiment. Mesh number is set to be 37x25x31 and the heat was radiate from roof, windows and seats. The air flows of the device also same with the experiment. The airflow rate of the fan is change in each simulation for 50, 100, 150 and 200 m3/h.
9
[image:21.595.198.435.180.335.2]The results from the simulation showed in Figure 2.2 and 2.3 shows almost the same pattern as experimental data. The maximum temperature taken is at the front dashboard that is 81°C and followed by the air space near the driver head, 66°C[1].
Figure 2.2: Part of the simulation model
Figure 2.3: Temperature distribution in the car without ventilation rear view
[image:21.595.124.512.391.497.2]temperature will fall to certain temperature with is lower than the temperature before ventilation.
Figure 2.4: The Diagram of Percentage Temperatures Efficiency versus Flow Rate Q BJORN JENSSEN WACHENFELDT
11
Figure 2.5 : Typical trend of dashboard surface temperature during parking conditions in summer
Another study case was about automatic Ceiling fan using PIR sensor by Mohd Rasidi Md Radzi, (2009/2010) in [4]. His project is to make the ceiling fan become ‘smart’ where it can sense the human present in the specific area and can turn on or off automatically. The main component that must be used to make sure the ceiling fan controller can switch the interested speed itself is by using microcontroller PIC16F877A. The way it working is as follow, when a user waves their hand, the PIC16F877A will analyse the signal given. After that, the output motor will receive the analog signal so that the motor driver can make the fan blow to reduce, increase and turn off based on the signal given by the user.
2.3 Studies on Preliminary Design of Ventilation System inThe Car Using
Solar Energy
comparisons have been made between these experiments with temperature changes after experimental ventilation system installed.
2.3.1 Studies on Solar Energy
Now, many people use solar energy or photovoltaic energy as an alternative power because it’s vastly available and renewable. In solar photovoltaic, sunlight is actually converted into electricity. Solar panels are made of silicon which will produce an electric charge when receiving direct sunlight or light.
Electrical charge from the solar panel is routed to the output terminals to produce low-voltage alternating current or direct current, generally between six to 24 volts. Normally the value of nominal output is 12 volts while the effective output value will increase up to 17 volts. Nominal output voltage of 12 volts is the reference voltage but operating voltage can be up to 17 volts or more as a system of charging a car battery Charger battery voltage of 12 volts above 12 volts. This shows that there is a difference between the reference voltages with the actual operating voltage [5].
Sun radiation intensity change by the hour every day and weather conditions. To make the analysis of a solar system, the amount of solar radiation is shown in the full sun hours per m² or peak sun hours. Term peak sun hours mean an average enrolment of sunlight per day in the year.
2.3.2 Solar Panel
The solar panels were made from silicon which is will produce an electric charge when receiving direct sunlight or light. An electric charge from the solar panel is routed to the output terminals to produce low-voltage alternating current or direct current, generally between 6 to 24 volts. Normally the nominal output is 12 volts. This is the nominal output voltage as the reference voltage but operating voltage can be up to 17 volts or more as a system battery charger capable of charging the battery voltage exceeds 12 volts. This shows that there is a difference between the reference voltages with the actual operating voltage.
13
17.1 and rated current 3.5 ampere.If an average of 6 hours of peak sun per day is available in an area, then the above solar panel can produce an average 360 watt hours of power per day; 60w times 6hrs. = 360 watt-hours. Since the intensity of sunlight contacting the solar panel varies throughout the day, we use the term "peak sun hours" as a method to smooth out the variations into a daily average. Early morning and late-in-the-day, sunlight produces less power than the mid-day sun. Naturally, cloudy days will produce less power than bright sunny days as well. Electricity produced by a panel calculated using the equation [5]:
Dosp = II x Dix 12v (2.1)
Where :
Dosp =Daily output of solar panel ( W h per day at 12V)
II = Current at load or other current specification of solar panel (A)
Di = Daily Insolation (peak-hour per day)
To determine the number solar panel require, the power loses when charging the batteries must be consider. This is the efficiency of the battery charger. The suitable value is 80 per cent for leaded acid batteries and 70 percent for nickel-cadmium batteries. The sizing formula for the minimum number of solar panels require is shown in equation (2.2)[5] :
N
sp=
𝑅𝑒 𝑥 100% Do sp
ŋ𝑏𝑐
(2.2)
Where :
N
sp = Minimum number of solar panel2.3.3 Battery
Internal cycle batteries are designed to be re-charged and charge thousands of times. The battery is measured in Ampere-hours and usually at 20 hours and 100 hours. In summary, the ampere-hour is the amount of current in amperes at which they can be supplied by a battery in a long time. For example, a 350 amp hour battery can supply 17.5 Amp continuous current for 20 hours or 35 Amp continuous current for 10 hours. To quickly identify the total wattage supplied in battery 6 volt 360 amp-hour, 360 Amp-hours multiplied by 6 volt equal to 2160 watts or 2.16 kWh (kilowatt-hour).
The usable capacity required is calculated from the daily electrical requirement and period of usage as follows equation (2.3) [5] :
V S R
Ct e d
12
(2.3)
where;
Ct = Total usable capacity needed (A h at 12V) Re = Daily requirement of appliances (W h per day) Sd = Period of storage required (days)
Therefore, the number of batteries that are needed is calculated from the usable capacity and cycle depth as follows [5]:
maks b t b R C C N % 100 (2.4) where;
Nb = Minimum number of 12V batteries needed Ct = Total usable capacity needed (A h at 12V)
15
2.4 Car Air Ventilation
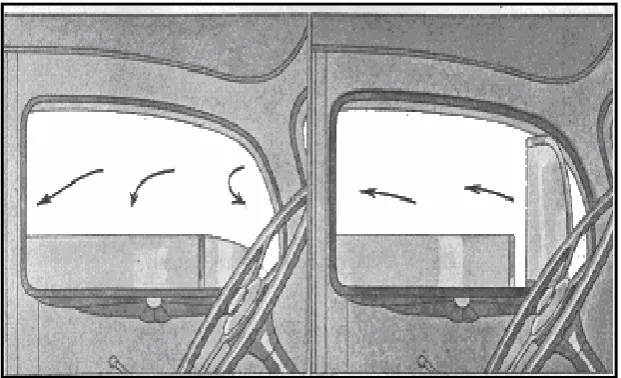
[image:27.595.164.475.525.714.2]Ventilation is a removing process that allows clean air accessing the car cabin and removing stale air. The process begins when the clean air, is allows entering the car cabin whether by it is force by mechanical system available or flowing naturally inside to the car. This ventilation system is important to keep the passenger compartment at a comfortable temperature. For health and comfort, some fresh air must pass through the passenger compartment. This replaces the stale and sometimes smoke-filled air inside the vehicle. The process is called ventilation. Most of people use to closed compartment car as a solution on preventing dusty air from entering the car. Then people start to use ducting system to allow air enter their car. Figure 2.6show the earliest closed cabin ventilation was the cowl air intake. When air coming over the hood scooped into the car interior through the space provided when the ventilator raise. However when the vehicles stopped or move slowly, just a little fresh air enters. This is one reason most vehicles have a power ventilating system which actually used a fan or blower and the fan is located in the dashboard. A blower assembly is attached to the motor shaft and the entire unit is placed inside the blower housing. As the squirrel cage blowers as shown in Figure 2.7 rotates, its produces a strong suction in the intake. A pressure is also created on the output. When the fan motor is energized by using the temperature control on the dashboard, air is moved through the passenger compartment [6].
Figure 2.7 : Squirrel cage that used to help move air throughout the passenger compartment.
2.5 Ventilation with Solar Energy
Fans are nearly ideal solar powered loads. They can run directly off direct current. Solar powered fans run when they are most needed, when the sun is shining. During summer months, the temperature can reach to very high temperature. High temperatures cause an increase in temperature in the living space and an increase in energy consumption by air conditioning equipment. Forced ventilation will circulate cooler air through the attic space and lower the temperature. Fan and solar module combination allow daytime ventilation and air circulation anywhere the sun shines. They are great for green houses, kennels, barns and attic where alternative current (AC) power is not available. The solar module runs the fan at full power in full sun and at a slower speed in overcast weather. Operation is automatic. When the sun shines on the solar module, the fan begins to operate.
2.5.1 Ventilation Fan
17
Besides that, for the requirement of ventilation system, fan selection is determined by calculating the fan flow rate, CFM. Flow rate, CFM of the fan is determined using the method of heat removal (Heat-Removal Method) [3] as in equation (2.5) [7]:
CFM =
) (
085 .
1 Ti To
Q
(2.5)
where;
CFM = Fan flow rate (ft3/min) Q = Total heat increase (Btu/ hr)
Ti = Maximum tolarance inside temperature (˚C) To = Average outside temperature (˚C)
To calculate the daily requirement in W h per day for a solar system, as system designer, must first list all the appliances that are expected to be used in the system. For each appliance, find its power and decide the amount of time in hours that it will be used each day. The calculation of daily requirement for each appliance is as follows [5]:
d e
e P T
R (2.6)
dimana;
Re = Daily requirement of one appliance (W h per day) Pe = Power of appliance (W)
2.6 Theory of Heat analysis in Cars Based Solar Radiation
Analysis of the increase of heat in the car is based on the average estimate model sunny days, ASHRAE. General equation for heat increase is [8] :
Qw = As [FIt + U (T0 – Ti)] (2.8)
Where ;
As = Area of the window surface expose to sunlight, ft2
F = Film coefficient of heat transfer
It = Transmitted intensity
U = The average heat transfer coefficient through the window framed = 1.11 Btu/hr.ft2.0F
T0 = Outside temperature, 0F
Ti = Inside temperature, 0F
Equation for area of the window surface expose to sunlight is [8]:
As = ( X-x )( Y-y ) = ( X- Dx tan α ) cos tan
y
D
Y (2.9)
Equation for Film coefficient of heat transfer [8];
F = τ + h u
(2.10)
Where ;
h0 = Heat transfer coefficient for the outer surface of the glass = 1.11 Btu/hr.ft2.0F
19
Light Intensity can be determined by multiply within direct intensity, ID and diffusse intensity, Id as shown in equation (2.11) [8]:
I = ID + Id (2.11)
ID =
sin exp B ACn (2.12) Where ;
Cn = Whether brightness number = 0.9 C = Radiation diffusion factor = 0.122
A = Solar radiation is significant when the air mass equal to zero = 351 Btu/hr.ft2
B = Atmospheric extinction coefficient, which depends on the amount of vapor content in the atmosphere
= 0.201
β = Degrees declined
Id = 2
N SS D C F CI (2.13)
Fss = 2
cos 0 .
1
(2.14)
Where ;
ε = Slope angle of the surface
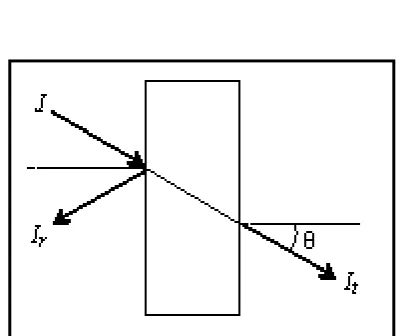
I = τIt
It = Icos θ
[image:32.595.218.419.124.292.2]It = αIcos θ (2.15)
CHAPTER 3
METHODOLOGY
3.1 Introduction
START
PHASE A (PROJECT
STUDY)
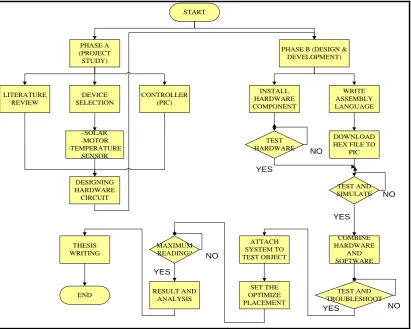
PHASE B (DESIGN & DEVELOPMENT) LITERATURE REVIEW DEVICE SELECTION CONTROLLER (PIC) -SOLAR -MOTOR -TEMPERATURE SENSOR DESIGNING HARDWARE CIRCUIT WRITE ASSEMBLY LANGUAGE INSTALL HARDWARE COMPONENT DOWNLOAD HEX FILE TO
PIC TEST HARDWARE TEST AND SIMULATE COMBINE HARDWARE AND SOFTWARE TEST AND TROUBLESHOOT ATTACH SYSTEM TO TEST OBJECT SET THE OPTIMIZE PLACEMENT MAXIMUM READING?
END RESULT AND
[image:33.595.116.528.348.677.2]ANALYSIS THESIS WRITING YES NO NO YES NO NO YES YES
Figure 3.1 shows the flow chart of the methodology flow for this project. This project is divided into two parts which is phase A and phase B. For project study phase A is where determines the objective, scope and do the literature review. Research and studies of all information from the specific sources are being filtered and simplified in this chapter. It also included the steps of planning and several phases to ensure the project can be working successfully. Further, the selection of appropriate device for this project and is available such as solar panel, blower motor, and temperature sensor. The third part is the system controller. Here, the PIC microcontroller has taken over this task. Further, proceed with designing hardware circuit using Proteus.
23
[image:35.595.207.434.107.760.2]3.2 Project Planning Flowchart
Figure 3.2:Flow Chart of Project Planning START
SUNLIGHT COMPOSE SOLAR ENERGY AND GENERATE ELECTRICITY TO THE SYSTEM
MICROCONTROLLER READ THE INPUT DATA FROM
TEMPEREATURE SENSOR
MICROCONTROLLER PROCESS THE DATA AND DECIDE DESIRE
OUTPUT DATA
DC MOTOR MOVE THE FAN TO BLOWS HOT AIR FROM INSIDE
OF THE CAR
LCD DISPLAY SHOWING THE TEMPERATURE, SOLAR VOLTAGE, BATTERY VOLTAGE
AND MOTOR STAGE
DO ANALYSIS, PLOTTING GRAPH AND COMPARING THE DATA
Figure 3.2above shows the flow of the project planning for this system. Since the solar panel as the main part of this system, the sun must emit the light so this system can be operated. This solar panel is connected directly to the voltage regulator to obtain an output of 5 volts as require by the microcontroller PIC16F877A.This system cannot be operating at night and during raining day. The battery charge was used as a backup power supply in this project to ensure the project keep running in circumstances where there is no sunlight. This project works in two systems which are in the Manual mode and Automatic mode.
Manual mode is, when LM 35 temperature sensor detects the temperature rise, it will send the data to the microcontroller. Microcontroller will process the data and send digital signals to the ventilation motor circuit. The speed of motor has been programmed by the microcontroller to function according to the stage-set temperature levels in the program. There are five levels of motor speed which is the first level is set to a temperature of 30°C, the second level temperature was set to 35°C, the third level temperature was set to 40°C, the fourth temperature set to 50°C and the fifth temperature set to 60°C. Motor speed is controlled by using Pulse Width Modulation (PWM). Then the Liquid Crystal Display will display the outputs of temperature readings, the motor speed level, solar voltage and battery voltage. After that, the data has been recorded for the purposes of analysis.
67
REFERENCES
[1] Khan M.U, "Development of Ventilation Technique To Limit The Car Cabin Temperature Under a Blazing Sun," Universitoy f Toyama, Jepun, 1999. [2] Bjorn jenssen wachenfeldt, Mads Mysen, Peter G. Schild., "Air Flow Rate
and Energy saving potential in schools with Demand Controlled
Displacement Ventilation," , New York, United Stated Of Amarica, 2006, pp. 1073-1079.
[3] Maurizio, C. and Centro, R. F, ”Thermal Climate In Cab And Measurement Problems”. (1999).
[4] Mohd Rasidi Md Radzi, "Automatic Ceiling Fan Using PIR Sensor," Universiti Tun Hussein Onn Malysia, Batu Pahat, 2009/2010.
[5] Simon Roberts, Solar Electricity : A Practical Guide to Designing and Installing small Photovoltaic System, 1st ed. Prentice Hall International (UK) Ltd, United Kindom: Printed in Great Britain at the Universiti Press,
Cambridge, 1991.
[6] John L. Alden And John M. KAne, Design Industrial Ventilation System. New York, United States of America: Industrial Press, 1982.
[7] Frank P.Bleier, Fan Handbook : Selection, Application and Design. United States of Amarica, 1998.
[8] S P Sukhatme, Solar Energy : Principle of Thermal Collection And Storage, 2nd ed. Mumbai, India, 1996.
[9] Ryan Mayfield, Photovoltaic Design & Installation For Dummies. Canada, 2010
[10] McKay, B. J. R. "Use Of Solar Photovoltaic Powered Fans To Reduce Peak Temperatures In Outdoor Cabinets," Morristown, New Jersey: IEEE.
[12] M. Amir Abas, M Hilmi Fadzil S, Et al, Control, "Improved Structure of Solar Tracker with Microcontroller based Control," in 2010 Second International Conference on Advances in Computing, Control, and
Telecommunication Technologies: 2010 IEEE, 2010.
[13] Ph.D.,Wahab Almuhtadi, P.h.D. Abdul Al-Azzawi, "Energy Saving by Using Newly Designed Automated Solar," in 2009 IEEE Electrical Power & Energy Conference, Ottawa, Ontario, Canada, 2009, pp. 1- 4.
[14] Bor-Jang Tsai, "Active building envelope system (ABE): Wind and solar-driven ventilation, electricity and heat pump," in Energy and Sustainable Development: Issues and Strategies (ESD), 2010 Proceedings of the International Conference on, Hsinchu, Taiwan, 2-4 June 2010, pp. 1- 10. [15] Nurhani Kasuan, Mohd Hezri Fazalul Rahiman, Mohd Nasir Taib. Nurul
Nadia Mohammad, "Steam Temperature Control Using Fuzzy Logic," in
Control and System Graduate Research Colloquium (ICSGRC), 2011 IEEE,
Univ. Teknol. MARA, Shah Alam, Malaysia, 2011, pp. 53 - 58.
[16] Tzu-Ming Wang, "Energy Saving of Air Condition using Fuzzy Control," in Advanced Information Networking and Applications Workshops (WAINA), 2010 IEEE 24th International Conference on, TamKang Univ., Tamsui, Taiwan, 2010, pp. 1005 - 1010,
[17] LM34/LM35 Precision Monolithic Temperature Sensors. [Online].
http://www.ti.com/general/docs/lit/getliterature.tsp?literatureNumber=snoa748b &fileType=pdf
[18] Ammar Hashim, Ariffuddin Joret Asmarashid Ponniran, "A Design Of Low Power Single Axis Solar Traking System Regardless Off Motor Speed," International Journal of Integrated Engineering, vol. 3 No 2, pp. 5-9, 1 March 2011.
[19] H.P. Garg and J. Prakash (1997), “Solar Energy Fundamentals and Application.”, 1st
Edition, New Delhi, The McGraw-Hill Companies, Inc. [20] D.H.W. Li, T.N.T Lam, V.W.C Chu. (2008). relationship between tha total solar on titled surfaces and the sunshine hours in Hong Kong. 1221-1227. [21] C.J Coffey, G.R Hunt. (2006). Ventilation effectiveness measures based on
heat removal. 2249-2262
[22] ASHRAE. (1993). Physiological Principles, Comfort and Health. Handbook of Fundamentals, (ASHRAE, Atlanta).
[23] Laman Web: http:// www.solar4power.com: katalog komponen.
[24] Farnell Components (M) Sdn. Bhd. (2002). “The Farnell Catalogue.” Petaling Jaya, Selangor Darul Ehsan: Katalog komponen
[25] A.Cengel, Y. (2006). Heat and Mass Transfer. New York: McGraw Hill. [26] Gopal. (1998). Control System Principles And Design. Delhi India: Tata
69
[27] L.michalski, K. J. (2001). Temperature Measurement 2nd edition. London: Wiley.
[28] D.McGee, T. (1988). Principles And Methods Of Temperature Measurement. Canada: Wiley Interscience Publication.
[29] D.H.W. Li, T.N.T Lam, V.W.C Chu. (2008). relationship between tha total solar on titled surfaces and the sunshine hours in Hong Kong. 1221-1227. [30] C.J Coffey, G.R Hunt. (2006). Ventilation effectiveness measures based on