Sliding bubble dynamics and the effects on surface
heat transfer
B Donnelly1,2, A J Robinson3, Y M C Delaur´e4 and D B Murray3
1Thermal Management and Eco-sustainability Research Group, Bell Labs Ireland,
Blanchardstown Industrial Park, Dublin 15, Ireland.
3School of Engineering, Trinity College Dublin, Dublin 2, Ireland. 4
School of Mechanical and Manufacturing Engineering, Dublin City University, Glasnevin, Dublin, Ireland.
E-mail: [email protected]
Abstract.
An investigation into the effects of a single sliding air bubble on heat transfer from a submerged, inclined surface has been undertaken. Existing literature has shown that both vapour and gas bubbles can increase heat transfer rates from adjacent heated surfaces. However, the mechanisms involved are complex and dynamic and in some cases poorly understood. The present study utilises high speed, high resolution, infrared thermography and video photography to measure two dimensional surface heat transfer and three dimensional bubble position and shape. This provides a unique insight into the complex interactions at the heated surface. Bubbles of volume 0.05, 0.1, 0.2 and 0.4ml were released onto a surface inclined at 30 degrees to horizontal. Results confirmed that sliding bubbles can enhance heat transfer rates up to a factor of 9 and further insight was gained about the mechanisms behind this phenomenon. The enhancement effects were observed over large areas and persisted for a long duration with the bubble exhibiting complex shape and path oscillations. It is believed that the periodic wake structure present behind the sliding bubble affects the bubble motion and is responsible for the heat transfer effects observed. The nature of this wake is proposed to be that of a chain of horseshoe vortices.
1. Introduction
There has been much progress in recent years in the study of the fluid flow and surface heat transfer enhancement both adjacent to and downstream of sliding bubbles. This has been aided by advancements in high speed video systems, fluid flow measurement devices and high speed infrared thermography. The development of these devices has allowed researchers to observe complex fluid flow close to the bubble interface and in the wake and observe how this affects bubble shape and motion. This information can be coupled with simultaneous measurement of the two dimensional, dynamic surface heat transfer. Through simultaneous measurement of these phenomena, the complex, high speed interactions can be studied in unprecedented detail. The following literature review describes the developments in this field and highlights major advancements. Much of the work leading up to the investigation of sliding bubbles concerned
2
free rising bubbles and falling drops and particles. An excellent review of this literature can be found in Clift et al. [1].
An early study by Cornwell [2] investigated the influence of bubbly flow on boiling from a tube in a heat exchanger tube bundle. It was postulated that heat transfer enhancement on the downstream tubes was caused by bubbles within the flow sliding around the tube. The work was later extended to include air bubbles (Houston & Cornwell [3]) under similar conditions, revealing that bubble induced turbulence is a prominent mechanism in heat transfer. This work highlighted the need for further investigation into the complex interactions between fluid flow, bubble dynamics and surface heat transfer.
Maxworthy [4] performed an investigation into the dynamics of sliding air bubbles. Plan and side view photographs were obtained for different sized bubbles at various angles. A theoretical analysis of terminal velocity based on the methods of Davies & Taylor [5] was developed that corresponded well with experimental results. This provided important information on the terminal velocity and shapes of sliding bubbles.
Kenning & Yan [6] investigated sliding vapour bubbles under plane and curved surfaces while Cornwell & Grant [7] investigated heat transfer due to vapour bubbles in water and a refrigerant under a horizontal tube. The three main contributions to heat transfer were identified as nucleation, micro-layer evaporation and liquid disturbance. Tsao & Koch [8] provided details on the dynamic motion of bubbles in the first few moments after impacting on an inclined surface and Yan et al. [9] presented a study on sliding and sticking vapour bubbles under inclined plane and curved surfaces. Their study highlighted the existence of an evaporating liquid microlayer between the vapour bubble and the surface.
Atmane & Murray [10] studied the effect of liquid motion induced by air and vapour bubbles on heat transfer from a cylinder. They used a heated copper cylinder as the test surface and a hot film sensor to measure the fluctuating heat flux. It was found that during nucleate boiling heat transfer was highest on the upper part of the cylinder due to bubbles sliding around after nucleating on the lower parts of the cylinder. The heat transfer was enhanced on the lower parts of the cylinder by injecting bubbles from below. Heat transfer enhancement was found to be mainly due to liquid agitation by the bubble wake.
Experimental work by Veldhuis [11] provides an excellent insight into the wake behaviour behind bubbles and solid spheres in ultra pure and tap water. The schlieren technique employed reveal two counter-rotating vortex filaments that roll up to form horseshoe vortices. In tap water, the vortex shedding frequency correlated well with the frequency of velocity oscillations. Mougin & Magnaudet [12] and Magnaudet & Mougin [13] provide numerical results on the wake and path instabilities behind rising bubbles. Although the model uses a ‘solid’ bubble, the results agreed well with experiments where particular caution has been take to remove surfactants such as those performed by Zenit & Magnaudet [14].
An experimental study of the flow pattern and heat transfer associated with a single vapour bubble sliding on a downward facing heated surface was presented by Qiu & Dhir [15]. Holographic interferometry was used to measure the fluid temperature in a plane parallel to the bubble flow direction and perpendicular to the heater surface. This highly detailed study into the bubble wake demonstrated that vortical structures in the wake can enhance heat transfer from the wall by bringing cooler liquid in from the bulk. Bayazit et al. [16] also postulated that small-scale vortices shed from the extremes of the bubble were the main contribution to heat transfer. Delaur´e et al. [17] performed a simultaneous PIV and heat transfer study of a single air bubble interacting with natural convection from a copper block at various angles. The heat transfer coefficient was found to respond closely to changes in flow velocity and fluctuations in the fluid temperature, both caused by the bubble’s motion.
few). The work presented in this paper extends the current state of the art by examining the complex interactions between the bubble, fluid and heated surface. Simultaneous, high speed, high resolution recordings covering the full bubble event coupled with computer aided image analysis has allowed a detailed description of the sliding bubble phenomenon. The work builds on previous work by the author presented in [22], [23], [24] and [25].
2. Experimental apparatus and analysis
The experimental apparatus consists of a tilting water tank, a heated thin foil and support structure, a bubble injector, visual cameras and lighting, the infrared camera and a trigger system. The water tank is an open top cube measuring 420×420×420 mm3. It is assembled from 6 mm thick plate glass bonded together with silicone adhesive. The tank is filled with filtered tap water and no effort has been made to remove surfactants. As such, the bubble interface should approximate a zero-slip boundary condition. Comprehensive details on the experimental apparatus and analysis can be found in [24].
The bubble injector incorporates an infusion pump, silicone tubing, a 0.5mmdiameter needle and syringe, a small inverted aluminium cup, a connecting arm and release cables. This design was chosen as it allows the user to release a bubble of desired volume on demand while minimising disturbances to the bulk fluid. The infusion pump supplies air to the inverted cup via the needle and the user pulls the release cable, this rotates the inverted cup to release the bubble onto the surface.
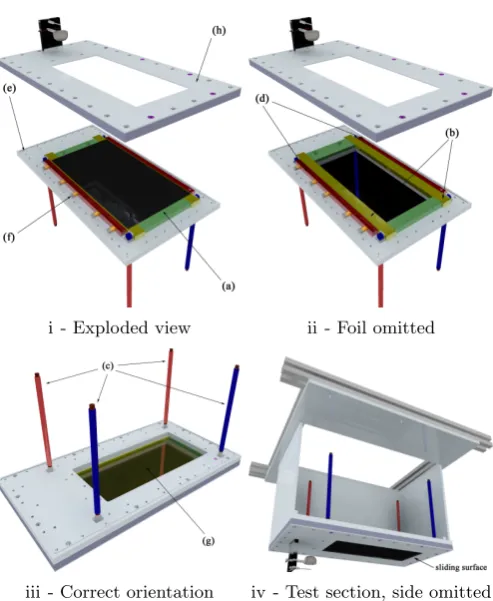
Figure 1 shows the assembly of the heated surface. The surface consists of a 25 µm thick, 130×170mm2 AISI 321 stainless steel foil manufactured by Goodfellow. This is bonded to two copper bars measuring 10×20×170mm3using silver based electrically conductive glue (Loctite 3888 silver infused epoxy). The glue is applied along the 20×170 mm2 copper surface using a paint brush. One of the bars forms part of the foil tensioning device. On the reverse side of the foil is a window made from infrared transparent sapphire glass. This sits on a ledge 3 mm behind the foil, trapping a small quantity of air that acts as an IR transparent insulator thus ensuring the majority of the heat generated goes into the water. A thermocouple is inserted into the air gap to measure the temperature close to the sapphire window in order to quantify the heat loss from the rear of the foil.
Two, synchronised NAC Hi-Dcam II high speed digital video cameras (recording at 250
fps, 0.002 s exposure) are used to record bubble motion. The cameras are each mounted on traversing platforms to allow fine adjustment of their position. The platforms are mounted to steel support structures that allow three dimensional positioning within a certain region. The support structures are mounted directly to the tilting tank as illustrated in Figure 2. The cameras are fitted with NikonNikkor 50mmf/1.4 af-d lenses. These lenses were chosen as they have extremely low distortion so as not to deform the bubble image. Illumination of the test area is provided by light emitting diode (LED) strips as it was found that incandescent bulbs flooded the test area with infrared radiation which increased the foil temperature. Two are positioned pointing through the tank at the slave camera, the other six are positioned around the master camera pointing directly at the heated surface.
A FLIR SC6000 infrared camera was used to measure surface temperature on the rear of the foil, each pixel recording an area measuring approximataly 0.5 × 0.5 mm2. The camera has a 640×512 pixel focal plane array (FPA) sensor set to record at 250 fps to match that of the visual cameras. The camera is mounted onto a frame that mounts directly to the tilting tank to ensure image consistency at all inclination angles. The foil is coated in a 15 µm thick layer of black paint in order to increase emissivity, measured using a precision callipers.
i - Exploded view ii - Foil omitted
[image:4.595.84.331.105.406.2]iii - Correct orientation iv - Test section, side omitted
Figure 1: Heated surface assembly. Highlighted are (a) the steel foil (the heated surface), (b) copper bars, (c) power supply cables, (d) bus bar mounts, (e) support structure, (f) tensioning device, (g) sapphire window and (h) stainless steel sheet. Image (iv) includes the bubble injection system.
Figure 2: Illustration of the full experimental apparatus inclined at 30◦. Highlighted are (a1) the master and (a2) the slave visual cameras, (b) high intensity lighting, (c) positioning system (×2) and (d) infrared camera.
velocity. This is performed for images from both cameras and the results scaled and combined to reveal the shape in two planes and the position in three dimensions. For the 0.05 and 0.1
ml cases, the bubbles are approximately spherical so the two views are combined into a three dimensional representation of the bubble. This is not currently possible for larger bubbles due to their high eccentricity. Sequences of images are analysed to reveal the time varying bubble characteristics.
The temperature data from the infrared camera are calibrated and processed to remove distortion caused by the lens. The data are corrected to account for conduction losses to the air gap, radiation from both sides of the surface, lateral conduction effects and thermal storage effects. The effects of the layer of paint are included in this analysis. The results from the thermal and visual cameras are temporally and spatially combined providing accurate visualisation of the position and shape of the bubble relative to heat transfer variations on the foil. The method of temperature measurement used in these experiments assumes no temperature gradient through the thickness of the foil. This assumption is validated by calculating the time constant of both the foil and paint layer (τ =δ2ρC
p/k) and comparing it to the exposure time of the IR camera. The heat transferred to the fluid for an element of foil measuringdx×dx×δ is calculated from
[image:4.595.382.519.123.410.2]The heat generated in one element of foil isqgen =vel×IelwhereIelis the current andvelis the voltage drop. The lateral conduction in both the foil and paint isqlc =−4dx kssδ2ss+kpδp2
∇2T
where kss, kp, δss and δp are the stainless steel and paint thermal conductivity and thickness. The change in stored thermal energy is given asqcap= (msscp,ss+mpcp,p)dTdt wheremss, cp,ss, mp and cp,p are the mass and specific heat capacity of the foil and paint respectively and dTdt is the temperature change with time. Heat transfer due to conduction to the air behind the foil is calculated as qcd = −kairdx2dTdz where kair is the thermal conductivity of air and dTdz is the temperature gradient across the air gap. The radiation exchange at the front and rear of the foil was estimated and found to be negligible.
3. Results & Discussion
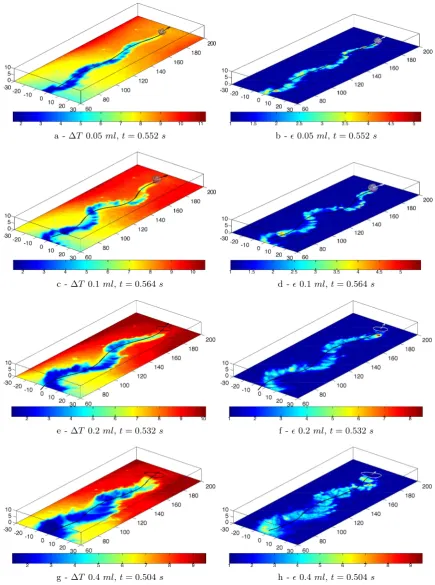
Results are presented of the temperature difference between the surface and bulk fluid (∆T) and of the heat transfer coefficient enhancement factor (), defined as the ratio of the bubble enhanced heat transfer coefficient to that of natural convection. Figure 3 presents results for bubble volumes of 0.05, 0.1, 0.2 and 0.4 ml , each sub figure is overlaid with the velocity vector and bubble path. The bubble boundary is superimposed on the images along with the approximate bubble base shape. The 0.05 and 0.1 ml images also include the three dimensional bubble representation. In all cases the bubble is travelling from left to right leaving a cooled region in the wake that evolves over time. A sinusoidal path of varying amplitude oscillating at approximately 3 Hz was observed for all volumes although the bubble velocity increased with increasing volume. There is no heat transfer enhancement detected in the region between the bubble and surface for all volumes. Enhancement effects were found to last a long duration, not returning to natural convection levels for approximately 20 to 30 seconds depending on volume. Before the bubble is released onto the surface, there is a natural convection plume generating a surface temperature gradient along the inclined surface. This results in a gradient in the natural convection heat transfer coefficient varying from approximately 400 to 700 W/m2K from bottom to top of the test section. The bulk fluid temperature is maintained at 26◦C.
Figure 3 (a) and (b) show results for the 0.05 ml bubble at t = 0.552 seconds; the time refers to the time elapsed from when the whole bubble enters the test section. The bubble is travelling at an average velocity of |v|= 175mm/sfluctuating by approximately 3 mm/swith a maximum path amplitude of approximately 3mm. Computer analysis of the high speed video images reveals that the bubble shape remains fairly constant over the length of the test section with small changes in the orientation (±10◦) and very little change in eccentricity which remains constant at approximately 0.55. Orientation refers to the tilt of the bubble’s major axis relative to the x-axis in the x-y plane measured in degrees. Eccentricity refers to the elongation of the bubble’s major axis and is defined as the ratio of the distance between the foci and the major axis length of an ellipse matched to the bubble shape. The mean bubble diameter is 6mmand the volume corresponds to a spherical equivalent diameter of 5.5 mm.
Immediately apparent from Figure 3 (a) and (b) is the close relationship between the bubble’s motion and heat transfer enhancement in the wake. A cooled region slightly narrower than the width of the bubble can be seen very close to the downstream end of the bubble base. The cooled region expands to approximately three times the bubble width within half a second, elevating heat transfer in small regions to an enhancement factor of 5 with most of the region above a factor of 2. There is a notable periodicity to the wake as revealed by the cooling pattern. For each half wave of path oscillation there is a corresponding region of elevated cooling that travels outwards at an angle away from the path centre. Although the foil to bulk fluid temperature difference is small, the heat transfer coefficient is elevated sufficiently to maintain the high heat transfer rates.
a - ∆T 0.05ml,t= 0.552s b -0.05ml,t= 0.552s
c - ∆T 0.1ml,t= 0.564s d -0.1ml,t= 0.564s
e - ∆T 0.2ml,t= 0.532s f -0.2ml,t= 0.532s
[image:6.595.79.515.111.697.2]g - ∆T 0.4ml,t= 0.504s h -0.4ml,t= 0.504s
path amplitude of 6mm. The bubble velocity increases with volume, however so does the path length in this case due to the larger oscillation amplitude; this results in the bubble traversing the test section in roughly the same time as the 0.05 ml bubble. The increase in volume results in a higher mean eccentricity of 0.62 with noticeable fluctuations of ±0.15 coinciding with an orientation fluctuation of ±25◦. The mean bubble diameter is measured as approximately 8 mmand the volume corresponds to a spherical equivalent diameter of 7 mm.
The amplified oscillations have a noticeable effect on heat transfer. Small regions in the wake show heat transfer levels close to a factor of 6 times higher than natural convection levels with most of the enhancement region exceeding a factor of 2.5. Once again the heat transfer patterns follow a sinusoidal shape matching the bubble’s path. The enhancement area closely matches the bubble width at its rear and widens downstream of the bubble. As time elapses there are large regions of elevated heat transfer coinciding with each half oscillation of the bubble i.e. when the bubble changes direction large regions of enhanced cooling emanate from behind the bubble.
Figure 3 (e) and (f) show the 0.2ml bubble. The three dimensional bubble representation is not presented for this or the 0.4 ml bubble due to the strong change in orientation affecting the bubble projection as previously discussed. Results instead show a plan view outline of the bubble obtained from the master camera. As is apparent from the figure, the bubble is becoming noticeably elongated. The mean eccentricity has increased to 0.8 with fluctuations of
±0.05 coinciding with an orientation change of±25◦. The mean bubble diameter is measured as approximately 10 mmand the volume corresponds to a spherical equivalent diameter of 8.8 mm. The mean velocity has increased to around |v| = 200 mm/s fluctuating sinusoidally by approximately 7mm/s; the maximum path amplitude is in the region of 6mm. Observation of the moving bubble reveals a periodic shape change as it oscillates. This appears as a bulge at the rear left or right of the bubble at its maximum displacement from the mean path depending on whether the bubble is positioned left or right of centre.
Enhancement factors continue to rise exceeding 8 in small regions immediately behind the bubble with a broad region where the enhancement factor exceeds 4. The enhancement area is approximately the width of the bubble at the rear but extends to around twice the width downstream. The elevation in the heat transfer coefficient persists for a long duration and still exceeds a factor of 3 after 2 seconds. The bulging of the interface is closely linked with the appearance of cooled regions in the wake.
Figure 3 (g) and (h) show the 0.4ml bubble. The bubble is noticeably larger and becoming more elongated. Observation of the shape fluctuations over time show similar effects to those of the 0.2 ml bubble. There is a clear bulging of the bubble rear synchronised with the path oscillations and regions of elevated heat transfer but now the shape changes are much more pronounced. A region of high curvature appears on the bubble interface and disappears moments before the regions of elevated heat transfer appear; this occurs on the rear of the bubble alternating between the left and right sides depending on whether the bubble is travelling left or right. The mean eccentricity is 0.9 with small fluctuations of about±0.2 coinciding with an orientation fluctuation of ±25◦. The path amplitude is approximately 6mm. The orientation fluctuations, oscillation frequency and path amplitude are very similar for the 0.1, 0.2 and 0.4
ml bubbles however the eccentricity, velocity and maximum enhancement factors change. The mean velocity has increased to around 210mm/s, sinusoidally fluctuating by around±15mm/s. The average width of the bubble is 16 mmcorresponding to a spherical equivalent diameter of 11 mm.
4. Conclusions
It has been confirmed that sliding bubbles greatly enhance heat transfer from adjacent heated surfaces. Enhancement factors as high as 9 have been observed in small pockets behind the 0.4
ml bubble. The cooling affects large areas relative to the bubble size and persists for a long duration. There is a periodic nature to the motion of the bubble, observed through path and velocity oscillations, shape oscillations and changes in orientation. Increasing the volume leads to an increase in the bubble velocity but appears to have little effect on the path oscillation frequency.
There is a corresponding periodic nature to the heat transfer enhancement effects observed. Regions of elevated cooling emanate from the rear of the bubble during each half oscillation and travel outwards away from the path centre. It is most likely that these are hairpin vortices shedding from the rear of the bubble. These affect both the shape of the bubble and its motion and ultimately contribute to elevated heat transfer. It is assumed that the growth in strength of these vortices just before detachment cause the bulging of the bubble interface. Vortices have been noted by other authors in the wake of sliding bubbles (Qiu & Dhir [15]) and are known to remain coherent for long durations, possibly explaining the duration of the heat transfer effects observed in this study.
In order to confirm the assumptions made about the fluid structures the next step is to perform flow visualisation in planes both perpendicular and parallel to the surface. This is expected to reveal the true nature of the fluid structures in the wake.
Acknowledgements
The authors would like to acknowledge the financial support of Science Foundation Ireland under grant number ENM2151 and the Industrial Development Agency (IDA) Ireland funding towards Bell Labs Ireland.
References
[1] Clift R, Grace J R and Weber M E 1978Bubbles, Drops and Particles(Academic Press) [2] Cornwell K 1990International Journal of Heat and Mass Transfer332579–2584
[3] Houston S D and Cornwell K 1996International Journal of Heat and Mass Transfer 39211–214 [4] Maxworthy T 1991Journal of Fluid Mechanics 229659–673
[5] Davies R M and Taylor G 1950 Proceedings of the Royal Society of London. Series A, Mathematical and Physical Sciences 200375–390
[6] Kenning D B R and Yan Y Y 1996International Journal of Heat and Mass Transfer 393117–3137 [7] Cornwell K and Grant I A 1998International Journal of Heat and Mass Transfer 411189–1197 [8] Tsao H and Koch D L 1997Physics of Fluids 944–56
[9] Yan Y Y, Kenning D B R and Cornwell K 1997International Journal of Refrigeration 20583–591 [10] Atmane M A and Murray D B 2005International Journal of Heat and Mass Transfer 481084–1095 [11] Veldhuis C 2007Leonardo’s Paradox Ph.D. thesis University of Twente
[12] Mougin G and Magnaudet J 2001Phys. Rev. Lett.88(1) 014502
[13] Magnaudet J and Mougin G 2007Journal of Fluid Mechanics 572311–337
[14] Zenit R and Magnaudet J 2009International Journal of Multiphase Flow 35195 – 203 [15] Qiu D and Dhir V K 2002Experimental Thermal and Fluid Science 26605–616
[16] Bayazit B B, Hollingsworth K and Witte L C 2003Journal of Heat Transfer 125503–509
[17] Delaur´e Y M C, Chan V S S and Murray D B 2003Experimental Thermal and Fluid Science 27911–926 [18] Perron A, Kiss L I and Poncs´ak S 2006International Journal of Multiphase Flow 32606–622
[19] Podvin B, Khoja S, Moraga F and Attinger D 2008Chemical Engineering Science 631914–1928 [20] Li X, Hollingsworth D K and Witte L C 2007Experimental Thermal and Fluid Science 32529–544 [21] Thorncroft G E and Klausner J F 1999Journal of Heat Transfer 12173–79
[22] Donnelly B, O’Donovan T and Murray D 2008Applied Thermal Engineering 21319–1326 [23] Donnelly B, Murray D and O’Donovan T 2009Journal of Enhanced Heat Transfer15159–169
[24] Donnelly B 2011The Effects of a Sliding Air Bubble on Heat Transfer from an Inclined SurfacePh.D. thesis Trinity College Dublin