Characterization of Temporal Changes in Rainfall,
Temperature, Flooding Hazard and Dry Spells over
Zambia
Lydia Mumbi Chabala
1,*, Elias Kuntashula
2, Peter Kaluba
11Department of Soil Science, University of Zambia, School of Agricultural Sciences, P.O. Box 32379, Lusaka, Zambia 2Department of Agricultural Economics, University of Zambia, P.O. Box 32379, Lusaka, Zambia
*Corresponding Author: [email protected]
Copyright © 2013 Horizon Research Publishing All rights reserved.
Abstract
Zambian rural communities are vulnerable to climate change because most farmers depend on rainfed agriculture. While efforts on adaptation are being spearheaded, information on the extent of climatic shifts and occurrence of extreme climatic events is limited. Therefore, a study was undertaken to assess changes in climatic variables of rainfall and temperature in Zambia’s Agro-ecological zones. The objective of the study was to assess the extent of change in rainfall and temperature and to ascertain the occurrence pattern of extreme climatic events. Daily climatic data records were obtained from the Meteorological department in Zambia. Time series plots were prepared for trend detection in the inter-annual mean rainfall and temperature. A five year moving average was used to obtain the regression equations. Floods were defined to extremes greater than 40 mm in a day and to obtain their return period (T) in year, the cumulative probabilities, F, was transformed by using T=1/(1-F) or T = 100/(100-P) for percentages. A distribution free approach was fitted for estimation of return periods of dry spells in cases where rainfall totals may be zero. Results among the five stations (Choma, Petauke, Mpika, Serenje and Chipepo) considered, indicated that mean temperatures had an increasing trend which was statistically significant only for Choma district. Rainfall trends were variable with some stations (Mpika and Chipepo) showing increasing trends while others (Petauke and Serenje) showing decreasing trends. Floods were frequent in all stations analysed from January to March rather than October to November. Dry spell of 4 days duration were much more frequent than those of 7 and 10 days. Choma was found to be the most susceptible to dry spells while Mpika was the least affected. The study further revealed that the optimal planting widow was the last week of November up to the first week of December for rainfed crop production.Keywords
Dry Spells, Floods, Return Periods1. Introduction
The inter-annual and seasonal rainfall variability are key factors in the success of agriculture production. This is particularly true for Zambia where more than 60% of the staple food crop maize is produced by small scale farmers under rain fed conditions. This has been acknowledged by the Zambia National Adaptation Programme of Action (NAPA) which highlights that Zambian communities are vulnerable to climatic hazards mainly droughts and flooding. Therefore knowledge of temporal changes in rainfall and associated extreme events is essential for successful crop production.
Droughts (dry spells) and floods are extreme climate events that percentage-wise are likely to change more rapidly than the mean climate [23]. Wilhite and Buchanan-Smith [26] described these extreme climate events to be among the world’s costliest natural disasters. With over 70 % of farmers relaying on rainfed agriculture in sub Sahara Africa, any changes in rainfall distribution is disastrous for crop production [3]. Sivakumar [18] reported that the success or failure of a crop depends more on the distribution of rainfall over the growing season rather than on the total rainfall in that period. Thus, many authors have attributed long dry spells within a season and shorter rain seasons as the major contributing factors to low yields [16, 3]. Although it is not possible to influence timing and amount of rainfall [20], knowledge of their frequency for a variety of durations is imperative, if they are to be well managed [12].
further increase the outbreak of plant and livestock diseases. Therefore from the socioeconomic stand point, knowing the frequency of dry spells and floods would help the farmer to prepare not only when to time various farming activities but to also adopt and/or adapt certain strategies that could reduce the risks associated with such eventualities. Such strategies might include early (or late) planting, adopting early maturing varieties among others.
Despite the perceived and actual damaging effects of rainfall variability in Zambia, studies on long term changes in seasonal rainfall and accompanying extreme events such as floods and dry spells are limited. Further, no dry spell characterization has been done for the country. This paper therefore discusses the temporal variability of precipitation and temperature and the characterization of dry spells and flooding hazards in selected districts of the three agro-ecological regions of Zambia.
The objectives of this study were to: (i) ascertain the long term trends in precipitation and temperature in the selected districts of Zambia. (ii) characterize dry spells and extreme rainfall events in the selected areas; (iii) establish the recurrence intervals of dry spells and extreme rainfall of selected magnitude; and (iv) Establish the onset of the rain season and optimal time for planting.
2. Materials and Methods
2.1. Study Area
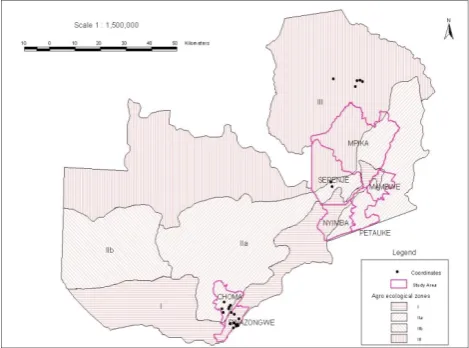
The selected study areas were Serenje, Mpika, Choma, Petauke districts and Chipepo located near Sinazongwe district in Zambia. The selected study sites represented the three Agroecological Zones (AEZ) of Zambia as shown in figure 1. Serenje and Mpika are located in Agroecological Zone III while Choma and Petauke are located in Agroecological zone II. Chipepo (represented Sinazongwe district) is located in Agroecological zone I.
Serenje and Mpika are two adjacent districts on Northern side of Zambia located at approximately 15.8° E and 27.7° S with elevations of more than 1000 m. The mean annual precipitation is ranges from 1000 – 1200 mm and the growing season is more than 120 days. The daily mean temperatures range from 12 °C to 29 °C. About half of the area represented by the two districts is a plane plateau while some parts are hilly with an escarpment known as Muchinga transcending the two districts.
Choma and Chipepo are in Southern Zambia. Choma lies on a plane plateau with an elevation of about 1200 m above sea level and located around 27.1° E and 16.8° S. The mean annual precipitation is from 750 – 1000 mm with a growing season of 90 to 120 days. The daily mean temperatures range from 18°C to 22°C and the maximum temperatures are usually less than 30°C. Chipepo is in region I and lies between 300 m and 900 m above sea level and is located at 27° 45" E and 15° S. It has a mean annual precipitation of 600 – 800 mm and a growing season of 90 days. The daily
mean temperatures vary from 20 °C to 25°C. During summer, actual temperatures go as high as 40°C.
[image:2.595.313.548.178.352.2]Petauke is in Eastern Zambia and has a mean annual precipitation that ranges from 750 – 1000 mm. The growing season is 90 to 120 days. The daily mean temperatures range from 18°C to 22°C and the maximum temperatures are usually less than 30°C. The elevation ranges from 1000 -2000m above sea level.
Figure 1. Location of study sites, note Chipepo located on the south eastern border near Sinazongwe
2.2. Data
Station data for rainfall and temperature for five stations (Serenje, Mpika, Petauke, Choma, Chipepo) were acquired from the Zambia Meteorological Department. Data quality assessment was done as a preliminary step in screening and preparing data for analysis. Data consistency checks for both temperature and rainfall were done by plotting box plots in order to detect outliers. Values of the suspected outliers were compared with the daily values and also with the values of corresponding period from nearby stations or the standardized values of stations belonging to the same physiographic zone. The values were only discarded if a mismatch was detected through both criteria, and the gaps were filled up by the normal ratio method using data from nearby stations [5]. Further quality assessment for rainfall data was done as described below.
of the number of sites in a region, since larger regions have more sites thus a larger value of Di. Although Hosking and Wallis [6] suggested a Di criterion of at least less than 3, this may not be satisfactory for small regions.
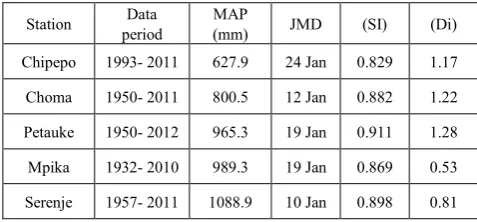
Table 1. Station catalog with their site characteristics
Station period Data (mm) MAP JMD (SI) (Di)
Chipepo 1993- 2011 627.9 24 Jan 0.829 1.17
Choma 1950- 2011 800.5 12 Jan 0.882 1.22 Petauke 1950- 2012 965.3 19 Jan 0.911 1.28 Mpika 1932- 2010 989.3 19 Jan 0.869 0.53 Serenje 1957- 2011 1088.9 10 Jan 0.898 0.81
The JMD and SI are based on circular statistics which yields an average day of occurrence, same as the arithmetic mean for dates while the SI is like the standardized measure of variation. The SI takes values between 0 and 1, with values near 0 indicating a wide variation in the time of the year while those closer to 1 symbolize a smaller variation in time of occurrence [15, 24]. The Seasonality index (SI) was very close to 1 for all the stations, implying the rainfall is concentrated within a few months rather than being uniformly distributed throughout the season. The higher similar range of values of SI among all the stations further shows that the rainfall formation processes for the selected stations is the same [12]. This is confirmed by Thurlow et al., [21] and numerous studies who have reported of the rains being brought by the inter-tropical convergence zone which is located north of the country in the dry season and it moves southwards and northwards in the first half of the year.
2.3. Processing of Temperature and Rainfall Data
Further analysis of climatic data was accomplished in Instat software. Instat is a simple general statistics package that also includes a range of special facilities to simplify the processing of climatic data. A detailed description of the Instat software and procedures used in this study was documented by Stern et al., [19]. Time series plots were prepared to explore long term trends in the seasonal rainfall and minimum and maximum temperatures at the five stations for the length of the data period. A five year moving average was used to obtain regression equations. The use of a five year moving average was employed to smooth out short-term variability in the annual data and thus clearly highlight the long term trends in the climatic pattern [17]. Further analysis of rainfall focused on extreme events, start of the season and optimal planting date, and dry spell characterization.
2.4. Extreme Rainfall Events
Following consultations with meteorologists and agriculture experts, an amount of 40 mm per day was set as the lower limit for rainfall amounts that could cause problems for the country. Instat software saved this value in
each year, together with the day number in the year when it occurred such that overtime, the period of the year associated with heavy rainfall was established to be fluctuating or constant. To obtain return periods, a percentage was fixed on the y-axis and a corresponding value read from the x-axis. Meanwhile an amount of rainfall was fixed on the x-axis and read the percentage of years in which the amount of rainfall was higher or below this value. The graph indicated when in the year the maximum rainfall occurred. With the extremes generated, a cumulative frequency curve (which is a good way to show different percentage points or return periods) was fitted to produce reoccurrence interval graphs for the different stations. To obtain the return period T in year, the cumulative probabilities, F, were transformed by using T=1/(1-F) or T = 100/(100-P) for percentages.
2.5. The Start of the Season and Planting Dates
The start of the season was analysed based as the first occasion with more than 20 mm rainfall in a 2 day period after 15 th November and no dry spell of 10 days or more within the following 30 days [19]. A condition of dry spell lengths for 4 successive 30 day periods after sowing, i.e. the first period in days 1 to 30 of the crop, was the one required to be met in order to establish the optimal planting dates in each of the stations.
2.6. Dry Spell Characterization
For dry spell characterization, a distribution-free approach was fitted for all the stations. This approach was applicable for all types of data, especially in this case where the rainfall data gave a total of zero for a particular day or period. Thus when analyzing spell length using discrete data, it was deemed suitable to use the distribution-free approach. Since preliminary analysis showed that dry spells longer than 12 days were rare, the conditional risk of 4 , 7 and 10-day dry spells in 30 days were analysed with respect to mid November until the end of the season.
3. Results and Discussion
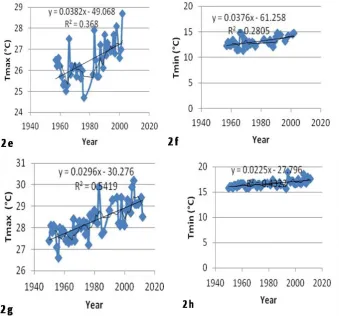
3.1. Temperature TrendsFigure 2a-d. trends in minimum and maximum temperature for Choma (2a and 2b and Mpika (2c and 2d)
[image:4.595.138.478.419.735.2]The observed results showed that the mean annual maximum temperatures while not statistically significant had an upward increasing trend. This means that the selected areas have been experiencing warmer temperatures. This could have implications for crop production and ultimately yields in all AEZ if the farm management practices are not improved or adapted to maximize crop water use. The implications of the findings in this study were echoed by Ainsworth and Ort [2] who concluded that increased global temperatures would challenge agriculture in this century.
3.2. Rainfall Trends
It was observed that the rainfall trends were generally
[image:5.595.119.493.253.541.2]variable for all the stations. Results indicated that the five –year moving average of annual rainfall for Chipepo and Mpika had an increasing trend which is not statistically significant throughout the data period (Figures 3 a and b). It was noted, that the increasing trend for Chipepo was particularly noticeable around the year 2000 when rainfall amounts higher than 600 mm were recorded. This suggests that the area could be prone to floods considering that the average annual rainfall was 600 mm. The results further showed that annual rainfall for Choma, Patauke and Serenje had a decreasing trend that was not statistically significant (Figures 3 c, d and e). The high variability in rainfall could mean rainfed agricultural production remains unpredictable.
Figure 3a–d. Rainfall trends for Chipepo(3a), Mpika (3b), Petauke (3c) and Choma (3d)
[image:5.595.218.403.573.724.2]Generally, rainfall trends although not statistically significant were variable in all AEZs. Notably Choma (AEZ II) and Serenje (AEZ III) had decreasing trends while Chipepo (AEZ I), Petauke (AEZ (II) and Mpika (AEZ III) had decreasing trends. This variability would ultimately pose a challenge in that while increasing temperature trends were observed in all AEZs, the variable rainfall means that crop moisture stress is a definite challenge if cropping operations are not properly timed.
3.3. Extreme Rainfall Events
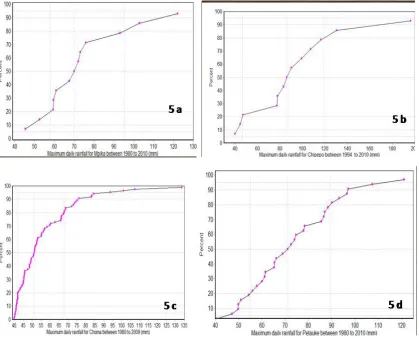
Table 2 provides a summary of return periods for rainfall amount exceeding 40 mm and 100 mm. Figures 4a-e and 5 a-e shows the number of occasions and amount by which the rainfall exceeded a critical limit of 40 mm and the return period of extreme rainfall for Mpika, Chipepo, Choma, Petauke and Serenje respectively. It was shown that the return period for rainfall greater than 40mm and 100 mm per day for Choma was once every year and once every 40 years respectively. In Chipepo, rainfall greater than 40 mm per day had a return period of 1.08 while that greater than 100 mm per day was expected every 3 years. This means that
adaptations to extreme rainfall events in Chipepeo would require a consistent and sustained effort as the expected frequency of occurrence is shorter. In Mpika, the rainfall amount greater than 40 mm is expected once every year while that greater than 40 mm per days is once every 6 years. In Petauke, the return period of rainfall greater than 40 mm per day was once every year while that greater than 100 mm per day was once every 10 years.
Table 2. Summary of return periods of 40 mm and 100 mm
Return period in years Station >= 40 mm >=100
Choma 1.00 40
Chipepo 1.08 3
Mpika 1.08 6
Serenje 1.00 50
[image:6.595.107.513.305.673.2]Petauke 1.00 10
Figure 4e. Extreme daily rainfall over 40 mm for Serenje
Mpika had the highest rainfall ever received in 30 years at 122 mm on 15th January. In Chipepo the most extreme rainfall received in 18 years was on the 8th of March at 196 mm which has a return period of once every 13 years. In Choma, the highest amount of rainfall received in 29 years was 134 mm on the 15th of January. The number of times the 40 mm margin was exceeded in Choma in a 29 years time
was 84. In Serenje, the highest rainfall amount of 121 mm was received on 14th December and it exceeded the 40 mm threshold 128 times in 30 years. Meanwhile, in Petauke the number of occasions the 40 mm threshold was exceeded was 118 times with the highest rainfall of 111 mm received on 14th February . The frequency of receiving rainfall greater than 40 mm is concentrated in January to April rather than October to December, in all the stations (Figures 4a-e and 5 a-e). The results further showed that an extreme event of 200 mm of rainfall in a day was recorded only once among the five stations.
These results suggest that field management practices such as weeding and fertilizer application if done from January to February period could have negative implications. Fertilizers may be leached or washed away and could further enhance weed growth. Moreover, established crops could be washed away by flash floods. Relatively large duration of extreme rainfall events could also explain the widespread shallow debris flows that may damage crops and infrastrucre such as roads [13].
Figure 5a– 5d. Return period of extreme daily rainfall over 40 mm for Mpika(5a) , Chipepo(5b), Choma(5c) and Petauke(5d)
[image:7.595.98.518.352.690.2]Figure 5e. Return period of extreme daily rainfall over 40 mm for Serenje
3.4. The Start of the Season
Results indicated that the optimal planting window was the last decade of November and first week of December across all stations (Table 3 and figure 6). Choma had the highest variability in terms of the optimum planting window while Serenje had the lowest variability. For Serenje and Mpika, the optimal planting period was from 15th November to 5th December. Petauke and Choma though in the same agrocological zones had slightly different optimal planting periods. In Petauke, it ranged from November 15 to December 4 which is quite similar to the two districts in agro-ecological zone III. In Choma, it ranged from November 29 to January 7. This delayed start and prolonged end to the optimal planting date could be attributed to the occurrence of dry spells as discussed in the subsequent sections of this paper.
Chipepo though being in a drier agro-cological zone also showed that the optimal planting date was quite similar to that of AEZ III which is a region of high rainfall. This confirms that rainfall distribution rather than seasonal total is a major factor in crop production. The optimal planting dates in this study were similar to those in a related study by MTNER [9] where the start of the rainy season using a five year data period was shown to begin in the second decade (11-20) or third decade (21-30) of November for most areas of the country. Contrary to our definition of planting date of the first occasion with more than 20mm in a 2 day period after 15 th November and no dry spell of 10 days or more within the following 30 days, Tadross et al. (2006) defined a planting date based on minimal moisture required to sow and seeds to grow of 25 mm of cumulative rainfall in 10 consecutive days. Early planting is key to maintaining
[image:8.595.82.277.75.211.2]stable yields as confirmed by Aagaard [1] who reported a 1.5 % yield loss for every day of delayed planting
.
Figure 6. Optimal planting dates
3.5. Dry Spell Characterization
Figure 7 a-e shows the return period of dry spell of 4, 7 and 10 days for Mpika, Chipepo, Choma, Petauke and Serenje respectively. Generally, dry spells of 5 days are less frequent for all stations. It was revealed that in Mpika dry spells are not a problem and therefore planting can be done within the first 30 days of the onset of rainy season. Planting within the first 30 days of onset of rainy season would be a risk for Chipepo. This is because dry spells of 10 days are common and a dry spell of 18 days was even recorded in 1999. Further, dry spells of 5 -7 days were frequent enough to cause crop damage in the 30 days of planting for Chipepo. Choma was the most affected by dry spells of 4,7 and 10 days with longer dry spells of 17 and 19 days recorded in 1981 and 1988 respectively. The frequency of 5 day dry spells was highest in Choma compared to all other stations in this study giving a crop failure rate of 66.7% if planting is done in the first 30 days of onset of rains.
[image:8.595.332.538.109.264.2]In Serenje, the return period of a 10 days dry spell occurring within the first 30 days following the onset of rainfall was once every year and most likely to occur around the first two weeks of December. Mpika showed the return period of once every year for dry spell magnitude of 4 and 10 to be around the 22nd of November with the 7 days dry spell occurring around the 28th of November with respect to the first thirty days of the onset of the rains.
Table 3. Optimal planting dates in the various places Planting date
Station Period Mean Mini-mum Maxi-mum Standard deviation Choma 1980- 2010 24-Nov 15- Nov 5-Dec 11.7 Chipepo 1994- 2010 26-Nov 20- Nov 5-Dec 5.0
[image:8.595.132.481.646.749.2]Figure 7 a – d. Return period of dry spell of 4, 7, and 10 days for Mpika (a), Chpepo (b), Choma (c) and Petauke (d)
Figure7 e. Return period of dry spell of 4, 7, and 10 days for serenje
However, the chances of a dry spell of 4 days was once in five years for the period around 30th November while the 7 and 10 day dry spells was nonexistent. In Petauke, the chances of a 10 day dry spell within the first 30 days of the start of the rains is once every year on the 16th of November while the 4 and 7 day dry spells was at a similar interval on November 20 and 25 respectively. Meanwhile the dry spell of 7 and 10 days occurring every two year is nonexistent but possible for the 4 days dry spell which will occur around the 10th of December. In Chipepo, the chance of dry spells of 4 and 10 days within the first days of rainfall if starting around mid November is 100%. The dry spells of 7 and 10 days are
likely to occur on November 18, 25 and 30 once every 5 years. Meanwhile dry spells of 4 and 7 days are likely to occur on November 22 and December 6 every two years.
1, 2 and 5 years are prominent for the 4, 7 and 10 days duration spells respectively. Every season there is a 100% chance of have dry spells of 4 days. This is consistent with Res et al. [14] who found Choma to have the highest frequency of dry spells with longest being 4 days. Choma is located in the southern part of the country and studies have shown that this location is drier [14] as has been confirmed by the findings discuused in this paper for both Choma and Chipepo. Moreover Usman & Reason [24] explained this location as being on the margins of the ‘drought corridor’ across southern Africa in the 20 to 25°S band, based on analysis of rainfall data across Africa south of the equator.
Although dry spell of 4 days might be seen to be less significant, their cumulative effect can have negative impacts on crop growth [10]. The implications of higher intensity rainfall and shorter duration dry spells are noticeable during germination and could result in rotting and fungal infections [21, 8]. Thus dry spells of 4 days could still be hazardous since their effect is cumulative.
However, Barron [4] considered a dry spell between 5–15 days to be harmful for sub-Saharan Africa. Meanwhile in Kenya and Tanzania, a 10-day dry spell has the potential to damage a maize crop due to water deficit.
4. Conclusions
It can be concluded that the trends in seasonal rainfall were variable while temperatures generally showed an increasing trend. Further, extreme rainfall in Mpika, Chipepo, Choma, Serenje and Mpika were concentrated from January to February rather than October to November. The return period of rainfall event of over 40 mm per day is expected on a yearly basis on not less than 80 occasions during the rainy season. The optimal planting window was from the last week of November to the first week of December every year for all study sites. The most frequent dry spells for all stations was of duration of 4 days compared to the 7 and 10 day dry spells. Dry spells of more than 15 days were very rare in all the places. The findings presented in this paper highlight the need for consistent and sustained adaptations strategies if rainfed agriculture production is to be successful.
Acknowledgements
The Research team acknowledges financial support from Michigan State University and Administrative support from the University of Zambia. The support of the Indaba Agricultural Policy Research Institute (IAPRI) is also acknowledged.
REFERENCES
[1] Aagaard, P., 2007. Conservation farming and conservation
agriculture: Handbook for hoefarmers in agro-ecological regions I and IIa-flat culture. ZNFU house agricultural showgrounds, Lusaka, Zambia.
[2] Ainsworth, E.A., Ort, D.R. 2010. How do you improve crop production in a warming world. Plant Physiology 154, 2, pp 526 – 530.
[3] Bank, W., Mendelsohn, R., Hassan, R., Kurukulasuriya, P., Office, C. S., Nkonde, E., 2007. An empirical economic assessment. World, 1-33.
[4] Barron, J. 2004. Dry spell mitigation to upgrade semi-arid rainfed agriculture: Water harvesting and soil nutrient management for smallholder maize cultivation in Machakos, Kenya. Doctoral thesis Stockholm University, Sweden. [5] Basitha A, A.S. Arya and N.K. Goel. 2009. Analysis of
Historical changes in rainfall in the Indian Himalayas. International Journal of Climatology 29, 555 – 572.
[6] Hosking, J. R. M., and Wallis, J. R. (1993). Some statistics useful in regional frequency analysis. Water Resources Research, 29, 271-281.
[7] Hosking, J. R. M. and J. R. Wallis. 1997. Regional Frequency Analysis: An Approach Based on L-Moments. Cambridge University Press, New York.
[8] Lekprichakul, T., 2008. Impact of 2004 / 2005 Drought on Zambia’s agricultural production: Preliminary results. Research Institute for Humanity and Nature, Working paper on social-ecological resilience, Series No. 2008-002.
[9] MTENR., 2002. Zambia national action programme for combating desertification and mitigating serious effects of drought in the context of the united nations convention to combat. Policy, (February), 2000.
[10] National Climate Data Center, 2012. Climate of 2012 - November U.S. Palmer Drought
Indices.http://www.ncdc.noaa.gov/oa/climate/research/preli m/drought/palmer.html (January 16th 2013).
[11] Ngongondo, C. S., Alemaw, B., Xu, C., Chirwa, T., Tallaksen, L. M., 2011. Regional frequency analysis of rainfall extremes in southern Malawi using the index rainfall and L-moments approaches. Stochastic Environmental Research and Risk Assessment. 25 (7), 939-955.
[12] Nuñez , J.H., Verbist, K., Wallis, J.R., Schaefer, M.G., Morales, L., Cornelis, W.M., 2011. Regional frequency analysis for mapping drought events in north-central Chile. Water center for arid and semiarid zones of Latin America and the Caribbean.
[13] Norbiato, D., Borga, M., Sangati, M., Zanon, F., 2007. Regional frequency analysis of extreme precipitation in the eastern Italian and the August 29, 2003 flash flood. Journal of hydrology. 345, 149-166.
[14] Res, Clim; Hachigonta, S., Reason, C. J. C., 2006. Interannual variability in dry and wet spell characteristics over Zambia“. In: 32 , pp. 49–62.
[16] Schultz, J., 1974. Explanatory study to the land use map of Zambia: With special reference to the traditional and semi-commercial land use systems. Ministry of Rural Development, Republic of Zambia.
[17] Shehadeh N. and S. Ananbeh. 2013. The impact of climate change upon winter rainfall. American Journal of Environmental Science, 9 (1): 73 – 81.
[18] Sivakumar, M.V.K., 1991. Drought spells and drought frequencies in West Africa. Research Bulletin No. 13, International Crops Research Institute for the Semi-Arid Tropics (ICRISAT).
[19] Stern, R., Rijks, D., Dale, I., Knock, J., 2006. “Instat Climatic Guide.” , no. January.
[20] Stroosnijder, L., 2008. Linking drought to desertification in African drylands. In: D, Gabriels, W, Cornelis, M, Eyletters and P, Hollebosch (Eds), Combating desertification; Assessment, adaptation and mitigation strategies. Published jointly by UNESCO Chair of Eremology, Ghent University, Belgium, and Belgian Development Cooperation. Stern, R., Rijks, D., Dale, I., Knock, J., 2006. “Instat Climatic Guide.” , no. January.
[21] Tadross, M., Suarez, P., Lotsch, A., Hachigonta, S.,
Mdoka,M., Unga- nai,L., Filipe Lucio,F., Kamdonyo,D., Muchinda, M., 2006. Changes in growing-season rainfall characteristics and downscaled scenarios of change over southern Africa : implications for growing maize.” , pp. 193–204.
[22] Thurlow, J., Zhu, T., Diao, X., 2008. The Impact of climate variability and change on economic growth and poverty in Zambia. Food Policy, (December), 1-71.
[23] Trenberth, Kevin E., Aiguo Dai, Roy M. Rasmussen, David B. Parsons, 2003: The Changing Character of Precipitation. Bull. Amer. Meteor. Soc., 84, 1205–1217.
[24] Usman, M.T., Reason, C.J.C., 2004. Dry spell frequencies and their variability over southern Africa. Clim Res 26:199–211.