A Simulation of Consumer-side Multihoming of Original
and Derivative Digital Games: Evidence from Japan
Makoto Kimura
Faculty of Business and Informatics, Nagano University, Japan
Copyright©2016 by authors, all rights reserved. Authors agree that this article remains permanently open access under the terms of the Creative Commons Attribution License 4.0 International License
Abstract
This study examines the consumer-side multihoming among original and derivative digital games are developed for different platforms such as arcade game cabinets and video game consoles, both of which are popular with consumers in the Japanese market. To do this, the system dynamics model accounts for arcade game, console game, and multihoming users, and the effects of advertising and word-of-mouth is proposed. After the validation of model using a single case study, the business policies implementation by varying the release dates of a console game (derivative content) are simulated and the fluctuating patterns of arcade game and console game sales, the multihoming ratios are examined. The simulation results indicate that the multihoming user may be a preferred customer who pays more usage fees for the original content, moreover, the multihoming user may pay usage fees for the derivative content or purchase it, rather than single homing user. This study suggests various hypotheses regarding consumer-side original and derivative content-level multihoming together with options for business scenarios within the digital game industry, which would develop the insights on the diversity of a set of contents and the interfaces, and how they form the pseudo-ecosystems and create the values by the interactions.Keywords
Trading Card Arcade Game (TCAG), Console Game, Multihoming Ratio, System Dynamics, Bass Model1. Introduction
Original and derivative digital games are often developed on different platforms, such as arcade game cabinets and video game consoles, both of which consumers use. Digital games represent copyrighted products classified as original and derivative content that forms part or all of the original content inherited to create secondary copyrighted works. This research is concerned with the original and derivative content that operates on different platforms and discusses the
strategic management of consumer-side multihoming. This paper first presents the most significant aspects of prior research concerning multihoming for console games and then indicates the concept of consumer-side content-level multihoming (consumer purchases and the simultaneous use of both original and derivative content used on different platforms). Next, a calculation model of the consumer-level multihoming ratio (the percentage of all users who are multihoming users) and the consumer-side multihoming ratio at the content level are derived from a single case study. The original content of the case study is represented by a trading card arcade game, and the derivative content is represented by a console game with card reader. A sensitivity analysis is conducted employing a changing release date for the console game, the multihoming ratios of the original and derivative content, and the patterns of changes in sales performance are investigated. The results of the simulation suggest various hypotheses concerning consumer-side content-level multihoming on different platforms and strategic management options for original and derivative content. Conventionally, the concept of multihoming has been discussed in terms of the benefits of using competing platforms, such as the benefits for credit card payment systems and the resulting increased efficiency (Evans [1], Rochet and Tirole [2]). Choi [3] defined consumer-side multihoming as “the ability to participate in multiple platforms (or purchase multiple products) in order for the consumer to obtain the maximum possible benefit from the network” and proposed a model of a “two-sided market with multihoming” in which both the consumers and content providers become either single homing or multihoming.
which the applications of a particular seller on the platform are also available to buyers on competing platforms) and platform-level multihoming (the extent to which applications on a particular platform are also available to buyers on a competing platform). However, they did not consider the buyer-side extensively because consumer-side multihoming was outside the scope of their research.
Moreover, Babb et al. [8] examine video game sales by platform in the global market from a period spanning 2006 through 2011, employing a Kruskal-Wallis test to compare eight different gaming platforms. From the political economic view, Nichols [9] attempts to describe the global development of video game industry such as industrial history, market structure, and production, from 1972 to 2010. However, this study is different from the previous research in the market size, the time scale and the modeling methodology.
2. Materials and Methods
2.1. Consumer-side Multihoming
This research adopts the seller-level and platform-level multihoming concept advocated by Landsman and Stremersch[7] and investigates multihoming with respect to specific original and derivative content on the consumer-side game-software (content) level. This represents consumer-side multihoming at the original and derivative content level and the extent to which consumers purchase or simultaneously use both original and derivative content on different platforms. For example, if consumers (users) who use only original content constitute a low (high) percentage of all users of original content, then the extent of consumer-side original content-level multihoming increases (decreases). Additionally, if the number of users of both original and derivative content constitutes a high (low) percentage of the total number of users of derivative content, then the extent of consumer-side derivative content-level multihoming increases (decreases). The extent of consumer-side content-level multihoming can be expressed in simple numerical terms using the multihoming ratios of each content type.
The users of original content who are also users of derivative content represent multihoming users of the original content. These multihoming ratios are formulated as follows.
The original content multihoming ratio = number of original content multihoming users ÷ total number of original content users
The specific derivative content multihoming ratio = number of specific derivative content multihoming users ÷
total number of specific derivative content users
By constructing a quantitative model, within special, non-observed conditions, numerical solutions for changes to the multihoming ratios and changes to original and derivative content sales performances are obtained, which facilitates a discussion that extends beyond a qualitative perspective.
2.2. Single Case Study
“Fashionable Witches: Love and Berry” [Oshare Majo Rabu and Berii] was a Sega-developed arcade game targeted at young girls that began operating in late October 2004. A single play cost 100 JPY and offered a reward of one “fashion magic” [Oshare Mahou] card with barcodes. This “magic” card came in four types: hair and make-up, clothing, footwear, and special item cards [10]. When a player scanned the magic cards with barcodes, one of the computer graphics female characters, Love or Berry, appeared on the device’s screen dressed in the fashions shown on the cards. A point value was awarded for a combination of cards, and the choreography of the subsequent dance game was based on this. The player’s success was determined by pressing buttons to the rhythm of the dance. The "Love and Berry" arcade cabinet was available as a free rental and commonly placed in shopping center game corners throughout Japan. Sega also created special designated areas for "Love and Berry" in its directly operated video arcades. "Love and Berry" was popular with young girls interested in fashion and with their mothers. Sega Toys, a Sega subsidiary, developed a line of toys based on the property, and official “LB Style Square” shops selling original young girls’ apparel and character goods were opened in department stores and shopping centers. By August 2006, one year and ten months after the release of the game, 10,100 arcade cabinets had been distributed and 194 million cards had reportedly been sold. Two years after the release of the game, on November 22, 2006, a console game version for the Nintendo DS handheld console, “Fashionable Witches: Love and Berry – DS Collection,” was released at a retail price of 6,090 JPY.
Figure 1. The performance of Fashionable Witches: Love and Berry (2004–2008) [Based on data provided by Media Create Co., Ltd.]
2.3. Model
This multihoming calculation model is proposed by system dynamics (SD) notation, as an amended Bass diffusion model (Bass [11], Bass et al. [12]), which includes the number of users of both the arcade game (ARG) and the console game (CSG) and the monthly sales performances of the ARG and CSG (see Figure 2).
The Bass diffusion model assumes that potential adopters are influenced by two means of communication: mass media (external influence) and word-of-mouth (internal influence) and adopts the coefficients of external influence and internal influence (Mahajan et al. [13, 14]).
Potential Game
Users Arcade GameUsers
New ARG Users
Lifetime Purchase Cards SHG
ARG Sales Performance SHG
ARG Recognition Rate
Recognized Potential Users
Imitation Coefficients
Market Scale
Market Diffusion Rate Actual Market
Scale
Console Game Users
New CSG Users
CSG Sales Start Months
WOM Effect
Advertising Effect P
Advertising Effect SHG
CSG Sales Period Total New CSG
Users
External Effect Advertising Coefficients
<Advertising Coefficients>
Value1 Value2 Value3 Value4
Period1
Period2 Period3
ValueE <Imitation
Coefficients>
Multihoming Users New MHG Users
Total ARG Users
Total CSG Users
Lifetime Purchase Cards MHG
ARG Sales Performance MHG Accumulated ARG
Sales Performance
CSG Mu ltihomin g Ratio
ARG Multiho
ming Ratio Population of
Girls in 2008
Potential Diffusion Rate
Internal Effect
ValueA ValueB
ValueC ValueD
[image:4.595.66.540.81.479.2]PeriodA PeriodB PeriodC <FINAL TIME>
Figure 2. The SD diagram of the multihoming calculation model
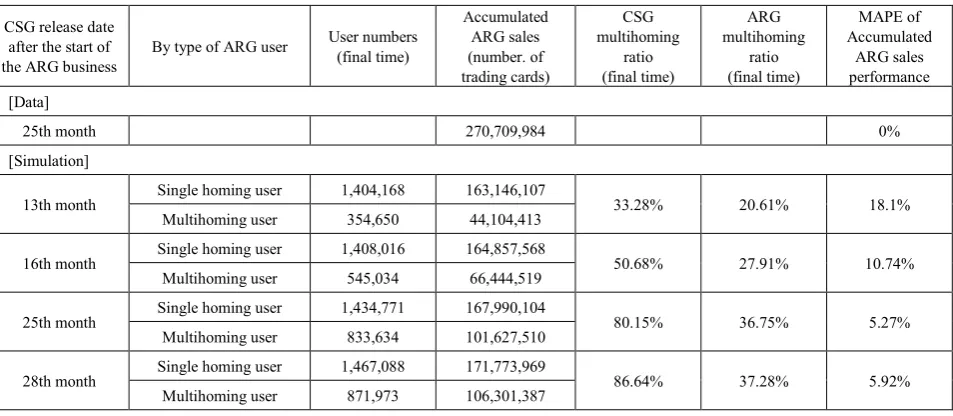
Table 1. A comparison of sales performance ratios and ARG multihoming ratios
CSG release date after the start of
the ARG business By type of ARG user
User numbers (final time)
Accumulated ARG sales (number. of trading cards)
CSG multihoming
ratio (final time)
ARG multihoming
ratio (final time)
MAPE of Accumulated
ARG sales performance [Data]
25th month 270,709,984 0%
[Simulation]
13th month Single homing user 1,404,168 163,146,107 33.28% 20.61% 18.1%
Multihoming user 354,650 44,104,413
16th month Single homing user 1,408,016 164,857,568 50.68% 27.91% 10.74%
Multihoming user 545,034 66,444,519
25th month Single homing user 1,434,771 167,990,104 80.15% 36.75% 5.27%
Multihoming user 833,634 101,627,510
28th month Single homing user 1,467,088 171,773,969 86.64% 37.28% 5.92%
[image:4.595.69.546.518.726.2]The difference equations of the multihoming calculation model are described as follows, where the value for Δt was one month.
Recognized Potential Users = Potential Game Users(t) × ARG Recognition Ratio
Market Scale = Potential Game Users(t) + Arcade Game Users(t) + Console Game Users(t) + Multihoming Users(t) Market Diffusion Ratio = (Arcade Game Users(t) + Console Game Users(t) + Multihoming Users(t)) ÷ Market Scale Actual Market Scale = Recognized Potential Users ×Market Diffusion Ratio
New ARG Users = WOM Effect
Potential Game Users (t=0) = Population of Girls in 2008 × Potential Diffusion Ratio
Potential Game Users (t + Δt) = Potential Game Users (t) -
(New ARG Users + New CSG Users) × Δt
Arcade Game Users(t + Δt) = Arcade Game Users(t) + (New ARG Users -MHG Users) × Δt
Arcade Game Users(t=0) = 10000
Advertising Effect SHG = Arcade Game Users(t) × Advertising Coefficients
Advertising Effect P = Advertising Coefficients × Potential Game Users(t)
New CSG Users = Advertising Effect P × CSG Sales Period Console Game Users(0) = 0
Console Game Users(t + Δt) = Console Game Users(t) + New CSG Users× Δt
New MHG Users = Advertising Effect SHG×CSG Sales Period
Multihoming Users (0) = 0
Multihoming Users(t + Δt) = Multihoming Users(t) + New MHG Users × Δt
ARG Sales Performance MHG = Lifetime Purchase Cards MHG × Multihoming Users(t)
ARG Sales Performance SHG = Arcade Game Users × Lifetime Purchase Cards SHG
Accumulated ARG Sales Performance = ARG Sales Performance SHG + ARG Sales Performance MHG
In this quantitative model, the multihoming ratios of the ARG and CSG are formulated as follows.
ARG multihoming ratio = number of multihoming users ÷
(number of ARG users + number of multihoming users)
CSG multihoming ratio = number of multihoming users ÷
(number of CSG users + number of multihoming users)
The following conditions were assumed in this multihoming calculation model (see Appendix). The increase in the number of ARG users is a result of the word-of-mouth effect only, not the advertising effect. The increase in CSG user numbers is a result of the advertising effect only, not the word-of-mouth effect. A multihoming user is assumed to be an ARG user who is also a CSG user. An increase in the number of multihoming users is from the advertising effect only, not from the word-of-mouth effect.
If we consider users who become multihoming users through the word-of-mouth effect on ARG users then, over time, CSG sales performance will record a simple increase. This contradicts a general feature of CSGs whereby the number of units sold is highest immediately after the sales release and subsequently declines uniformly. The "Fashionable Witches: Love and Berry" case study shows that the weekly and monthly sales totals for the CSG declined uniformly directly after its release.
The imitation and advertising coefficients were set by the step function. These constants are obtained from the Markov Chain Monte Carlo (MCMC) method using Vensim Professional software (Ventana Systems [16]) through the calibration by a comparison of the actual measurement values and the calculated values of the ARG and CSG sales performances. The number of ARG single homing users’ and multihoming users’ lifetime purchases of cards (the number of times the ARG is used per person) was optimized in the same way, with a result of 117.085 and 121.909 cards respectively.
The scope of time integration was up to 38 months. Additionally, the number of potential game users was set at 2,512,000 people, which corresponds to 40% of the total estimated population of girls aged from 2 to 12 in Japan in 2008.
3. Results
3.1. Sales Performances of ARG and CSG
0 50000 100000 150000 200000 250000 300000 350000 400000 450000
0 50000000 100000000 150000000 200000000 250000000 300000000
1 2 3 4 5 6 7 8 9 10 11 12 13 14 15 16 17 18 19 20 21 22 23 24 25 26 27 28 29 30 31 32 33 34 35 36 37 38
N
um
ber
of
ca
rd
s (AR
G
)
Arcade Game Accumulated Sales (Cards)
Model Simulated (Cards)
Months Num
ber
of
copi
es
(
C
S
G
)
Model Simulated by Singlehoming Users (Cards)
Model Simulated by Multihoming Users (Cards) Consumer Game
Monthly Sales (Copies)
[image:6.595.65.543.77.734.2]Model Simulated (Copies)
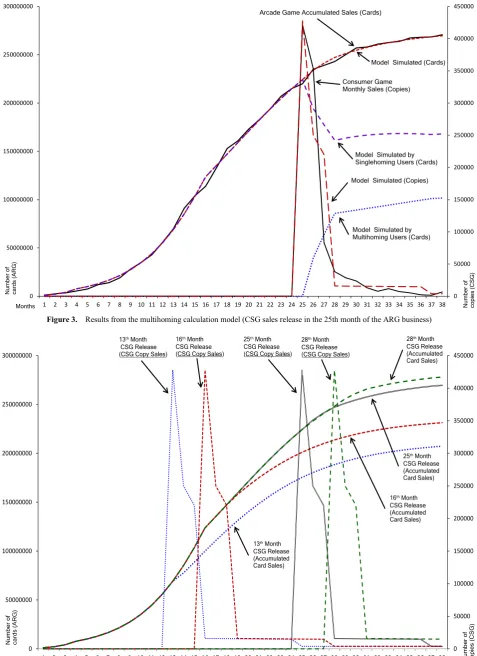
Figure 3. Results from the multihoming calculation model (CSG sales release in the 25th month of the ARG business)
0 50000 100000 150000 200000 250000 300000 350000 400000 450000
0 50000000 100000000 150000000 200000000 250000000 300000000
1 2 3 4 5 6 7 8 9 10 11 12 13 14 15 16 17 18 19 20 21 22 23 24 25 26 27 28 29 30 31 32 33 34 35 36 37 38
Months
N
um
ber
o
f
ca
rd
s (AR
G
)
N
um
ber
of
copi
es
(
C
S
G
)
25thMonth
CSG Release (Accumulated Card Sales) 25thMonth
CSG Release (CSG Copy Sales) 16thMonth
CSG Release (CSG Copy Sales)
13thMonth
CSG Release (CSG Copy Sales)
28thMonth
CSG Release (CSG Copy Sales)
13thMonth
CSG Release (Accumulated Card Sales)
16thMonth
CSG Release (Accumulated Card Sales)
28thMonth
[image:6.595.65.541.399.744.2]CSG Release (Accumulated Card Sales)
0 50000 100000 150000 200000 250000 300000 350000 400000 450000
0 20000 40000 60000 80000 100000 120000 140000 160000 180000 200000
1 2 3 4 5 6 7 8 9 10 11 12 13 14 15 16 17 18 19 20 21 22 23 24 25 26 27 28 29 30 31 32 33 34 35 36 37 38MonthsNum
ber
of
copi
es
(
C
S
G
)
N
um
ber
of
new
us
er
s
25thMonth CSG Release (CSG Copy Sales) 16thMonth
CSG Release (CSG Copy Sales) 13thMonth
CSG Release (CSG Copy Sales)
28thMonth CSG Release (CSG Copy Sales)
13thMonth
CSG Release (New ARG Users)
28thMonth CSG Release (New ARG Users)
16thMonth CSG Release (New ARG Users)
25thMonth
[image:7.595.68.544.73.393.2]CSG Release (New ARG Users)
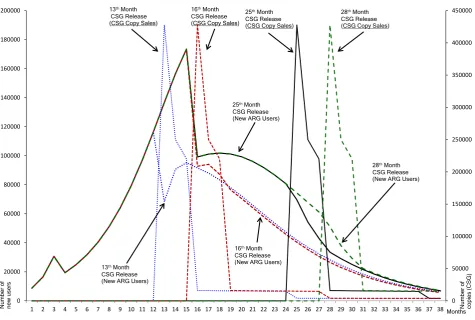
Figure 5. ARG and CSG new user numbers by varying CSG release date
Moreover, as the business policies are implemented, the cases of changing CSG release date, are simulated by the multihoming calculation model with the same parameter values. The simulated results of changing CSG release date after the start of ARG business, such as 13th, 16th, and 28th month are also shown in Table 1. Figures 4 and 5 show the trends in the ARG and CSG sales performances and monthly new ARG and CSG user numbers of their cases. Figure 5 shows that the monthly sales peak of ARG occurs mainly in month 15 following the release of the ARG.
These simulation results indicate that the accumulated ARG sales performances are increased by postponing the CSG release date. The ARG and CSG multihoming ratios are also increased in the same way. The results of the simulation that attempted to approximate the "Love and Berry" case study performance showed that approximately 37% of the ARG, original content users were also CSG users (multihoming user), and approximately 20% of the CSG, derivative content users were new users who did not play the ARG (single homing users).
Theoretically, when a transition in a single direction is established for complementary data between the original and derivative content, the derivative content becomes a complete substitute for the original content and users can transfer between them. The trading card with barcodes can be interpreted as complementary content. However, the results of this simulation showed that approximately 63% of the original content users became single homing users who were not also derivative content users (i.e., they did not
become multihoming users).
It may be preferable for the original and derivative content business operators to envisage from the beginning that more than half of the original content users will become single homing users. However, if we assume a scenario in which approximately 20% of the derivative content users are new users and the rest are multihoming users (also original content users), then the acquisition of new users by increasing potential user recognition should not be the focus of the derivative content business operators. Instead, it is better to prioritize advertising that transitions the original content users who already have a high level of recognition.
3.2. Sensitivity Analysis and Business Scenarios
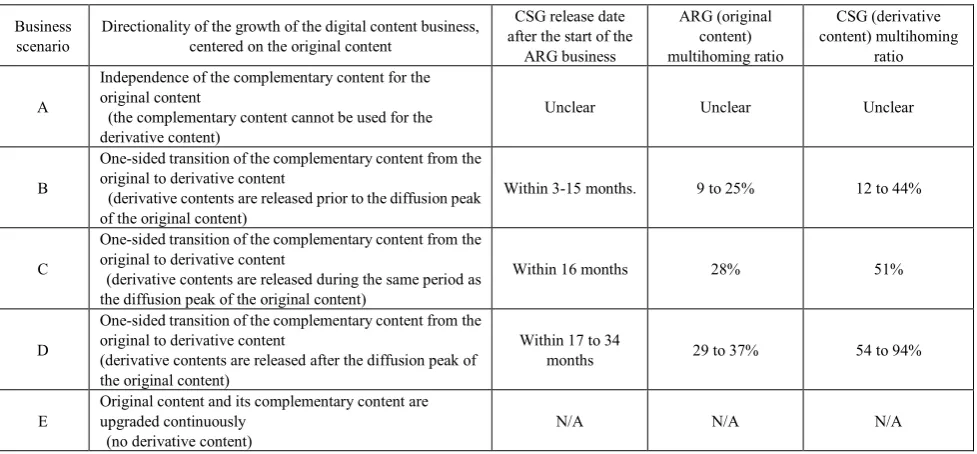
Table 2 shows the potential effects of derivative content release dates after the start of the original content business with each period between the dates given a business scenario. A sensitivity analysis for the "Love and Berry" case was also conducted using the multihoming calculation model. Figure 6 shows the trends in the ARG and CSG sales performances and the multihoming ratios for business scenarios B, C, and D. The final ARG accumulated sales performance (the accumulated sales of the cards) is increased by delaying the CSG release date with month 16 representing the inflection point, after which the sales performance increases gradually. This means the diffusion peak of ARG should be 15 month following the release of the ARG in this case study.
CSG sales performance (the accumulated sales of the units) does not change significantly. If business scenarios B is selected, in which the CSG is released in the period prior to the inflection point on the ARG accumulated sales performance curve, the ARG multihoming ratio increases and the CSG multihoming ratio exponentially increases. Even in business scenario C, in which the CSG is released on the inflection point, the ARG sales performance and the ARG multihoming ratio, the CSG multihoming ratio are higher than the values of business scenario B. In business scenario D, in which the CSG is released after the 17th month, the CSG multihoming ratio increases uniformly. Therefore, when the CSG release date is delayed, the CSG
multihoming ratio increases, and when the CSG is released in month 30, the CSG multihoming ratio exceeds 90%. Conversely, the ARG multihoming ratio becomes a convergence value at 37% when the CSG is released in month 25. In the "Love and Berry" case study, the CSG is released in month 25 following the release of the ARG, therefore, it is included in business scenario D. The result of this sensitivity analysis also supports the validity of business scenario D, which aims to secure the performance of an ARG through releasing the CSG after the diffusion peak of the original content (the maximum number of monthly new user numbers).
0% 10% 20% 30% 40% 50% 60% 70% 80% 90% 100%
0 500000 1000000 1500000 2000000 2500000 3000000 3500000
1 2 3 4 5 6 7 8 9 10 11 12 13 14 15 16 17 18 19 20 21 22 23 24 25 26 27 28 29 30 31 32 33 34 35 36 37 38
Months of CSG Release
N
um
ber
of
S
al
es
ARG Multihoming Ratio (%)
Biz Scenario B Biz Scenario D
ARG Performance
(100 x Accumulated Card Sales)
Months of CSG Release
CSG Multihoming Ratio (%)
CSG Performance (Accumulated Copies Sales)
[image:8.595.70.545.250.575.2]Biz Scenario C
Table 2. Associations between the business scenarios and the results of the sensitivity analysis
Business
scenario Directionality of the growth of the digital content business, centered on the original content
CSG release date after the start of the
ARG business
ARG (original content) multihoming ratio
CSG (derivative content) multihoming
ratio
A
Independence of the complementary content for the original content
(the complementary content cannot be used for the derivative content)
Unclear Unclear Unclear
B
One-sided transition of the complementary content from the original to derivative content
(derivative contents are released prior to the diffusion peak of the original content)
Within 3-15 months. 9 to 25% 12 to 44%
C
One-sided transition of the complementary content from the original to derivative content
(derivative contents are released during the same period as the diffusion peak of the original content)
Within 16 months 28% 51%
D
One-sided transition of the complementary content from the original to derivative content
(derivative contents are released after the diffusion peak of the original content)
Within 17 to 34
months 29 to 37% 54 to 94%
E Original content and its complementary content are upgraded continuously
(no derivative content) N/A N/A N/A
4. Discussion and Conclusion
4.1. Discussion
Theoretically, when a transition in a single direction is established for complementary data between the original and derivative content, the derivative content becomes a complete substitute for the original content and users can transfer between them. The trading card with barcodes can be interpreted as complementary content. However, the results of simulation showed that approximately 63% of the original content users became single homing users who were not also derivative content users (i.e., they did not become multihoming users).
It may be preferable for the original and derivative content business operators to envisage from the beginning that more than half of the original content users will become single homing users. However, if we assume a scenario in which approximately 20% of the derivative content users are new users and the rest are multihoming users (also original content users), then the acquisition of new users by increasing potential user recognition should not be the focus of the derivative content business operators. Instead, it is better to prioritize advertising that transitions the original content users who already have a high level of recognition.
Moreover, considering the results of the sensitive analysis and business scenarios, we can propose hypotheses with respect to consumer-side content level multihoming when both the original and derivative content are digital games realizing a transition of data from original to derivative content on different platforms.
Hypothesis 1: There is a positive relationship between the interval (time lag) for the provision of the original and derivative content and the consumer-side derivative content
multihoming ratio.
Hypothesis 2: There is a positive relationship between the consumer-side multihoming ratios of the original and derivative content, manifesting in an increasing derivative content multihoming ratio.
Hypothesis 3: There is a positive relationship between the consumer-side derivative content multihoming ratio and the original content accumulated sales performance.
To address the hypotheses concerning consumer-side multihoming with respect to original and derivative content, we present guidelines for improvements in the performances of original and derivative content on different platforms. First, by setting the release date for the derivative content after the diffusion peak of the original content (when the maximum number of monthly new users is attained), we can expect the multihoming ratios of the original and derivative content to improve. When this occurs, we also expect that the multihoming ratio of the derivative content will be higher than the ratio of the original content. Alternatively, a situation in which the original content multihoming ratio rises excessively should not be anticipated. However, the derivative content has an optimum release date and, if delayed, the derivative content accumulated sales performance may suffer.
4.2. Managerial Implications
do so. The multihoming user may be a preferred customer (although probably a light user) who pays more usage fees for the original content. Moreover, the multihoming user may pay usage fees for the derivative content or purchase it.
These hypotheses concerning consumer-side multihoming between original and derivative content in the digital game industry that have been presented in this research assume that the original content multihoming ratio does not increase above a certain level. However, strategic management choices exist that can improve total earnings by raising the derivative content multihoming ratio.
4.3. Remaining and Future Issues
The concept of multihoming ratio between the original and derivative content such as digital games, would allow the researchers and the managers to develop the insights on the diversity of a set of contents and the interfaces, and how they form the pseudo-ecosystems and create the values by the interactions among them. However, this paper proposes only a single case study and its SD model to reproduce the diffusion pattern by the modified Bass model integrated with the multihoming ratio. The multihoming calculation model presented in this research is the simplest quantitative model that considers trends in the user numbers of the original content and one type of derivative content based on a given number of potential users. The model’s reproducibility was only affirmed from a single case study. With respect to the single case study used for this research, while the model was validated using the measurement values of the game’s sales performance, the measurement values of users’ multihoming ratios could not be obtained. Therefore, the new findings obtained for consumer-level multihoming for digital games are, ultimately, findings obtained from an investigation of simulation results. A comparison of multiple case studies could verify the measurement values of consumer-side multihoming ratios and the calculation values.
The future research requires to explore the more complex pattern of interactions and monitor the consumer-side mutihoming, theoretically and empirically. To do this, we intend to examine multihoming between multiple generations of derivative content and original content. Moreover, the multihoming calculation model with its circulating structure that links an increase in derivative content to an increase in potential user numbers, should be developed for the future study.
Acknowledgements
We greatly appreciate the cooperation of Media Create Company Limited who provided the digital game performance data used in this study. This work was supported by JSPS KAKENHI, Grant Number 26285090.
Appendix: The Formulation of the
Multihoming Calculation Model
Accumulated ARG Sales Performance=ARG Sales Performance SHG+ARG Sales Performance MHG
[Units: Month*Card]
Actual Market Scale=Recognized Potential Users*Market Diffusion Rate
[Units: Person]
Advertising Coefficients=DELAY FIXED(External Effect, CSG Sales Start Months,0)
[Units: 1/Month]
Advertising Effect P=Advertising Coefficients*Potential Game Users
[Units: Person]
Advertising Effect SHG=Arcade Game Users*Advertising Coefficients
[Units: Person]
Arcade Game Users= INTEG (New ARG Users-New MHG Users, 10000)
[Units: Person*Month]
ARG Multihoming Ratio=IF THEN ELSE (Total ARG Users=0, 0 , Multihoming Users/Total ARG Users )
[Units: Dmnl]
ARG Recognition Rate=0.153938 [Units: 1/Month]
ARG Sales Performance MHG=Lifetime Purchase Sheets MHG*Multihoming Users
[Units: Month*Card]
ARG Sales Performance SHG=Arcade Game Users*Lifetime Purchase Sheets SHG
[Units: Card*Month]
Console Game Users= INTEG (New CSG Users,0) [Units: Person*Month]
CSG Multihoming Ratio=IF THEN ELSE( Total CSG Users=0, 0, Multihoming Users/Total CSG Users )
[Units: Dmnl]
CSG Sales Period=IF THEN ELSE(PULSE(CSG Sales Start Months,FINAL TIME),1,0)
[Units: Dmnl]
CSG Sales Start Months=24 [Units: Month]
External Effect=IF THEN
ELSE(PULSE(0,Period1),Value1,IF THEN ELSE(PULSE(Period1,Period2),Value2
,IF THEN ELSE
(PULSE(Period2,Period3),Value3,Value4))) [Units: 1/Month]
FINAL TIME = 37 [Units: Month]
Imitation Coefficients=IF THEN ELSE(PULSE(0,CSG Sales Start Months),Internal Effect, ValueE)
[Units: Dmnl]
Internal Effect=IF THEN
ELSE(PULSE(0,PeriodA),ValueA, IF THEN
[Units: Dmnl]
Lifetime Purchase Sheets MHG=121.909 [Units: Card/Person]
Lifetime Purchase Sheets SHG=117.085 [Units: Card/Person]
Market Diffusion Rate=(Arcade Game Users+Console Game Users+Multihoming Users)/Market Scale
[Units: Dmnl]
Market Scale=Potential Game Users+Arcade Game Users+Console Game Users+Multihoming Users
[Units: Person*Month]
Multihoming Users= INTEG (New MHG Users,0) [Units: Month*Person]
New ARG Users=WOM Effect [Units: Person]
New CSG Users=Advertising Effect P*CSG Sales Period [Units: Person]
New MHG Users=Advertising Effect SHG*CSG Sales Period
[Units: Person] Period1=1 [Units: Month] Period2=2 [Units: Month] Period3=10.0748 [Units: Month] PeriodA=3 [Units: Month] PeriodB=12 [Units: Month] PeriodC=20 [Units: Month]
Population of Girls in 2008=6.28e+006 [Units: Month*Person]
Potential Diffusion Rate=0.4 [Units: Dmnl]
Potential Game Users= INTEG (-New ARG Users-New CSG Users, Population of Girls in 2008*Potential Diffusion Rate)
[Units: Person*Month]
Recognized Potential Users=Potential Game Users*ARG Recognition Rate
[Units: Person]
Total ARG Users=Arcade Game Users+Multihoming Users
[Units: Month*Person]
Total CSG Users=Console Game Users+Multihoming Users
[Units: Month*Person]
Total New CSG Users=New CSG Users+New MHG Users
[Units: Person] Value1=0.169634 [Units: 1/Month] Value2=0.119379 [Units: 1/Month] Value3=0.00982922
[Units: 1/Month] Value4=0.00268006 [Units: 1/Month] ValueA=5.73332 [Units: Dmnl] ValueB=1.96307 [Units: Dmnl] ValueC=1.04923 [Units: Dmnl] ValueD=1e-005 [Units: Dmnl] ValueE=0.981038 [Units: Dmnl]
WOM Effect=Imitation Coefficients*Actual Market Scale
[Units: Person]
REFERENCES
[1] D. S. Evans. Some empirical aspects of multi-sided platform industries, Review of Network Economics, Vol.2, No.3, 191-209, 2003.
[2] J-C. Rochet, J. Tirole. Platform competition in two-sided markets, Journal of the European Economic Association, Vol.1, No.4, 990-1029, 2003.
[3] J. P. Choi. Tying in two-sided markets with multi-homing, The Journal of Industrial Economics, Vol.58, No.3, 607-626, 2010.
[4] M. T Clements,. H. Ohashi. Indirect network effects and the product cycle: Video games in the US, 1994-2002, The Journal of Industrial Economics, Vol.53, No.4, 515-542, 2005.
[5] K. S. Corts, M. Lederman. Software exclusivity and the scope of indirect network effects in the US home video game market, International Journal of Industrial Organization, Vol.27, No.2, 121-136, 2009.
[6] R.T. Gretz. Hardware quality vs. network size in the home video game industry, Journal of Economic Behavior & Organization, Vol.76, No.2, 168-183, 2010.
[7] V. Landsman, S. Stremersch. Multihoming in two-sided markets: An empirical inquiry in the video game console industry, Journal of Marketing, Vol.75, No.6, 39-54, 2011. [8] J. Babb, N. Terry, K. Dana. The Impact Of Platform On
Global Video Game Sales, International Business & Economics Research Journal, Vol.12, No.10, 1273-1288, 2013.
[9] R. Nichols. The Video Game Business, British Film Institute, London, UK, 2014.
[10] Sega. Oshare Majo Rabu and Berii [Fashionable Witches: Love and Berry] Official Home Page. http://osharemajo.com/[June 2, 2014]
[12] F. M. Bass, T. V. Krishnan, D. C. Jain. Why the Bass model fits without decision variables, Marketing Science, Vol.13, No.3, 203-223, 1994.
[13] V. Mahajan, E. Muller, R. K. Srivastava. Determination of adopter categories by using innovation diffusion models, Journal of Marketing Research, Vol.27, No.1, 37-50, 1990. [14] V. Mahajan, E. Muller, F. M. Bass. Diffusion of new
products: Empirical generalizations and managerial uses,
Marketing Science, Vol.14, No.3, G79-G88, 1995.
[15] J. D. Sterman. Business Dynamics: Systems Thinking and Modeling for a Complex World, McGraw-Hill, New York, NY, USA, 2000.
[16] Ventana Systems. Vensim Professional, Version 6.3G [software], Cambridge, MA, USA, 2016.
![Figure 1. The performance of Fashionable Witches: Love and Berry (2004–2008) [Based on data provided by Media Create Co., Ltd.]](https://thumb-us.123doks.com/thumbv2/123dok_us/8781958.904716/3.595.62.549.77.357/figure-performance-fashionable-witches-berry-based-provided-create.webp)