Non-linear time domain analysis of base isolated multi-storey building under site
speci
fi
c bi-directional seismic loading
A.B.M. Saiful Islam
a, Raja Rizwan Hussain
b,⁎
, Mohammed Jameel
a, Mohd Zamin Jumaat
a aDepartment of Civil Engineering, University of Malaya, Kuala Lumpur, Malaysia
bCoE-CRT, Department of Civil Engineering, College of Engg., King Saud University, Riyadh, Saudi Arabia
a b s t r a c t
a r t i c l e i n f o
Article history:
Accepted 28 November 2011 Available online 30 December 2011
Keywords:
Non-linear dynamic Time domain Seismic isolation Bi-directional earthquake Multi-storey structures Medium risk seismicity
The incorporation of base isolation in building construction in the region of medium risk seismicity is now an important issue. Thorough investigation is needed for buildings located in those regions, to be incorporated with base isolator and then dynamic analysis to carry over. This research provides incorporation of Lead Rub-ber Bearing and High Damping RubRub-ber Bearing as base isolators in addition to focussing on the changes of structural parameters for isolating effects in those vicinities. Nonlinear models of Lead Rubber Bearing and High Damping Rubber Bearing have been built up. The design of base isolators for building construction is covered along with structural feasibility. Linear static, free vibration and nonlinear dynamic time domain an-alyses are performed for both isolated and non-isolated buildings under site specific bi-directional earth-quake. The automated Newmark-beta time integration approach has been adopted for solution in time domain. The nonlinearities, arising due to base isolated bearings and seismic forces are duly considered. The study reveals that for medium rise building construction, isolation can significantly reduce seismic re-sponse in soft to medium stiff soil. The reduction of overturning base moment due to isolation indicates that the building becomes more stable compared to thefixed base structure. Modelled non-linear bearings have been found to be suitable to cope with the precise nonlinearities. The building experiences morefl exi-bility even when using the same structural element configuration. In addition, theflexibility of the structure envisages some sort of savings due to reduced structural responses through incorporation of the isolator. In seismic vulnerable areas where the main concern is the mitigation of the seismic instability with the support of critical components, the study shows the effectiveness of the base isolation system in terms of lessening structural responses under seismic loading.
© 2011 Elsevier B.V. All rights reserved.
1. Introduction
Seismic isolation is the separation of the structure from its base to negotiate the destructive movement of the ground by providingfl ex-ibility and energy dissipation capability through the insertion of isola-tors between the foundation and the building structure[1]. Unlike the conventional design approach, which is based on an increased resis-tance (strengthening) of the structures, the seismic isolation concept is aimed at a significant reduction of dynamic loads induced by the earthquake at the base of the structures themselves[2]. Invention of lead rubber bearing (1970's) and high damping rubber (early 1980's) sets forth a new dimension for the design of base isolated structure[3–8]. A significant amount of both past and recent research in the area of base isolation has focused on the use of elastomeric bearings, such as high damping rubber bearing and lead rubber bear-ings [9–12]. Jangid [13] and Providakis [14] investigated seismic
responses of multi-storey buildings for near fault motion isolated by LRB. Dall'Asta and Ragni[15,16]have covered experimental tests, an-alytical model and nonlinear dynamic behaviour of HDRB. Bhuyan [17]has developed a rheological model of high damping rubber bear-ing for seismic analysis identifybear-ing nonlinear viscosity. Analysis pro-cedures to investigate the dynamic structural behaviour with the isolation have also been discussed[18,19]. Although it is a relatively recent technology, seismic isolation for multi-storey buildings has also been well evaluated and reviewed[20–35]. Base isolator with hardening behaviour under increasing load has been developed for medium-rise buildings (up to four storey) and sites with moderate earthquake risk[36]. Nonlinear seismic response evaluation was per-formed by Balkaya and Kalkan[37]. Resonant behaviour of base-isolated high-rise buildings under long-period ground motions was studied by Ariga et al.[38]and long period building responses by Olsen et al.[39]. Ebisawa et al.[40], Dicleli and Buddaram[41], Cas-ciati and Hamdaoui [42], Di Egidio and Contento [43] have also given effort in the progress of isolated system. Komodromos et al. [27], Sharma and Janggid[44], and Kilar and Koren[45]focused on the seismic behaviour and responses through dynamic analyses of ⁎ Corresponding author.
E-mail address:raja386@hotmail.com(R.R. Hussain).
0926-5805/$–see front matter © 2011 Elsevier B.V. All rights reserved. doi:10.1016/j.autcon.2011.11.017
Contents lists available atSciVerse ScienceDirect
Automation in Construction
isolated buildings. Wilkinson and Hiley[46]have presented a non-linear response history model for the seismic analysis of high-rise framed buildings.
Though the implementation of isolator is going to be very familiar all over the world, there is a lack of proper research to implement the device practically for local buildings in a medium risk seismic region like Dhaka, Bangladesh as per the local requirements. So, a thorough study regarding the feasibility of implementing isolator in this locality is a must to go task. Besides, bi-directional earthquake has rarely been considered as an issue. The time domain method is relatively more time consuming, lengthy and costly. The frequency domain method, on the other hand, is relatively more rapid, concise, and economical. However, the time domain method has been employed for consider-ing non-linearity present in the structural systems.
Time domain analyses, following bi-directional earthquake history, have been carried out. Site specific seismic record in two orthogonal di-rections has been selected to evaluate the bi-directional behaviour. Combined model of High Damping Rubber bearing (HDRB) and Lead Rubber Bearing (LRB) has been adopted here to explore the feasibility. Preliminary exploration for determining the suitability of isolator incor-poration has been done with equivalent static analysis. Then dynamic analysis has been performed to satisfy the structural limitation execut-ing different comparative contributions. The analysis and design of the isolators for a 10-storey sample residential building in Dhaka using SAP 2000[47]were performed. Design parameters of the isolator for this building and several buildings varying number of storey have been evaluated. Static analysis and free vibration analysis were also performed along with dynamic analyses. Finally, the acceleration exci-tation behaviours forfixed and isolated buildings were discussed with the displacement patterns at different levels as well. Base shear and overturning moments were also compared to and for certain cases. Every comparison was enforced mentioning the maximum and mini-mum values on structural excitation.
2. Mathematical formulation
An ideal model for a multi storey building is shown inFig. 1. The building has been considered as moment resisting concrete frame structure. The superstructure is configured as a linear elastic system. The base andfloor between which the isolator is placed are assumed to be infinitely rigid. The nonlinearities arising due to base isolator bearings and seismic forces are properly considered. The superstruc-ture and base are modelled by a consistent mass approach having six degrees of freedom at each node. The base isolator carries the ver-tical load without undergoing verver-tical deformation. Lead rubber
bearing (LRB) and High damping rubber bearing (HDRB) are used as isolation devices. The structural system is excited in x and y directions by two components of earthquake ground motions at East–west and North–south directions respectively. Nonlinear dynamic analysis has been carried out for both FB and BI structure using SAP2000[48].
2.1. Design of isolators
The HDRB and LRB isolators are designed as per the procedure mentioned by Kelly[49], Kelly et al.[50], and Naeim[51]. In this re-search, a computer code ISODNG09, has been generated to iteratively design both the isolators. The total seismic weight, dimensions, layer thickness and number of layers of bearings are considered as initial input. The isolator parameters such as post elastic stiffness, high ini-tial stiffness, yield strength, post yield stiffness ratio and effective damping are computed using the above code. These parameters are then defined in SAP2000. The bearings are linked at the bottom of each column. The detailed sequential procedure for the design of both isolators is shown in aflow chart (Fig. 2). The higher shear strain limit for HDRB results in smaller plan size compared to LRB. Due to the large vertical stiffness of HDRB it can carry heavy loads from the structure [6]. For the present study, interior columns are isolated using HDRB and exterior columns are supported by LRB. Dynamic analysis of the three dimensional building has been carried out con-sidering the associated nonlinearities.
2.2. LRB isolator
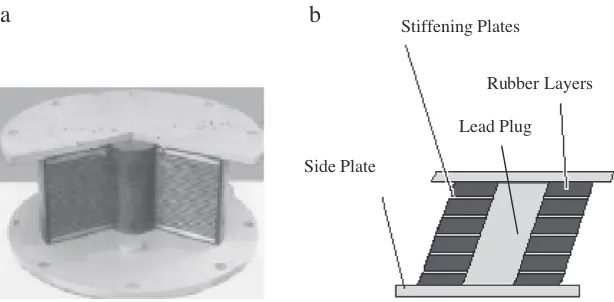
LRB is formed by force-fitting the lead plug into a preformed hole in the low damping elastomeric bearing as shown inFig. 3. The steel plates force the lead plug to deform in shear. Performance of LRB is maintained during repeated strong earthquakes with proper durabil-ity and reliabildurabil-ity. LRB produces the required amount of damping and has higher initial stiffness. The behaviour of LRB is influenced by yield capacity of the lead core, horizontal stiffness of the lead core and hor-izontal stiffness of the elastomer. The non-linear behaviour of the iso-lator is modelled considering the approach suggested by Nagarajaiah et al.[52]. The hysteresis loop for LRB is shown inFig. 5a.
2.3. HDRB isolator
[image:2.595.147.457.550.729.2]The HDRB isolator consists of thin layers of high damping rubber and steel plates built in alternate layers as shown inFig. 4. Horizontal stiffness of bearing is controlled by low shear modulus of elastomer while steel plates provide high vertical stiffness as well as prevents
Choose Damping ratio and Isolator Period
Calculate Hysteresis area, Bearing Force and Damping Coefficient
Check for Displacement Define Material
Properties
Define seismic input and loading on bearing
Define Bearing
types
LRB
Set assumed bearing dimensions
Calculate bearing properties for assumed dimensions
Choose Characteristic Strength
Check buckling and strain
Find Shear modulus from Rubber Properties
Adjust Shear Modulus and Stiffness
Calculate stiffness, Yield Force, Yield Displacement
Change Bearing Dimensions, if necessary
Choose Yield Displacement
Choose Shear modulus adjusting strain
Calculate stiffness, Yield Force
Check buckling and strain
Change Bearing Dimensions, if necessary
Calculate Spectral displacement and Spectral Acceleration
Define Isolator Period & Thickness
Choose Damping ratio or Calculate
Calculate Hysteresis area, Bearing Force and Damping Coefficient
Calculate strain and adjust Shear modulus
Calculate Spectral displacement and Spectral Acceleration
Check for Displacement Calculate seismic performance for DBE and MCE
Calculate load capacity under maximum displacements
Adjust bearing dimensions at step “Set assumed bearing dimensions” and iterate again, if necessary
HDRB
[image:3.595.140.450.50.541.2]Get Design Properties
Fig. 2.Designflow chart of isolator properties.
Lead Plug
Stiffening Plates
Rubber Layers
Side Plate
a
b
[image:3.595.140.447.577.728.2]bulging of rubber. High vertical stiffness of the bearing has no effect on the horizontal stiffness. The damping in the bearing is increased by adding extra-fine carbon block, oils or resins and other suitable fillers. The dominant feature of HDRB system is the parallel action of spring and viscous damping. The damping in the isolator is neither viscous nor hysteretic, but somewhat in between. HDRB isolator has lower horizontal stiffness which causes higher natural period of the structure. The stiffness and energy dissipation characteristics for HDRB are highly nonlinear and depend on shear strain as shown (Fig. 5b). The force-deformation behaviour of the HDRB isolator is considered as nonlinear force displacement hysteresis. The hysteresis loop area is obtained from the shear strain corresponding to shear modulus and damping.
2.4. Static analysis
The isolators are designed considering earthquake and wind loads to be static. The procedure mentioned in Bangladesh standard BNBC, 1993 [53]to compute static loads due to earthquake and wind is considered. Lateral loads for the building located in Dhaka, Bangladesh are deter-mined consideringZ(seismic zone factor),R(response modification factor),C(coefficient for soil profile) andI (importance factor). The base shear due to earthquake and wind can be calculated using Eqs.(1) and (3)respectively.
Base shear¼ZIC
R W ð1Þ
C¼1:25S
T2=3 ð2Þ
where,S= soil structure interaction,T= time period of structure and W= effective weight of structure
qz¼CCCICZVb
2
ð3Þ
where,qz= sustained wind pressure at height‘z’kN/m2,CC= velocity to pressure conversion = 47.2 × 10⁻⁶,CI= structure importance coef-ficient, CZ= combined height and exposure coefficient, Vb= basic wind speed at km/h,
Pz¼CGCpqz ð4Þ
Pz= design wind pressure at height‘z’kN/m2,CG= gust coefficient andCp= pressure coefficient.
2.5. Nonlinear dynamic analysis
Non-linear dynamic analysis has been carried out considering a typical bi-directional ground motion recorded at Dhaka, Bangladesh. Finite element analysis package SAP2000 is found to be more appro-priate for the current study. The governing equations of motion are obtained considering equilibrium of all forces at each degree of free-dom. The equations of motion for super structure and isolated base are written in Eq.(5).
M
½ fy_þ€ybg þ½ Cf g þy_ ½ Kf g ¼y −½ M Tg h i
€
yg n o
ð5Þ
where, [M], [K] and [C] are the mass, damping and stiffness matrices of the superstructure respectively; {y} is displacement of super struc-ture; {yb} and {ÿg} are base displacement and acceleration relative to the ground; [Tg] is the earthquake influence coefficient matrix.
a
b
[image:4.595.142.462.55.183.2]Rubber Layers
Side Plate
Fig. 4.High damping rubber bearing: a) geometry and b) deformation due to loading.
F
b)
HDRB
a)
LRB
Δ
maxK
u=k
rF
maxEDC
Δ
EDC
Δmax αKr
Fmax F
Fy
Qd
Ku KeffKu
Δy Δ
[image:4.595.42.519.464.729.2]All nonlinearities are restricted to the base isolator elements only. The above dynamic equilibrium equations considering the super structure as elastic and base isolator as nonlinear can be written as:
My t€ð Þ þCy t_ð Þ þKLy tð Þ þrNð Þ ¼t r tð Þ ð6Þ
whereKLis the stiffness matrix for the linear elastic super structure;C is the proportional damping matrix;Mis the diagonal mass matrix;rN is the vector of forces from nonlinear degrees of freedom in the isola-tor elements;y,y_, andÿare the relative displacement, velocity and acceleration with respect to ground;ris the vector of applied loads.
The effective stiffness at nonlinear degrees of freedom is arbitrary, but varies between zero and the maximum stiffness of that degree of freedom. The equilibrium equation can be rewritten as
My t€ð Þ þCy t_ð Þ þKLy tð Þ þrNð Þ ¼t r tð Þ−½rNð Þt −KNy tð Þ ð7Þ
whereK=KL+KN;KL= stiffness matrix of all linear elements,KN= stiffness matrix for all of the nonlinear degrees of freedom.
2.6. Solution technique
Fast nonlinear analysis (FNA) technique suggested by Wilson[54] has been considered for solution of equilibrium equations. The meth-od is extremely efficient as it is designed for structural systems which are primarily linear-elastic, but have limited number of predefined nonlinear elements. For the FNA method, all nonlinearities are re-stricted to the isolator elements. The site specific time history load is applied quasi-statically with high damping. The FNA considers a ramp type of time history function which increases linearly from zero to one over a length of time. The nonlinear modal equations are solved iteratively in each time step. The program considers that the analysis results vary during a time step. The iterations are carried out until the solution converges. If convergence cannot be achieved, the program divides the time step into smaller sub steps and tries again.
3. Numerical study
A 10 storey building situated at Dhaka, Bangladesh is considered for the present study. The building is in seismic zone 2 and soft to medium stiff soil as per Bangladesh national building code (BNBC 1993). It is a moment resisting framed structure consisting of 4 bays having spacing 7.62 m c/c in both directions as represented inFig. 6. The material and geometric properties considered are f'c = 28 MPa, fy= 414 MPa, dead load (excluding self-weight) = 4.8 kPa, live load= 2.4 kPa, slab thickness = 150 mm, all exterior corner columns 750 mm× 750 mm, all exterior middle columns 950 mm× 950 mm, all interior columns 1000 mm× 1000 mm. LRB and HDRB have been assigned for exterior and interior columns respectively. Shear modulus, ultimate elongation, elastic modulus and material constant of rubber have been selected as 400 kPa, 650%, 1350 kPa and 0.87 respectively. 40 mm thick steel plates are attached at two sides of each bearing. Non-linear unloading stiffness is 9.39 kN/mm for LRB and 28.87 kN/mm for HDRB. Whereas the corre-sponding Yield strengths are 155.93 kN and 586.69 kN.
The vertical loads from static analysis are used to design the base isolators (Table 1). The earthquake loads on the bearing obtained from the dynamic analysis of base isolated (BI) building are used to check the roll-out condition of base isolators. The designed diameter of LRB and HDRB is 800 and 950 mm respectively. Their cross section is given inFig. 7. The HDRB isolator is defined by plan size and rubber layer configuration. In addition to plan size and rubber later the LRB isolator has lead core.
For static analysis of thefixed based (FB) building seismic loads are calculated as per BNBC 1993. For isolated building response mod-ification factor and importance coefficient is RI= 2.0 and I = 1.0 re-spectively[49].Table 1shows results of static analysis. Since there is a lack of earthquake record of Dhaka, in the present study the Natore earthquake record is used to generate acceleration time histo-ry for the Dhaka earthquake[7,55]. The particulars for the Natore earthquake are Station ID: ALTUS S/N 2928, Channel 1, 6th Jan 2009 16:04:03 (GMT), Magnitude 4.0. The acceleration time history for the Dhaka earthquake has been illustrated inFig. 8. Non-linear dy-namic time domain analysis is performed using time history of the Dhaka EQ for both x and y directions. The local building construction codes BNBC used in this research are comparable and up to mark with the national as well as international standards. Each building model
4span @ 7.62m both ways
X Y
[image:5.595.137.361.495.731.2]Z
and damping system configuration is analysed for 30 s durational earthquake. The Newmark-beta time integration approach has been adopted for solution in time domain. The time step used for numeri-cal integration is 0.005 s.
4. Results and discussion
4.1. Static analysis
[image:6.595.41.290.74.182.2]The results of static analysis of FB and BI building are shown in Table 1 and Table 2respectively. The design base shear of earthquake loading is greater as compared to that of wind loading. Therefore, the building and isolators are designed for seismic load and checked for wind loads. Lateral load due to wind is approximately 3% of building weight. It satisfies one of the conditions for base isolation i.e. lateral load due to wind should be less than 10% of building weight[49]. The design base shear and moment for FB building is 3936 kN and 89523 kN-m respectively. The maximum displacement at top story for BI building is 88.5 mm. In case of BI building the isolators absorbs the seismic load and displaces by 72.8 mm. The lateral loads for wind cause a relative displacement of 1.6 mm at top story. Due to wind loads, the isolator displaces by 52.2 mm using the axial loads on inte-rior and exteinte-rior columns for which the isolators are designed.Table 3 shows the designed results of LRB and HDRB base isolators. The diam-eter of LRB isolator is 800 mm. The HDRB isolator is slightly larger having a diameter of 950 mm. All other parameters such as layer thickness, number of layers, height and shape of both isolators are same.
4.2. Free vibration analysis
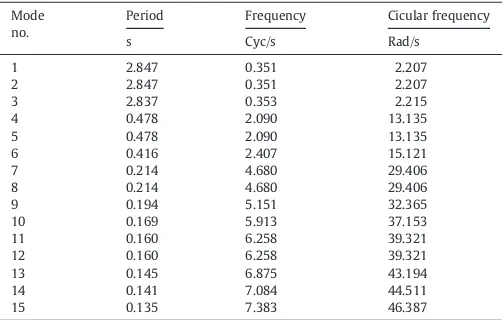
[image:6.595.43.290.282.477.2]Natural time periods or natural frequencies are the important characteristics of a structure. It can be used to analyse the results obtained by dynamic analysis. To evaluate natural frequencies, free vi-bration analysis of both FB and BI buildings has been carried out. The nonlinearities of base isolators have been considered appropriately for BI buildings.Tables 4–7show thefirst 15 natural time periods, natural frequencies and modal accelerations of FB and BI buildings respectively. Thefirst time period of the FB building is 0.9132 s whereas the BI build-ing is havbuild-ing 2.847 s. The natural frequency associated with the buildbuild-ing on seismic isolator is far lower than the corresponding frequency for the conventional fixed based foundation. The frequency is shifted to 0.35 Hz, which is in the target range of 0.3–0.5 Hz[2]. Thefirst mode maximum acceleration has been reduced from 29.77 cm/s2 to 9.768 cm/s2which is only one third of the former value. Results also show that thefirst global modes for non-isolated foundations are main-ly rocking modes, whereas in the case of seismic isolation they are Table 1
Static analysis results (FB building).
Parameter Value
Design base shear (EQ load) 3936 kN Design base shear (Wind load) 2829 kN Design base moment (EQ load) 89,523 kN-m Design base shear (wind load) 48,547 kN-m Maximum top story displacement (EQ load) 58.9 mm Maximum Top story Displacement (Wind load) 35.6 mm Base displacement (EQ and wind load) 0 Total weight of building 127,754 kN Governing axial load on interior column 7215 kN Governing axial load on exterior column 4546 kN
12 mm
40mm
240mm
160mm 10mm
16 layers each of 10mm
[image:6.595.147.457.505.728.2]40mm
Fig. 7.Vertical section of HDRB (diameter 950 mm) and LRB (diameter 800 mm).
associated to pure translation movements. It is also noted that the shift of natural vibration period of an isolated system points out that base isolation provides moreflexible isolated system.
As the structural time period is less than 1.0 unit, seismic base shear is larger than base shear for wind and this wind induced lateral force is less than 10% of seismic weight of the building. Therefore, the incorporation of isolator is feasible for the structure.
4.3. Dynamic analysis
Dynamic analysis in time domain has been performed for FB and BI structures. Responses of both types of structures are obtained in x and y directions. The time histories obtained are maximum base shear, overturning moment and displacements. Then, the results of FB and BI structures are compared with each other. It demonstrates the advantages of the BI structure over the FB structure.
4.3.1. Responses of the FB structure
Table 8describes the obtained result from the dynamic analysis of conventionalfixed base building structure. Parameter wise compari-son has been shown in the subsequent sections.
4.3.1.1. Base shear time history.Time histories of base shear in x and y directions for the FB building subjected to Dhaka earthquake are shown inFig. 9. In the x-direction, the response reflects minor oscilla-tions and it continues more or less in same pattern up to 10 s until a
sudden shoot up occurs at 10 s. The maximum base shear peak occurs at 2365 kN in the negative direction. In the case of the y-direction, both negative and positive peaks occur between 12 and 13 s. The os-cillation then reduces to 15–25% of the earthquake ground excitation. It is also noticeable that the maximum positive base shear value is 1730 kN. It occursfirst, whereas the negative base shear occurs 1 s later with a 5% lower value. The analysis represents the maximum lat-eral base shear force asV= 2365 kN in the x-direction and 1730 kN in the y-direction. Here the y-directional value is 17% lower than that of the x-direction.
[image:7.595.302.554.76.236.2]4.3.1.2. Overturning moment time history.Overturning moment is an important design criterion for buildings subjected to seismic loading. It is the product of base shear and the lever arm of lateral forces. Fig. 10shows the time histories of overturning moment for the FB building. In comparison with the base shear response, the overturn-ing moment represents a quite similar trend of oscillation. In the x di-rection the maximum positive base moment value is 19,740 kN-m. It occursfirst whereas the maximum negative value occurs 1 s later with a 62% higher magnitude. In the y-direction, minor oscillations continue in same pattern up to 11 s and then the excitations are am-plified. Within 11 to 12 s both negative and positive peaks transpire. It is also noticeable that the positive peak base moment value 24,200 kN-m, crops upfirst while the negative is 5% lower occurring 1–1.5 s later. In the y-direction the maximum overturning moment is 24,800 kN. It occurs in the positive direction. The analysis predicts a maximum moment of 32,120 kN-m in the x-direction and Table 2
[image:7.595.34.286.77.130.2]Static analysis results (BI building). Top story displacement (mm) Isolator displacement (mm) Total structure drift (mm) Displacement (EQ load) 88.5 72.8 15.7 Displacement (wind load) 53.8 52.2 1.6
Table 3
Dimensions of designed isolators.
Bearing dimensions LRB HDR Plan dimension (mm) 800 950 Layer thickness (mm) 10 10
No. of layers 16 16
Lead core size (mm) 150 –
Shape Circular Circular
[image:7.595.32.285.171.241.2]Total height (mm) 240 240
Table 4
Free vibration analysis result (FB building). Mode
no.
Period Frequency Cicular frequency
s Cyc/s Rad/s
1 0.913201 1.095 6.8804 2 0.913201 1.095 6.8804 3 0.820971 1.2181 7.6534 4 0.305778 3.2703 20.548 5 0.305778 3.2703 20.548 6 0.277169 3.6079 22.669 7 0.169141 5.9122 37.148 8 0.169141 5.9122 37.148 9 0.156279 6.3988 40.205 10 0.112683 8.8745 55.76 11 0.109486 9.1335 57.388 12 0.109486 9.1335 57.388 13 0.106621 9.379 58.93 14 0.106621 9.379 58.93 15 0.100209 9.9791 62.701
Table 5
Free vibration analysis result (BI building). Mode
no.
Period Frequency Cicular frequency
s Cyc/s Rad/s
1 2.847 0.351 2.207
2 2.847 0.351 2.207
3 2.837 0.353 2.215
4 0.478 2.090 13.135
5 0.478 2.090 13.135
6 0.416 2.407 15.121
7 0.214 4.680 29.406
8 0.214 4.680 29.406
9 0.194 5.151 32.365
10 0.169 5.913 37.153
11 0.160 6.258 39.321
12 0.160 6.258 39.321
13 0.145 6.875 43.194
14 0.141 7.084 44.511
[image:7.595.272.548.583.743.2]15 0.135 7.383 46.387
Table 6
Modal acceleration for varying Period (FB building).
Period Acceleration Acceleration s x-Direction (cm/s2
) y-Direction (cm/s2
)
0.913201 29.77 8.935
0.913201 29.77 8.935
[image:7.595.35.282.584.744.2]24,800 kN-m in the y-direction. The self-weight of the structure plays a vital role in stabilizing the building against the overturning mo-ment. The overturning moment is larger in the y-direction because it results from maximum base shear in the x-direction.
4.3.1.3. Acceleration response.Floor acceleration plays a vital role for structural analysis as it outputs the building inertial load for different levels. Once the mass is known for a level the inertia load can be de-termined through simple linear calculation. In contrast to the relative displacement response, thefloor accelerations are found to be more sensitive to impact occurrences. Acceleration histories for the FB building are demonstrated inFig. 11. The transitional larger oscilla-tion for the topfloor acceleration is from the 11 to 15 second region of the excitation history in the x-direction. In the y-direction the vac-illation pattern is also effective for the similar transition area but more peaks are larger here and the average of this region is high as well. The peakfloor acceleration at the top is 0.215 g in the x-direc-tion which is about 40% greater and 0.122 g in the y-direcx-direc-tion which is about 25% greater than the input Dhaka earthquake ground excitation. This shows that with increasing height the acceleration is also increased due to the seismic impact on the building structure.
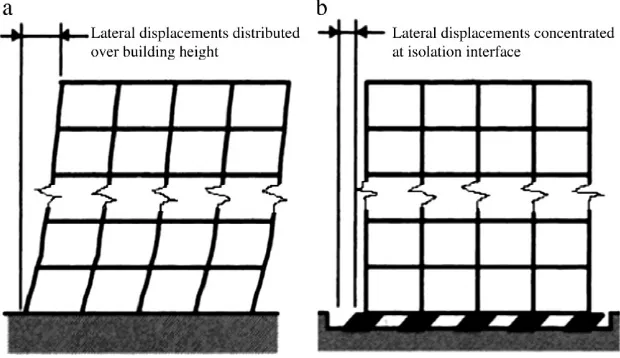
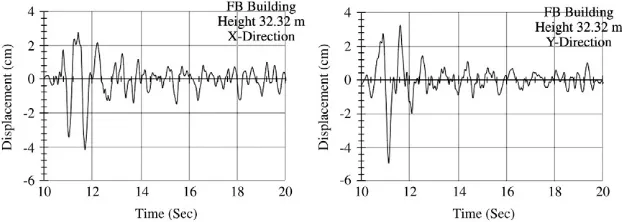
4.3.1.4. Displacement response.The structure displaces laterally due to earthquake excitation.Fig. 12shows the displacement time histories at the top level of the FB building under the selected Dhaka earth-quake. It is observed that the topfloor displacement oscillates be-tween +2.9 and−4.3 cm in the x-direction. In the y-direction the displacementfluctuates between −4.9 and +3.4 cm in the 12 to 13 second zones. This phenomenon is expected as displacement is proportional to the lateral force. It is clearly evident from the FB case that with support the lateral displacement is zero. Maximum dis-placement of the topfloor resembles total structural drift which is 4.3 cm in the x-direction and 4.9 cm in the y-direction respectively. Displacement in the y-direction is 14% higher compared to the dis-placement in the x-direction. The structure deforms from zero at the base to maximum sway at the topfloor in a parabolic pattern as shown inFig. 1a.
4.3.1.5. Statistical analysis.Table 9shows the results of statistical anal-ysis of the FB building. The maximum, minimum, mean, standard de-viation and root mean square values of base shear, overturning moment,floor acceleration andfloor displacement respectively are evaluated. The maximum base shear and overturning moment values are 2365 kN and 32,120 kN-m respectively. It occurs in the negative x-direction. The valuesfluctuate with a standard deviation of 284.65 and 3706.58 respectively. The FB building has a maximum displace-ment of 4.9 mm at the top
4.3.2. Responses of BI structure
The bearings designed are linked at the bottom of the respective columns at base level of the building to ensure all the properties in the spring. The structure with isolators is then analysed again for time domain. The evidences in Tables 10–11 have been attained from dynamic analysis of the BI building.
4.3.2.1. Base shear time history.The time histories for base shear of the BI building are illustrated inFig. 13. The analysis executes the collapse of the structure to occurred at V= 363 kN in the x-direction and 651 kN in the y-direction. Peak base shear reduces drastically com-pared to the FB structure which fulfils the demand of isolating the su-perstructure. It is clear that for the isolated building base shear reduces by up to 43% of the corresponding base shear offixed value. It predicts a good amount of structural savings and economic assis-tances as well.
[image:8.595.41.294.77.236.2]4.3.2.2. Overturning moment time history.Accordingly inFig. 14 over-turning moment corresponding to the BI building is presented. The breakdown forecasts the ultimate moment capacityM= 12,510 kN-m in the x-direction and 11,260 kN-m in the y-direction to prevent col-lapse. Overturning base moment reduces by up to 35% of thefixed foun-dational base moment. So the building becomes more stabilized compared to the FB structure. The building experiences moreflexibility even when using the same structural element configuration. Allowance Table 7
Modal acceleration for varying period (BI building).
Period Acceleration Acceleration s x-Direction (cm/s2
) y-Direction (cm/s2
)
2.847212 9.768 2.932
2.847212 9.138 2.743
2.836714 9.285 2.787
0.478372 46.05 13.821 0.478372 44.588 13.382
0.41553 45.13 13.545
[image:8.595.41.293.276.347.2]0.213669 46.059 13.823 0.213669 44.803 13.446 0.194135 45.23 13.575 0.169118 45.96 13.794 0.15979 45.931 13.785 0.15979 45.834 13.756 0.145465 45.93 13.785 0.14116 45.961 13.794 0.135452 45.864 13.765
Table 8
Dynamic analysis results (FB buildings).
Parameter Time domain analysis value Design base shear (kN) in the x-direction 2365
Design base shear (kN) in the y-direction 1730 Design base moment (kN-m) in the x-direction 32,120 Design base moment (kN-m) in the y-direction 24,800 Top story displacement in x-direction (cm) 4.3 Top story displacement in the y-direction (cm) 4.9
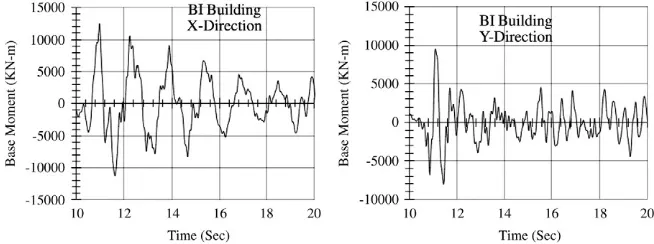
[image:8.595.136.467.611.729.2]of translational movements of support abruptly changes the pattern of whole structure deformation like inFig. 1b.
4.3.2.3. Acceleration response.Acceleration time histories for the seis-mically isolated building are given inFig. 15for the top and base of the structure. The peakfloor accelerations in this case at the top are
[image:9.595.124.458.55.177.2] [image:9.595.131.454.209.326.2]0.159 g in the x-direction which is about 5% greater and 0.095 g in the y-direction which is about 5% lower than the input ground excita-tion. For the isolationflexibility the structure experiences a mention-able amount of acceleration at the base also that is valued as 0.12 g in the x-direction and 0.08 g in the y-direction. For the isolated building peak, acceleration at the top floor reduces by up to 74% of the Fig. 11.Acceleration time history in x and y directions (fixed based case).
Fig. 10.Base moment in x and y directions (fixed based case).
Fig. 12.Displacement time history in x and y directions (fixed based case).
Table 9
Statistical analysis results of time domain responses (FB building). structural parameter Direction Fixed
Maximum Minimum Mean Standard deviation Root mean square Base shear (kN) x 1506 2365 −0.03957 284.6573 284.5625
y 1730 1649 0.268015 262.4023 262.315
Base moment (kN-m) x 19,740 32,120 −4.19639 3706.582 3705.349 y 24,800 23,060 −6.27736 3937.748 3936.441 Top point acceleration (cm/s2
) x 129 211 −0.00454 20.91838 20.91141
y 120 118 −0.00148 20.56363 20.55678
Base acceleration x – –
y – –
Top point displacement (cm) x 2.9 4.3 −0.00057 0.545929 0.545748
y 3.4 4.9 0.00459 0.721892 0.721666
Base displacement (cm) x – –
[image:9.595.137.448.357.468.2] [image:9.595.37.552.609.743.2]corresponding top point acceleration of thefixed one. The isolated building exerts a good amount of acceleration at the base. But for the fixed one, at base, there is a null acceleration excitation and displacement.
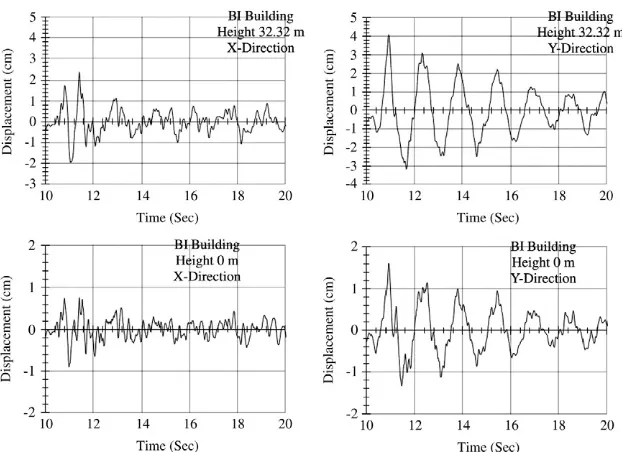
4.3.2.4. Displacement response.Time histories of displacement for the BI building are shown inFig. 16for the top and base of the structure. In case of isolation the isolator itself moves laterally. So, there is also mentionable lateral movement in the joint/support at base level. It is observed that the peak displacement of the topfloor is 2.5 cm in the x-direction and 4.2 cm in the y-direction whereas the values at the base level are 0.8 cm and 1.7 cm respectively. Here total structure drifts come to 1.7 cm in the x-direction and 2.5 cm in the y-direction significantly lower than that in the FB case. In case of isolation the iso-lator itself moves laterally while displacement is zero for the FB build-ing. So, total structural drift is lesser than that of thefixed based case. For the isolated structure, the displacement of both the superstruc-ture and isolator increases as the superstrucsuperstruc-ture becomes morefl ex-ible. This trend is true for static, free vibration and time domain
analysis. The peak top displacement reduces by up to 35% of the fixed foundational lateral movement. Magnitudes of displacement history indicate that the base isolator absorbs most of the displace-ment of the superstructure.
4.3.2.5. Statistical investigation.Table 12shows the statistical study of the BI structure for nonlinear dynamic behaviour. It includes base shear, overturning moment,floor acceleration andfloor displacement with their maximum and minimum values and mean, standard devi-ation, root mean square values as well.
The acceleration responses reduce significantly in the base-isolated building compared to the original building as expected. The base shears in each direction are decreased compared to thefixed building. On the other hand, as regards the building response in terms of displacements, the maximum horizontal displacements eval-uated at the foundation level were well below the expected static de-sign displacement of isolators.
Peak base shear reduces significantly compared to the FB structure as expected, which fulfils the demand of isolating superstructure. The reduction of overturning base moment due to isolation indicates that the building becomes more stabilized compare to the FB structure.
[image:10.595.41.294.76.138.2]4.3.2.6. Influence of nonlinear automated simulation.Consideration of nonlinearity of base isolation exerts actual behaviour of the isolating elements and their upshot on the structural responses. The selected automated simulation includes the precise modelling and analysis in a consistent manner. Automated fast nonlinear analysis is found to be efficient requiring very less time but it offers precise solution. Iso-lating strategy predicts well amount of structural savings and also economic assistances as well. The building experiences additional flexibility even using same structural elements configuration. Allow-ance of transitional movements of support abruptly changes the pat-tern of whole structure deformation. As a concluding remark, for applications like the medium rise building structures in soft to medi-um stiff soil of Dhaka, where the main concern is the mitigation of the seismic excitation at the supports of critical components, a base isola-tion is to be viably recommended.
[image:10.595.40.295.178.230.2]Fig. 13.Base shear in x and y directions (isolated based case).
Table 10
Displacement output in dynamic analysis (BI building). Isolator displacement (mm)
[image:10.595.149.458.459.571.2]Total structure drift (mm) x-Direction (static analysis) 72.8 15.7 y-Direction (static analysis) 72.8 15.7 x-Direction (time domain analysis) 16.9 8.1 y-Direction (time domain analysis) 29.8 12.2
Table 11
Base Shear and base moment in dynamic analysis (BI building).
Parameter Time domain analysis value Design base shear (kN) in the x direction 363
Design base shear (kN) in the y direction 651 Design Base Moment (kN-m) in the x direction 12,510 Design base moment (kN-m) in the y direction 9523
[image:10.595.137.464.606.728.2]Fig. 15.Acceleration time history in x and y directions (isolated based case).
Fig. 16.Displacement time history in x and y directions (isolated based case).
Table 12
Statistical analysis results of time domain responses (BI Building). Structural parameter Direction Isolated
Maximum Minimum Mean Standard deviation Root mean square Base shear (kN) x 363 306 0.7575748 69.668 69.648909
y 546 651 −0.85059 131.0317 130.9908
Base moment (kN-m) x 12,510 11,260 18.24944 2655.256 2654.434 y 9523 8041 9.170651 1648.975 1648.451 Top point acceleration (cm/s2
) x 94 156 −0.00272 16.43835 16.43287
y 93 73 −0.01663 15.31261 15.30752
Base acceleration (cm/s2
) x 87 117 0.006199 14.13679 14.13208
y 71 76 −0.00627 13.34395 13.3395
Top point displacement (cm) x 2.5 2.0 −0.00337 0.428622 0.428492
y 4.2 3.3 0.007431 0.847827 0.847577
Base displacement (cm) x 0.8 0.9 −0.00108 0.170408 0.170355
[image:11.595.37.551.610.743.2]5. Conclusion
Nonlinear time domain analyses under bi-directional earthquake history have been carried out. The performances of multi storey struc-tures isolated with the bearing systems are evaluated by Fast Nonlinear Analysis. The responses due to structural changes are accurately formu-lated to estimate responses of base-isoformu-lated structures. The results from the analyses, static, free vibration and time domain are obtained. The summarizedfindings are as follows.
1. The major effect of base isolation on the seismic response is by far the radical reduction of horizontal accelerations. It is observed that, on soft to medium stiff soil, the reduction of response peak accelerations at the support level is not far from ten times for iso-lators with respect to the case without base isolation. This com-parison was performed for foundations on soft to medium stiff soil, but similar conclusions could be drawn for any type of soil. 2. As regards the building response in terms of displacements, the
maximum horizontal displacements evaluated at the foundation level were well below the expected static design displacement of isolators.
3. Extensive sensitivity studies tofind the influence of various im-portant structural parameters of both isolator and superstructure on the behaviour of isolated structure are possible by the SAP module.
4. Both the displacement and acceleration responses of a super-structure without an isolator are much more sensitive while the displacement and acceleration responses of a superstructure with an isolator reduce significantly.
5. The base isolator is more effective to mitigate displacement than acceleration.
6. Peak base shear reduces significantly compared to the FB struc-ture which fulfils the demand of isolating superstructure. It pre-dicts well the amount of structural savings and also provides economic assistance.
7. There is a reliable reduction of overturning base moment than the fixed foundational base moment. So the building becomes more stabilized compared to the FB structure. The building experiences more flexibility even when using the same structural element configuration. Allowance of transitional movements of support abruptly changes the pattern of whole structure deformation. 8. For applications like the medium rise building structures in
Dhaka, where the main concern is the mitigation of the seismic excitation at the supports of critical components, a base isolation is to be viably recommended.
9. This investigation was based on free-field excitations in accor-dance with the site specific bilateral EQ data. For applications on buildings on soft soils where more significant long period excita-tions are to be taken into account, the design of the base isolation needs particular care, in order to avoid resonance effects. 10. In this case, the most effective choice appears that of HDRB and
LRB bearings, as resulting in a lower isolation frequency and then in lower peak accelerations, but the isolation choice should generally be based on the best compromise between the reduc-tion of floor accelerations and the amplification of building rigid-body displacements.
11. To accurately determine the collapse loads and acceleration– displacement behaviours of the structures, in the nonlinear time history analysis P−δeffects need to be considered as does the more true sketch be accessed.
Acknowledgement
The authors gratefully acknowledge the effort by the Bangladesh Earthquake Society and King Saud University, Deanship of Scientific Research, College of Engineering Research Center. The University of
Malaya funded the research work through the High Impact Research Grant D000002-16001.
References
[1] M. Ismail, J. Rodellar, F. Ikhouane, An innovative isolation device for aseismic de-sign, Engineering Structures 32 (2010) 1168–1183.
[2] I. Micheli, S. Cardini, A. Colaiuda, P. Turroni, Investigation upon the dynamic structural response of a nuclear plant on aseismic isolating devices, Nuclear Engi-neering and Design 228 (2004) 319–343.
[3] Rizwan Hussain Raja, Ishida Tetsuya, Computer-aided oxygen transport model of mass and energy simulation for corrosion of reinforced steel, Automation in Con-struction 20 (5) (2011) 559–570.
[4] A.B.M.S. Islam, M. Jameel, M.Z. Jumaat, Seismic Base Isolation for Buildings in Re-gions of Low to Moderate Seismicity: A Practical Alternative Design, Practice Pe-riodical on Structural Design and Construction, ASCE, 2010, doi:10.1061/(ASCE) SC.1943-5576.0000093, Published online at 22 December.
[5] A.B.M.S. Islam, M. Jameel, M.A. Uddin, S.I. Ahmad. Simplified design guidelines for seis-mic base isolation in multi-storey buildings for Bangladesh National Building Code (BNBC), International Journal of the Physical Sciences 6 (23) (2011) 5467–5486. [6] A.B.M.S. Islam, S.I. Ahmad, T.M. Al-Hussaini, Effect of isolation on buildings in
Dhaka, BES, 3 rd International Earthquake Symposium, Bangladesh, Dhaka, 2010, pp. 465–472.
[7] R.R. Hussain, A.B.M.S. Islam, S.I. Ahmad, Base Isolators as Earthquake Protection Devices in Buildings, First ed VDM Publishing House Ltd. Benoit Novel, Simulta-neously published in USA & U.K, 2010.
[8] A.B.M.S. Islam, M. Jameel, M.Z. Jumaat, Seismic isolation in buildings to be a prac-tical reality: behaviour of structure and installation technique, Journal of Engi-neering and Technology Research 3 (4) (2011) 97–117.
[9] A.B.M.S. Islam, M. Jameel, M.Z. Jumaat, Study on optimal isolation system and dy-namic structural responses in multi-story buildings, International Journal of the Physical Sciences 6 (9) (2011) 2219–2228.
[10] A.B.M.S. Islam, S.I. Ahmad, M. Jameel, M.Z. Jumaat, Study on corollary of seismic base isolation system on buildings with soft story, International Journal of the Physical Sciences 6 (11) (2011) 2654–2661.
[11] F. Kozin, H.G. Natke, System identification techniques, Structural Safety 3 (1986) 269–316.
[12] R. Jangid, T. Datta, Performance of base isolation systems for asymmetric building subject to random excitation, Engineering Structures 17 (1995) 443–454. [13] R.S. Jangid, Optimum lead-rubber isolation bearings for near-fault motions,
Engi-neering Structures 29 (2007) 2503–2513.
[14] C.P. Providakis, Effect of LRB isolators and supplemental viscous dampers on seis-mic isolated buildings under near-fault excitations, Engineering Structures 30 (2008) 1187–1198.
[15] A. Dall'Asta, L. Ragni, Experimental tests and analytical model of high damping rubber dissipating devices, Engineering Structures 28 (2006) 1874–1884. [16] A. Dall'Asta, L. Ragni, Nonlinear behaviour of dynamic systems with high damping
rubber devices, Engineering Structures 30 (2008) 3610–3618.
[17] A.R. Bhuiyan, Y. Okui, H. Mitamura, T. Imai, A rheology model of high damping rubber bearings for seismic analysis: identification of nonlinear viscosity, Interna-tional Journal of Solids and Structures 46 (2009) 1778–1792.
[18] F. Casciati, Stochastic dynamics of hysteretic media, Structural Safety 6 (1989) 259–269.
[19] R. Clough, J. Penzien, Dynamics of Structures, 2nd ed McGraw-Hill, 1993. [20] A.J. Carr. An introduction to seismic isolation : by R.I. Skinner, W.H. Robinson and
G.H. McVerry, Wiley, Chichester, 1993, ISBN 0 471 93433 X, Structural Safety 1994; 14: 219–20.
[21] S.L. Dimova, A. Elenas, Seismic intensity parameters for fragility analysis of struc-tures with energy dissipating devices, Structural Safety 24 (2002) 1–28. [22] V.A. Matsagar, R.S. Jangid, Influence of isolator characteristics on the response of
base-isolated structures, Engineering Structures 26 (2004) 1735–1749. [23] W. Hong, H. Kim, Performance of a multi-story structure with a resilient-friction
base isolation system, Computers and Structures 82 (2004) 2271–2283. [24] A. Baratta, I. Corbi. Optimal design of base-isolators in multi-storey buildings,
Computers & Structures 82 (2004) 2199–209.
[25] V.K. Agarwal, J.M. Niedzwecki, J.W. Van de Lindt, Earthquake induced pounding in friction varying base isolated buildings, Engineering Structures 29 (2007) 2825–2832.
[26] P. Komodromos, S. Stiemer, Seismic isolation for earthquake resistant structures, Applied Mechanics Reviews 54 (2001) B112.
[27] P. Komodromos, P. Polycarpou, L. Papaloizou, M. Phocas, Response of seismically isolated buildings considering poundings, Earthquake Engineering and Structural Dynamics 36 (2007) 1605–1622.
[28] P. Komodromos, Simulation of the earthquake-induced pounding of seismically isolated buildings, Computers and Structures 86 (2008) 618–626.
[29] C. Loh, C. Lin, C. Huang, Time domain identification of frames under earthquake loadings, Journal of Engineering Mechanics 126 (1999) 693.
[30] L.-Y. Lu, G.-L. Lin, Predictive control of smart isolation system for precision equip-ment subjected to near-fault earthquakes, Engineering Structures 30 (2008) 3045–3064.
[31] E.M. Güneyisi, G. Altay, Seismic fragility assessment of effectiveness of viscous dampers in R/C buildings under scenario earthquakes, Structural Safety 30 (2008) 461–480.
[33] C.C. Spyrakos, I.A. Koutromanos, C.A. Maniatakis, Seismic response of base-isolated buildings including soil-structure interaction, Soil Dynamics and Earth-quake Engineering 29 (2009) 658–668.
[34] K. Goda, C.S. Lee, H.P. Hong, Lifecycle cost–benefit analysis of isolated buildings, Structural Safety 32 (2010) 52–63.
[35] P.C. Polycarpou, P. Komodromos, Earthquake-induced poundings of a seismically isolated building with adjacent structures, Engineering Structures 32 (2010) 1937–1951.
[36] A. Pocanschi, M.C. Phocas, Earthquake isolator with progressive nonlinear deformability, Engineering Structures 29 (2007) 2586–2592.
[37] C. Balkaya, E. Kalkan, Nonlinear seismic response evaluation of tunnel form build-ing structures, Computers and Structures 81 (2003) 153–165.
[38] T. Ariga, Y. Kanno, I. Takewaki, Resonant behaviour of base-isolated high-rise buildings under long-period ground motions, The Structural Design of Tall and Special Buildings 15 (2006) 325–338.
[39] A. Olsen, B. Aagaard, T. Heaton, Long-period building response to earthquakes in the San Francisco Bay Area, Bulletin of the Seismological Society of America 98 (2008) 1047.
[40] K. Ebisawa, K. Ando, K. Shibata, Progress of a research program on seismic base isolation of nuclear components, Nuclear Engineering and Design 198 (2000) 61–74.
[41] M. Dicleli, S. Buddaram, Comprehensive evaluation of equivalent linear analysis method for seismic-isolated structures represented by sdof systems, Engineering Structures 29 (2007) 1653–1663.
[42] F. Casciati, K. Hamdaoui, Modelling the uncertainty in the response of a base iso-lator, Probabilistic Engineering Mechanics 23 (2008) 427–437.
[43] A. Di Egidio, A. Contento, Seismic response of a non-symmetric rigid block on a constrained oscillating base, Engineering Structures 32 (2010) 3028–3039.
[44] A. Sharma, R. Jangid, Behaviour of base-isolated structures with high initial isolator stiffness, International Journal of Applied Science, Engineering and Technology 5 (2009).
[45] V. Kilar, D. Koren, Seismic behaviour of asymmetric base isolated structures with various distributions of isolators, Engineering Structures 31 (2009) 910–921. [46] S. Wilkinson, R. Hiley, A non-linear response history model for the seismic
anal-ysis of high-rise framed buildings, Computers and Structures 84 (2006) 318–329. [47] CSI Computer & Structures Inc, SAP2000. Linear and Nonlinear Static and Dynam-ic Analysis of Three-dimensional Structures, Computer & Structures, Inc, Berkeley (CA), 2004.
[48] A. Habibullah, SAP 2000. Static and Dynamic Finite Element Analysis of Struc-tures, Computers and Structures Inc, Berkeley, California, 2005.
[49] T.E. Kelly, Base Isolation of Structures: Design Guidelines, Holmes Consulting Group Ltd, Auckland, 2001.
[50] T.E. Kelly, W.H. Robinson, R.I. Skinner, Seismic Isolation for Designers and Struc-tural Engineers, Robinson seismic Ltd., Wellington, 2006.
[51] F. Naeim, J. Kelly, Design of Seismic Isolated Structures: From Theory to Practice, Wiley, 1999.
[52] S. Nagarajaiah, A.M. Reinhorn, M.C. Constantinou, Nonlinear dynamic analysis of 3-D base-isolated structures, Journal of Structural Engineering 117 (1991) 2035–2054.
[53] Bangladesh National Building Code, BNBC, Bangladesh: Housing and Building Re-search Institute, Bangladesh Standard and Testing Institute, 1993.
[54] E. Wilson, Three-dimensional Static and Dynamic Analysis of Structures, 3rd ed Computers & Structures Inc, Berkeley, 2002.