All-fiber fourth and fifth harmonic generation
from a single source
M
UHAMMADI. M. A
BDULK
HUDUS,
1,2,*T
IMOTHYL
EE,
1F
RANCESCOD
EL
UCIA,
1C
OSTANTINOC
ORBARI,
1,3P
IERS
AZIO,
1P
ETERH
ORAK,
1ANDG
ILBERTOB
RAMBILLA11Optoelectronics Research Center, University of Southampton, Southampton, SO17 1BJ, UK 2Photonics Research Centre, Department of Physics, Faculty of Science, University of Malaya, 50603
Kuala Lumpur, Malaysia
3Renishaw plc, New Mills, Wotton-under-Edge, Gloucestershire, GL12 8JR, UK
Abstract: All-fiber fourth and fifth harmonic generation from a single source is demonstrated experimentally and analyzed theoretically. Light from a fully fiberized high power master os-cillator power amplifier is launched into a periodically poled silica fiber generating the second harmonic. The output is then sent through two optical microfibers that generate the third and fourth harmonic, respectively, via four wave mixing (FWM). For a large range of pump wave-lengths in the silica optical transmission window, phase matched FWM can be achieved in the microfibers at two different diameters with relatively wide fabrication tolerances of up to+/-5 nm. Our simulations indicate that by optimizing the second harmonic generation efficiency and the diameters and lengths of the two microfibers, conversion efficiencies to the fourth harmonic in excess of 25% are theoretically achievable.
Published by The Optical Society under the terms of theCreative Commons Attribution 4.0 License. Further distribution of this work must maintain attribution to the author(s) and the published article’s title, journal citation, and DOI.
OCIS codes: (190.2620) Harmonic generation and mixing; 190.4160) Multiharmonic generation; (190.4370) Nonlinear optics, fibers; (190.4410) Nonlinear optics, parametric processes; (190.4380) Nonlinear optics, four-wave mixing
.
References and links
1. D. N. Nikogosyan, Nonlinear Optical Crystals: A Complete Survey (Springer Science+Business Media, Inc, 2005). 2. V. P. Gapontsev, V. A. Tyrtyshnyy, O. I. Vershinin, B. L. Davydov, and D. A. Oulianov, “Third harmonic frequency generation by Type-I critically phase-matched LiB3O5crystal by means of optically active quartz crystal,” Opt. Express 21(3), 3715–3720 (2013).
3. Y. Kaneda, J. M. Yarborough, L. Li, N. Peyghambarian, L. Fan, C. Hessenius, M. Fallahi, J. Hader, J. V. Moloney, Y. Honda, M. Nishioka, Y. Shimizu, K. Miyazono, H. Shimatani, M. Yoshimura, Y. Mori, Y. Kitaoka, and T. Sasaki, “Continuous-wave all-solid-state 244 nm deep-ultraviolet laser source by fourth-harmonic generation of an optically pumped semiconductor laser using CsLiB6O10in an external resonator,” Opt. Lett. 33(15), 1705–1707 (2008). 4. D. A. V. Klinera, F. Di Teodorob, J. P. Koplowb, S. W. Mooreb, and A. V. Smith, “Efficient second, third, fourth,
and fifth harmonic generation of a Yb-doped fiber amplifier," Opt. Commun. 210(3), 393–398 (2002).
5. S. A. Slattery, D. N. Nikogosyan, and G. Brambilla, “Fiber Bragg grating inscription by high-intensity femtosecond UV laser light: comparison with other existing methods of fabrication,” J. Opt. Soc. Am. B 22(2), 354–361 (2005). 6. P.J. Campagnola and C.-Y. Dong, “Second harmonic generation microscopy: principles and applications to disease
diagnosis,” Laser Photonics Rev. 5(1), 13–26 (2011).
7. P. A. Champert, S. V. Popov, J. R. Taylor, and J. P. Meyn, “Efficient second-harmonic generation at 384 nm in periodically poled lithium tantalate by use of a visible Yb–Er-seeded fiber source,” Opt. Lett. 25(17), 1252–1254 (2000).
8. G.K. Samanta, S. Chaitanya Kumar, M. Mathew, C. Canalias, V. Pasiskevicius, F. Laurell, and M. Ebrahim-Zadeh, “High-power, continuous-wave, second-harmonic generation at 532 nm in periodically poled KTiOPO4,” Opt. Lett.
33(24), 2955–2957 (2008).
9. S.V. Popov, S.V. Chernikov and J.R. Taylor “6-W Average power green light generation using seeded high power ytterbium fiber amplifier and periodically poled KTP,” Opt. Commun. 174(1) 231–234 (2000).
#266610 http://dx.doi.org/10.1364/OE.24.021777
10. S. Chaitanya Kumar, G. K. Samanta, and M. Ebrahim-Zadeh “High-power, single-frequency, continuous-wave second-harmonic-generation of ytterbium fiber laser in PPKTP and MgO:sPPLT,” Opt. Express 17(16), 13711– 13726 (2009).
11. W. Margulis and U. Österberg, “Second-harmonic generation in optical glass fibers,” J. Opt. Soc. Am. B 5(2), 312–316 (1988).
12. N. Myrén, H. Olsson, L. Norin, N. Sjödin, P. Helander, J. Svennebrink, and W. Margulis, “Wide wedge-shaped depletion region in thermally poled fiber with alloy electrodes,” Opt. Express 12(25), 6093–6099 (2004). 13. V. Pruneri, G. Bonfrate, P. G. Kazansky, D. J. Richardson, N. G. Broderick, J. P. De Sandro, C. Simonneau, P.
Vidakovic, and J. A. Levenson “Greater than 20%-efficient frequency doubling of 1532-nm nanosecond pulses in quasi-phase-matched germanosilicate optical fibers,” Opt. Lett. 24(4), 208–210 (1999).
14. W. Margulis, O. Tarasenko, and N. Myrén “Who needs a cathode? Creating a second-order nonlinearity by charging glass fiber with two anodes,” Opt. Express 17(18), 15534–15540 (2009).
15. R. A. Myers, N. Mukherjee, and S. R. J. Brueck “Large second-order nonlinearity in poled fused silica,” Opt. Lett. 16(22), 1732–1734 (1991).
16. A. Canagasabey, C. Corbari, Z. Zhang, P.G. Kazansky, and M. Ibsen. “Broadly tunable second-harmonic generation in periodically poled silica fibers,” Opt. Lett. 32(13), 1863–1865 (2007).
17. A. Canagasabey, M. Ibsen, K. Gallo, A. V. Gladishev, E. M. Dianov, C. Corbari, and P. G. Kazansky “Aperiodically poled silica fibers for bandwidth control of quasi-phase-matched second-harmonic generation,” Opt. Lett. 35(5), 724–726 (2010)
18. C. Corbari, A. V. Gladishev, L. Lago, M. Ibsen, Y. Hernandez, and P. G. Kazansky “All-fiber frequency-doubled visible laser,” Opt. Lett. 39(22), 6505–6508 (2014).
19. E. L. Lim, C. Corbari, A V. Gladyshev, S. U. Alam, M. Ibsen, D. J. Richardson, and P. G. Kazansky, “Multi-watt all-fiber frequency doubled laser,” in Advanced Photonics, OSA Technical Digest (Optical Society of America, 2014), paper JTu6A.5.
20. V. Grubsky and A. Savchenko, “Glass micro-fibers for efficient third harmonic generation,” Opt. Express 13(18), 6798–6806 (2005).
21. T. Lee, Y. Jung, C.A. Codemard, M. Ding, N.G.R. Broderick, and G. Brambilla, “Broadband third harmonic gener-ation in tapered silica fibers,” Opt. Lett. 20(8), 8503–8511 (2012).
22. A. Coillet and P. Grelu “Third-harmonic generation in optical microfibers: from silica experiments to highly nonlin-ear glass prospects,” Opt. Commun. 285(16), 3493–3497 (2012).
23. M.I.M Abdul Khudus, T. Lee, P. Horak, and G. Brambilla, “Effect of intrinsic surface roughness on the efficiency of intermodal phase matching in silica optical nanofibers,” Opt. Lett. 40(7), 1318–1321 (2015).
24. M. I. M. Abdul Khudus, F. De Lucia, C. Corbari, T. Lee, P. Horak, P. Sazio, and G. Brambilla, “Phase matched parametric amplification via four-wave mixing in optical microfibers,” Opt. Lett. 41(4), 761–764 (2015). 25. A. C. Sodre, J. C. Boggio, A. Rieznik, H. Hernandez-Figueroa, H. Fragnito, and J. C. Knight, “Highly efficient
generation of broadband cascaded four-wave mixing products,” Opt. Express 16(4), 2816–2828 (2008).
26. A. V. Husakou and J. Herrmann, “Supercontinuum generation, four-wave mixing, and fission of higher-order soli-tons in photonic-crystal fibers,” J. Opt. Soc. Am. B 19(9), 2171–2182 (2002).
27. J.C. Boggio, S. Moro, B.P.-P. Kuo, N. Alic, B. Stossel, and S. Radic, “Tunable parametric all-fiber short-wavelength ir transmitter,” J. Lightwave Technol. 28(4), 443–447 (2010).
28. Y.H. Li, Y.Y. Zhao, and L.J. Wang, “Demonstration of almost octave-spanning cascaded four-wave mixing in optical microfibers,” Opt. Lett. 37(16) 3441–3443 (2012).
29. N.I. Nikolov, T. Sørensen, O. Bang, and A. Bjarklev, “Improving efficiency of supercontinuum generation in pho-tonic crystal fibers by direct degenerate four-wave mixing,” J. Opt. Soc. Am. B 20(11), 2329–2337 (2003). 30. G. Brambilla, “Optical fiber nanowires and microwires: a review,” J. Opt. 12, 043001 (2010).
31. V. Neustruev, “Colour centres in germanosilicate glass and optical fibers,” J. Phys. : Condens. Matter 6(35), 6901 (1994).
32. R. Kitamura, L. Pilon, and M. Jonasz, “Optical constants of silica glass from extreme ultraviolet to far infrared at near room temperature,” Appl. Opt. 46(33), 8118–8133 (2007).
33. L. Skuja, “Optically active oxygen-deficiency-related centers in amorphous silicon dioxide,” J. Non-Cryst. Solids 239(1), 16–48 (1998).
34. Y. Jung, G. Brambilla, and D.J. Richardson, “Optical microfiber coupler for broadband single-mode operation,” Opt. Express 17(7), 5273–5278 (2009).
35. T. Birks and Y.W. Li, “The shape of fiber tapers,” J. Lightwave Technol. 10(4), 432–438 (1992).
36. T. Sudmeyer, Y. Imai, H. Masuda, N. Eguchi, M. Saito, and S. Kubota, “Efficient 2nd and 4th harmonic generation of a single-frequency, continuous-wave fiber amplifier,” Opt. Express 16(3), 1546–1551 (2008).
37. G. Agrawal, Nonlinear Fiber Optics, 5th ed. (Academic Press, 2012).
38. S. Afshar and T.M. Monro, “A full vectorial model for pulse propagation in emerging waveguides with subwave-length structures part I: Kerr nonlinearity,” Opt. Express 17(4), 2298–2318 (2009).
39. D. Milam, “Review and assessment of measured values of the nonlinear refractive-index coefficient of fused silica,” Appl. Opt. 37(3), 546–550 (1998).
1. Introduction
Harmonic generation involves the generation of new frequencies which are multiples of a fun-damental frequency (FF) via nonlinear processes. Typically, harmonic generation is achieved with the use of a variety of nonlinear crystals [1], where second/fourth harmonic generation (SHG/FHG) is typically done by employing one/two second-harmonic-generating nonlinear crystals and third/fifth harmonic generation (THG/5HG) is obtained by sum frequency gen-eration between the fundamental/third harmonic frequency and the second harmonic frequency [2–4]. These methods allow for the generation of wavelengths inaccessible by conventional laser technology, and have widespread applications such as fiber Bragg grating inscription and microscopy [5, 6].
Fiber lasers, while providing the possibility of high peak powers, good modal properties and long interaction lengths, have generally only been employed as pump sources for harmonic generation [7–10]. Due to the lack of inversion symmetry in silica, efficient SHG cannot be observed in glass optical fibers, and it is only by using periodically poled silica fibers (PPSF) that broadband and high average power SHG conversion processes have been demonstrated [11–18]. Indeed, SHG via PPSF with efficiencies of up to 45% have been observed recently, opening the possibility of an all-fiber harmonic generation laser system [19]. The high nonlinearity of optical microfibers (OMF) has been proposed for intermodal third harmonic generation [20–22], but this experiences fundamental limitations imposed by detunings resulting from the intrinsic roughness of the OMF surface [23]. PPSF have also been used in conjunction with OMFs to achieve parametric amplification of∼25 dB at the third harmonic (TH) wavelength [24].
Here, all-fiberized FHG and 5HG from a single fiberized Erbium doped fiber source is demon-strated via a combination of quasi-phase-matched SHG and phase-matched four wave mixing (FWM).
2. Fourth and fifth harmonic generation via four wave mixing
Previous schemes for broadband generation in optical fiber primarily relied on higher order cascaded FWM, often working in conjunction with other nonlinear effects such as supercon-tinuum generation or soliton fission [25–27]. In OMFs, FWM over a bandwidth of nearly an octave has been demonstrated by pumping at the anomolous dispersion region with high power pulses [28]. Moreover, the dispersion of a photonic crystal fiber (PCF) can be tailored to achieve three seperate zero dispersion wavelengths (ZDWs) allowing for FWM to occur [29]. This ef-fect has also been observed in OMFs, where a small signal at the third harmonic (TH) frequency was parametrically amplified by tailoring the OMF dispersion to allow for phase matched FWM to occur [24]. This same technique is exploited here in order to demonstrate FHG and 5HG.
All-fiberized FHG and 5HG is achieved using cascaded nonlinear processes including SHG, THG and FWM. First, a high power pulsed near-IR Master Oscillator Power Amplifier (MOPA) source is employed in conjunction with a PPSF for SHG. The TH wavelength generated as a non-phase matched by-product of the SHG is parametrically amplified by an OMF with a specific phase matching diameter (PMD) [24]. These three wavelengths are then employed in another OMF to allow for FHG and 5HG via FWM.
2.1. Phase matching in OMFs
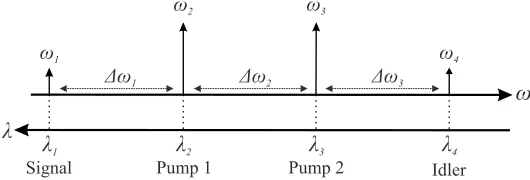
Efficient FWM requires the energy conservation and phase matching conditions to be satisfied. The general FWM process with pumps at frequenciesω2andω3 generate signal and idler fre-quencies atω1andω4, respectively, as shown in Fig. 1.
The energy conservation and phase matching condition can be written as:
ω2+ω3=ω1+ω4 (1)
Δω2
Signal Pump 1 Pump 2 Idler
Δω3 Δω1
ω1
ω2 ω3
ω4
λ
ω
[image:4.612.173.438.93.183.2]λ
1λ
2λ
3λ
4Fig. 1. Schematic of FWM. In general,Δω1=Δω3Δω2.
where βi is the propagation constant of the mode at frequency i. Equation (2) can also be equivalently written as,
Δβ=β2+β3−β1−β4=0 (3) whereΔβ is the FWM detuning due to phase mismatch. While this applies to any combina-tion of optical fiber modes of the interacting wavelengths, only the fundamental H E11mode is considered here as it has the largest modal overlap.
Two basic classifications are typically employed, depending on the configuration of the pump wavelength. Degenerate FWM (DFWM) occurs when the two pump wavelengths are equal (ωl =ωm), while non-degenerate FWM (NDFWM) occurs when the two pumps are not equal (ωl ωm). In both cases, the energy conservation condition in Eq. (1) can be easily satisfied as any combination of pump wavelengths yields specific idler and signal wavelengths. The phase matching condition in Eq. (2), on the other hand, may only be achieved by tailoring the dispersion of the waveguide in order to compensate for the material dispersion of the interacting modes at different wavelengths, achieved by varying the diameter in OMFs.
In the experiments, a FF wavelength of λFF = 1.55 μm is employed to generate a SH wavelength at λSH = 0.775 μm, which is then employed to generate the TH, FH and 5H wavelengths (λTH =0.517 μm,λFH =0.387 μm andλ5HF =0.31μm, respectively). Setting λ1 = λFF,λ2 = λSH,λ3 = λTH,λ4 = λFH, and λ5 = λ5H, the detuning condition in Eq.
(3) can then be applied to these five interacting wavelengths for various DFWM and NDFWM schemes satisfying the energy conservation condition in Eq. (1), depicted in Fig. 2. The PMD for a particular FWM scheme occurs whenΔβ =0, as shown in Fig. 2(a) for the three FWM schemes involving the generation of the FH wavelength and detailed in Table 1. From Fig. 2(b), no phase matching diameter was found to exist for the 5H wavelength. An analysis of the wavelengths employed in [28] shows that while the OMFs were not operating at the PMD, the phase mismatch is relatively small, thus could be ‘bridged’ by nonlinear phase shifts and result in relatively broad cascaded FWM.
The phase matching calculation can then be generalized for FWM in OMFs with any set of interacting wavelengths within the silica optical window (λ=0.2−2.0μm). The PMD for both DFWM and NDFWM for various interacting wavelengths can then be calculated, as shown in Fig. 3.
Interestingly, for both DFWM and NDFWM, there are nearly always at least one diameter for which FWM phase matching occurs for any set of interacting wavelengths, potentially allowing near arbitrary generation of wavelength. Therefore, Fig. 3(a) is a generalized result of those recorded in [24]. Note, however, that as NDFWM has an unlimited combination of wavelengths that satisfy Eqs. (1) and (2), Fig. 3(b) shows only the signal satisfyingΔω1=Δω2 =Δω3.
2.2. Experiments
OMF Diameter (μm) -4.0 -3.5 -3.0 -2.5 -2.0 -1.5 -1.0 -0.5 0 Δ β, (m -1 ) ×105 β
TH+ βFH- βSH-β5H 2β
FH- βTH-β5H 2β
TH- βFF-β5H
4.0
0.5 1.0 1.5 2.0 2.5 3.0 3.5
4.0
OMF Diameter (μm)
-2.5 -2.0 -1.5 -1.0 -0.5 0 0.5 1.0 1.5 Δβ, (m -1) ×105 β
SH+ βTH- βFF-βFH 2β
TH- βSH-βFH 2β
SH- βTH-βFF
0.5 1.0 1.5 2.0 2.5 3.0 3.5
(a) (b)
Fig. 2. Evolution of detuningΔβwith OMF diameter for different FWM schemes for (a) FHG and (b) 5HG for the wavelengths which are considered. The diameters at whichΔβ=0 are the phase matching diameters for a particular FWM scheme.
(a)
500 1000 1500 2000
λ1(nm) 500 1000 1500 2000 λ2 (nm) 0.5 1 1.5
Phase matching diameter (μm)
500 1000 1500 2000
λ1(nm) 500 600 700 800 900 1000 1100 1200 λ2 (nm) 2 4 6 8 10
Phase matching diameter (μm)
(b)
500 1000 1500
λ2(nm) 400 600 800 1000 1200 1400 1600 1800 λ3 (nm) 0.5 1 1.5
Phase matching diameter (μm)
500 1000 1500
λ2(nm) 400 600 800 1000 1200 1400 1600 1800 λ3 (nm) 2 4 6 8 10
Fig. 3. FWM PMD in OMFs within the optical transmission window of silica for (a) degenerate FWM (λ2=λ3), whereλ2is the pump wavelength andλ1is the signal wavelength; and (b) non-degenerate FWM for a range of pumpsλ2andλ3. Here, the frequency difference is equal (Δω1=Δω2=Δω3). As the OMF nonlinearity decreases significantly with increasing the OMF size,d<10μm was chosen in order to achieve relatively high nonlinearity [30]. The left and right plots in (a) and (b) show the two possible PMDs.
telecom C-band wavelength region (1530−1565 nm) was used as the FF pump source, and generated pulses with durationτ = 5 ns, repetition rate f =200 kHz and an average power
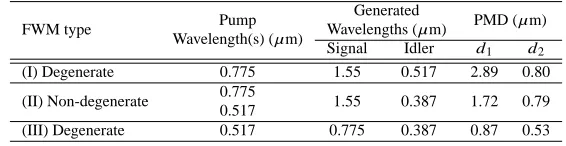
Table 1. Phase matching diameters (PMDs) for three different FWM schemes.d1andd2denote two separate phase diameters
FWM type Pump
Wavelength(s) (μm)
Generated
Wavelengths (μm) PMD (μm)
Signal Idler d1 d2
(I) Degenerate 0.775 1.55 0.517 2.89 0.80
(II) Non-degenerate 0.775
0.517 1.55 0.387 1.72 0.79
(III) Degenerate 0.517 0.775 0.387 0.87 0.53
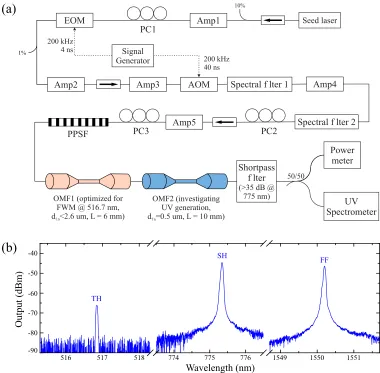
The use of the AOM in conjunction with two tunable spectral filters minimizes inter-pulse ASE in both the temporal domain and the spectral domain, allowing the pump signal at the FF wave-length to have an optical signal-to-noise ratio (OSNR) in excess of 40 dB at a pump power of 300 mW [19]. A SH wavelength was generated by splicing the MOPA output to a PPSF with a total insertion loss of 1.7 dB. The PPSF, a twin-hole Germania doped fused silica fiber manu-factured by Acreo Fiberlab and poled via the application of a positive voltage of 7.5 kV to both liquid electrodes embedded in the two holes of the fiber for 120 minutes at a temperature of 300◦C, was then spliced to a pure silica fiber that was tapered to provide two OMFs. However, as the final amplifier (Amp5 in Fig. 4(a)) is noisy, the maximum average output power of the MOPA was also limited to approximately 380 mW corresponding to an initial average power of approximately 4 mW at the SH wavelength as it was found that the power at the SH wavelength decreases with any additional increase in pump power. The typical output spectrum from the PPSF after the SHG process is shown in Fig. 4(b).
A 6 mm-long, 2.5μm-diameter OMF (OMF1) was fabricated from the pure silica fibre using the modified flame brushing method [30] to amplify the signal at the TH wavelength, generated in the PPSF as a non-phase matched by-product of the SHG process. OMF1 had a diameter close to the first PMD (d =2.89 μm) and was fabricated whilst the MOPA source was turned on to check the parametric amplification efficiency in real time. A pure silica core fiber (Z-fiber, Sumitomo Electric) was chosen because standard telecom SMF-28 optical fibers exhibit a significant absorption in the UV region [31, 32]. However, the Z fibre still exhibited large losses at wavelengths shorter than 300 nm, attributed to the oxygen-silica deficiency center, thereby limiting the application to the near UV wavelength region [33].
In order to ensure that the PMD was achieved, OMF1 was spliced with a short pass filter designed to have high losses (>80 dB) only at the FF, and the output at the TH wavelength was monitored whilst tapering. The tapering process was then stopped shortly after the PMD was achieved as detailed in [24]. However, the OMF1 diameter was kept smaller than the optimum PMD in order to ensure that the high power at the SH wavelength was not depleted. Table 1 shows that there are three PMDs near d ∼ 0.8 μm: d2 in schemes (I) and (II), and d1 in scheme (III). The OMF diameter fluctuations related to fabrication imprecisions can be>±50 nm, thus OMF1 has a large range of diameters along its length which comprise both PMDs and thus involve both generation of the FH and TH wavelengths. As the purpose of the OMF1 was to boost the power of the TH wavelength, any energy transfer to the FH was undesirable. Furthermore, initial experiments showed that no FH signal could be observed at d ∼0.8 μm at the OMF1 output. The first PMD at d ∼ 2.89 μm was therefore chosen as the diameter of OMF1. The output from the OMF1 is shown in Fig. 5.
10%
Seed laser Amp1
EOM
Amp2 Amp3 AOM Spectral f lter 1 Amp4
Spectral f lter 2 Amp5
Shortpass f lter (>35 dB @
775 nm)
Power meter
UV Spectrometer Signal
Generator 200 kHz 40 ns 200 kHz
4 ns
50/50 PC1
PC3 PC2
PPSF
OMF1 (optimized for FWM @ 516.7 nm, d <2.6 um, L = 6 mm)f n
OMF2 (investigating UV generation, d =0.5 um, L = 10 mm)f n
1%
(a)
(b)
TH
SH FF
-90 -80 -70 -60 -50 -40
Output (dBm)
Wavelength (nm)
516 517 518 774 775 776 1549 1550 1551
Fig. 4. (a) Experimental setup for UV generation in OMFs. Five amplifiers (Amp#) were em-ployed in the MOPA chain with the pulses carved by an electro-optic modulator (EOM) and an acoustic optical modulator (AOM). Two spectral filters were employed in order to allow for an OSNR of more than 40 dB at the output. The polarization in the chain is managed by three po-larization controllers (PC). PPSF designates the periodically poled silica fiber. (b) Typical output spectrum after SHG from the PPSF which is spliced to a shortpass filter with losses of>40 dB and>70 dB at the SH and FF wavelengths, respectively.
during the tapering process as the UV spectrometer is sensitive to visible light and therefore would register both the TH and SH signals.
[image:7.612.115.495.92.465.2]516 517 774 775 776 1549 1550 1551 -80
-75 -70 -65 -60 -55 -50 -45 -40
Ou
tpu
t F
,
TH
(d
Bm
)
F
Wavelength (nm)
-40 -30 -20 -10 0
Ou
tpu
t SH
(d
Bm)
TH
FF
SH
Fig. 5. Output spectrum from the OMF1 after a shortpass filter designed to remove radiation at 1.55μm. The signal at the third harmonic wavelength (0.517μm) has been enhanced by the parametric amplification in OMF1 to more than -50 dBm from an initial signal of approximately
−65 dBm.
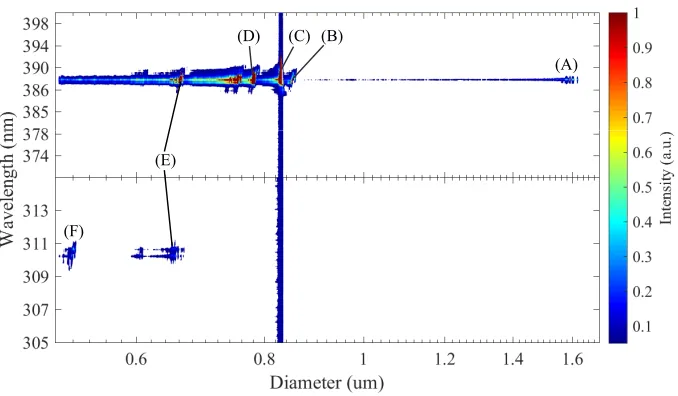
(A) (D) (C)
(E)
(F)
[image:8.612.117.497.78.261.2](B)
Fig. 6. Output spectrum from the OMF2 after a shortpass filter designed to attenuate the FF, SH and TH wavelengths. The detector is sensitive to visible light, which manifests as a broadband background signal which varies slightly as the OMF is tapered. Tests with higher powers at the SH and TH indicate that the signals at the SH and TH do not appear as narrowband radiation. (A)-(F) represent the FH and 5H signals.
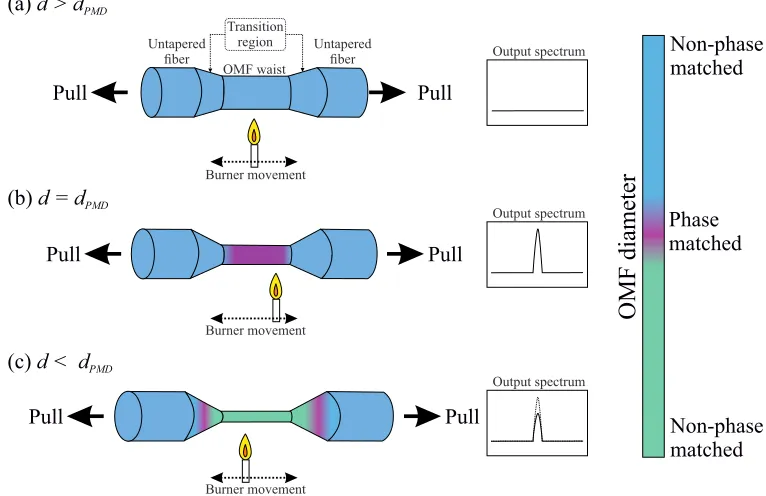
[image:8.612.139.478.331.529.2]ta-pered, since the segment of OMF2 at the PMD decreases as the tapering process evolves. This is shown schematically in Fig. 7, and is due to the fact that the conversion process is dependent on the interaction length. As shown in Fig. 7(a), no signal is discernible at the FH wavelength before the OMF waist reaches the PMD. At the PMD, the efficiency increases dramatically as the dispersion requirement 2 for efficient FWM is achieved, as shown in Fig. 7(b). As the fiber is tapered further, diameter decreases, although due to the increase overall length of the OMF, there is always a range of diameters in the transition region which are phase matched or nearly phase matched, as shown in Fig. 7(c). However, as the process continues, an increasingly larger proportion of the OMF becomes smaller than the phase matching diameter, causing the observed gradual drop in the efficiency.
At d(B)∼850 nm, however, a large increase in the signal at the FH wavelength was recorded, corresponding to the first PMD from the second DWFM process (d1 in scheme (III) of Table 1) with the difference attributable to the detuning from self-phase modulation (SPM) and cross phase modulation (XPM), as well as experimental errors in diameter estimation. Another large spike was then observed at d(C)∼830 nm. Here, there is an increase in the overall background across the entire wavelength range, suggesting that the PMD corresponding to the generation of the TH is reached (d2 in scheme (I) of Table 1), as the CCD array of the spectrometer is sensitive to visible light, scattered by the grating inside the spectrometer. This generation of the TH wavelength simultaneously increasing the efficiency of FWM at the FH wavelength as energy is transferred from both the FF and SH to the TH and then to the FH.
Pull
Pull
Pull
Pull
Pull
Pull
OMF diameter
Phase
matched
Non-phase
matched
Non-phase
matched
Transition region
OMF waist
Burner movement
Burner movement
Burner movement Untapered
fiber Untapered
fiber Output spectrum
Output spectrum
Output spectrum
(a)
d > d
PMD(b)
d = d
PMD [image:9.612.113.496.348.596.2](c)
d < d
PMDFig. 7. Schematic of the tapering process in the experiment. Here,dis the diameter of the OMF, anddPMDis the phase matching diameter for FWM.
indicate that energy transfer occurs at approximately this diameter, probably due to the fact that condition in Eq. (2) for the DFWM which produces the FH is nearly fulfilled and the small phase mismatch may easily be bridged by nonlinear phase shifts due to SPM and XPM. The fact that a signal could be observed at the 5H despite the detuning is not near the optimum diameter (i.e. whenΔβis closest to 0) for any of the three FWM schemes shown in Fig. 2(b) is due to the combination of relatively small phase mismatch and a relatively high power at the FH wavelength, allowing NDFWM between the SH, TH, FH and 5H wavelengths to occur. This is supported by the fact that as the OMF diameter is reduced, the signal at the 5H is also reduced significantly. The next 5H signal observed at a diameter d(F) ∼ 0.525 μm can similarly be attributed to NDWFM between the SH, TH, FH and 5H as theΔβis closest to 0 at this diameter. However, there was no corresponding spike at the FH despite being close to the PMD.
The approximate maximum average output power at the FH, after accounting for transmission losses, was PFHma x ∼8−10 nW at d∼0.8μm, corresponding to an efficiency of∼ 2×10⁻⁸. The low efficiency may be attributed to the low power at the SH and TH wavelengths as well as the fact that the OMF waist was not uniform, which therefore limited energy transfer. This is extremely low when compared to the state-of-the-art technology, where FHG efficiency in excess of 50% has been shown to be achievable by employing cavity-enhanced SHG and FHG with nonlinear crystals [36]. Indeed, commercially available single-pass FHG devices typically have conversion efficiencies in excess of 10%. Therefore, in order to ascertain whether it is possible to achieve reasonable efficiencies with this method, a full theoretical treatment of FWM energy transfer for harmonic generation is undertaken, which shall also allow an investigation on the any fundamental limitations of FWM in OMFs.
3. Theory and simulation
The greatest issue in the experimental demonstration above is the power of the pump wave-lengths at the SH and TH wavewave-lengths. The low SHG efficiency limited the amount of power which can be transferred to the TH wavelength, thereby limiting the overall UV generation efficiency. However, SHG with PPSF has been shown to be very efficient, with the highest con-version efficiency being 45% [19]. Therefore, this section investigates the theoretical efficiency of the THG and FHG processes in OMFs.
3.1. Efficiency calculations
The equations governing the transfer of energy in FWM processes are well known and have been widely employed [37]. A fully vectorial description of FWM in high contrast waveguides such as OMFs has been derived by employing the Lorentz reciprocity theorem [38]. Following this, the sum of the electric and magnetic fields of four interacting wavelengths of k,l,m and n
can be expressed as,
E(r, ω)=
v=k,l,m,n
AvFv√(r, ωv)
Nv e
i(βvz−ωvt)+c.c. (4)
H(r, ω)=
v=k,l,m,n
BvGv√(r, ωv)
Nv e
i(βvz−ωvt)+c.c. (5)
whereωvis the frequency, βvis the propagation constant, Avand Bvare the amplitude of the electric and magnetic fields, and Fv(r, ωv) and Gv(r, ωv) are the electric and magnetic modal field distributions which satisfy the normalization relation,
Nμ= 1
4
Only terms which are energy conserving (Eq. (1)) are considered, with terms corresponding to phase matching (Eq. (2)) retained as they are dependent on the geometry of the waveguide. Any fast rotating terms (e.g. ei(βα−βσ)z, e−i(ωα−ωσ)t) are neglected as the coupling is assumed
to be small. The vectorial FWM equation for wavelength l can then be written as,
∂Al(z,t)
∂z =−
αl
2 Al+γl
⎧⎪⎪ ⎪⎨
⎪⎪⎪⎩Θl|Al|2Al+
p=m,n,k
Θl p(2|Ap|2Al)
+Θklmn[2( AkAnA∗m)]e−i(βl+βm−βk−βn)z
(7)
where,
γl =i
0
μ0
2πn(2)(ωl)n2(ωl)
3λl (8a)
Θl = 2|F
l|4+|F2l|2
N4
l
dS (8b)
Θl p= |F
l ·F∗p|2+|Fp|2|Fl|2+|Fl ·Fp|2
Nl2Np2
dS (8c)
Θklmn =
(F
k ·Fn)(F∗l ·F∗m)
√
NkNlNmNn dS (8d)
αl is the loss,λl is the wavelength at frequencyωl, n(ωl) is the linear refractive index, n(2)(ωl)
is the nonlinear refractive index, and 0 and μ0 are the permittivity and permeability of free space, respectively. For generality, n(ωl) and n(2)(ωl) have been left with an explicit
depen-dence on the frequency. Note that the modal integrals in Eq. (8) are calculated only over the region where the nonlinear material is present. This takes account of the fact that significant fractions of the mode may propagate beyond the core region and therefore do not contribute to the conversion process.
Equation 7 is the general vectorial equation describing FWM with continuous wave (CW) or quasi-CW pump sources. Here, the first and second terms correspond to SPM and XPM, respectively. The third term is the energy transfer term corresponding to NDFWM between
ωk, ωl, ωmandωn. This equation may therefore be applied for any set of wavelengths satisfying
Eq. (1) by selecting and adding the relevant terms. For instance, in the specific case whereΔω1=
Δω2 =Δω3, two additional terms corresponding to two DFWM scenarios may be introduced for whenωl is the pump (Θkllm) and the signal (Θlmmn). As there are no assumptions made on the modal distribution of the interacting wavelengths, this set of equations may also be applied for intermodal FWM. However, only the fundamental HE11mode will be considered here for the four interacting waves, as it gives the highest overlap between their respective field distributions.
The efficiency of the conversion process is theoretically calculated for the SH, TH and FH wavelengths in sections 3.2 and 3.3, excluding the 5H wavelength to simplify the analysis. Therefore, the pump wavelengths for the FWM process are chosen to be at the SH and TH wave-lengths (0.775μm and 0.517μm, respectively), with the idler and signal at the FH wavelength (0.387μm) and at the FF wavelength (1.55μm), respectively. The OMF losses are assumed to be negligible [30].
3.2. Degenerate FWM for third harmonic generation
source operating at 1.55μm working in conjunction with a PPSF, generating the SH wavelength at 0.775μm with parameters given in [19] in order to achieve the best theoretical efficiency from realistic sources. Calculations were done with a quasi-CW pulsed laser with a peak power of approximately PpeakFF = 1 kW at the MOPA output. The power is limited to 1 kW in order to allow for comparison with the theoretical results of intermodal THG in OMFs [20]. Assum-ing a loss of 0.5 dB at the FF after the conversion process, this translated to a peak power of approximately PpeakFF = 534 W at the FF and PpeakSH =400 W at the SH wavelength after
the PPSF. A small signal at the TH wavelength with a peak power of PpeakTH =1×10−
9W
generated from non-phase matched sum frequency generation was also included. This was then propagated through a straight ideal OMF with a diameter close to the PMD for scheme (I) in Ta-ble 1, and the fraction of power in each wavelength (Υl =Pl/Ptotal, where l is the wavelength) was calculated. Note that the final value ofΥl may be interpreted as the overall efficiency (η) of the energy transfer from the FF to wavelength l. Figure 8 shows the calculatedΥl of the DFWM scheme (I) in Table 1 for an OMF with a length of 10 cm around the two PMDs, d 2.89μm and d0.80μm. The variation in the nonlinear refractive index n(2)was extrapolated from [39] with the UV resonance set at 1.45×105cm−1.
ϒ
TH
ϒ
[image:12.612.119.499.293.593.2]TH
Fig. 8. Calculated fraction of total power,ΥTH, at the idler (TH) wavelength (λTH=0.517μm) for the DFWM detailed by scheme (I) in Table 1. The power at the signal (λFF=1.55μm) and pump wavelengths (λSH=0.775μm) is set atPFF=534 W andPSH=400 W, respectively. Two PMDs around (a)d1=2.886μm and (b)d2=0.799μm are used.
which efficient FWM occurs is relatively large. For instance, it is possible to achieve theoretical efficiencies in excess of 15% with a 1 cm OMF at d1±5 nm, while the same efficiency can be achieved with a 3 mm OMF at d2±3 nm. This relatively large tolerance in the PMD is due to the rate at which dephasing from the ideal phase matching condition occurs as described by Eq. (2). The dephasing rate is dependent on the slope of the change in the normalized propagation constant of the interacting wavelength as exemplified by Fig. 2(a). A consequence of this is the dephasing rate is much less pronounced at larger diameters, increasing the diameter range at which phase matching can occur. Notably, this large diameter range at which efficient energy transfer occurs theoretically overcomes fundamental limitations imposed by frozen-in surface waves - whose variation in the diameter is of the order of 1 nm - which limits the efficiency of THG in OMFs toη < 1% [23]. The oscillating behaviour ofΥTHaround the PMD is similar to that observed in [40], and can be explained from the fact that the small phase mismatch limits total energy transfer though relatively high efficiencies can still be achieved for diameters slightly above or below the PMD.
It should be noted, however, that while the diameter range for phase matching is larger at
d1, the rate of energy transfer is much higher at d2, as the effective nonlinearity at d2is signifi-cantly higher as a result of a smaller diameter. Therefore, there is a trade-offbetween the PMD tolerance and the rate at which energy transfer occurs.
3.3. Non-degenerate FWM for fourth harmonic generation
The generated signal from the DFWM described above in section 3.2 is then employed for NDFWM, where the signal and idler wavelengths are given by the FF and FH wavelengths at 1.55 μm and 0.387 μm, respectively, and the pump wavelengths are given by the SH and TH wavelengths at 0.775μm and 0.517μm, respectively.
As the FWM process transfers energy from the two pump wavelengths to the signal and idler wavelengths, the pump wavelengths need to contain significant fractions of the total power. Therefore, the scheme employed in section 2.2 whereby two OMFs are used for efficient FWM is employed, OMF1 being used to boost the power at the TH wavelength as described above and OMF2 to investigate FHG. First, the power at the TH wavelength was amplified by OMF1 at d ∼ 2.89 μm at a length of 7 mm to produce similar levels of power at the SH and TH. This produces output powers at the FF, SH, TH and FH, of PFF =588.1 W, PSH =168.0 W,
PTH=189.1 W and PFH=0.8 mW, respectively. The small signal at the FH is due to non-phase matched transfer of energy from the TH to the FH which has a power fraction ofΥFH ∼10−7. This is propagated through OMF2 which has a length of 10 cm and a diameter close to the PMD at d1 =1.72 μm and d2 =0.79 μm, as specified by scheme (II) in Table 1. The evolution of
ΥFF,ΥTHandΥFHat the PMD d1.72μm is shown in Fig. 9.
Final efficiencies over 25% at the FH wavelength are theoretically possible with short OMFs (∼ 1 cm) over a relatively broad diameter range of d ≥ 4nm, though due to the transfer of power between the four interacting wavelengths, the final efficiency cannot exceed 28% and the fraction of power in the FH oscillates significantly. Substantial energy transfer in the TH at
d∼1.726−1.730μm can also be observed in Fig. 9(b), where the energy is not transferred to the FH but to and from the SH via DFWM between the FF, SH and TH as evidenced by the same behaviour inΥFFin Fig. 9(c). This is not predicted by Eq. (2), but is a result of the interaction between the SPM, XPM and transfer terms in Eq. (7). Interestingly, the total change inΥFF is relatively small (∼0.06) as compared to the FH and TH. Physically, this can be explained by the fact that the photons at the TH and FH wavelengths have three and four times the energy of the photons at the FF wavelength, respectively. Therefore, in the generation of the idler and signal photons during the FWM process, more energy is transferred to the shorter wavelengths as a result of energy conservation, resulting in the difference inΥFF,ΥTHandΥFH.
ϒ
FH
(a)
(b)
ϒ
TH
0.10
0.10
(c)
ϒ
FF
0.10
Fig. 9. Evolution of the fraction of total power (Υl) in the (a) FH wavelength (0.387μm), (b) TH wavelength (0.517μm) and (c) FF wavelength (1.550μm) around the PMDd1.72μm. The total peak power (including loss) is approximately 1 kW.
shown in Fig. 10(a). The final efficiency can be seen to be>30%, but the range of diameters at which phase matching occurs is relatively small, as DFWM between the FF, SH and TH occurs at d ∼0.795 μm. To investigate the effect that the proportion of power in each pump wavelength has on efficiency, the output power of the OMF 1 is varied by selecting a length of 2 mm. This short length did not allow for large transfers of energy between the interacting wavelengths, therefore the fraction of power in the TH is quite small, producing approximately
at d∼0.795 μm, which is near the PMD for DFWM between the FF, SH and TH wavelength. This is due to the fact that the TH wavelength is quite weak, and at this diameter, there is considerable transfer of energy from the SH to the TH, which is then further transferred to the FH, as the phase mismatch is relatively small. This is significant as in practice OMF fabrication error is typically>±6 nm and it might be more practical to have a large mismatch in the input pump powers in order to have higher overall efficiency at this PMD. Finally, the proportion of
ϒ
FH
(a)
(b)
ϒ
FH
0.10
0.10
(c)
ϒ
FH
[image:15.612.117.498.173.612.2]0.10
Fig. 10. Evolution of the fraction of total power (Υl) in the FH wavelength (0.387μm) around the phase matching diameterd ∼ 0.79μm for three initial power fractions,ΥSH :ΥFH, of (a) 17% : 20%, (b) 39% : 3.0% and (c) 0.6% : 33%. The total peak power (including loss) is approximately 1 kW.
for OMF1. The evolutionΥTH in OMF2 over a length of 10 cm is shown in Fig. 10(c). In this scheme, the final efficiency at the FH is the lowest (≤ 5%), as most of the energy transfer is from the TH back to the SH. Therefore, this scheme is not preferred for transferring energy from the FF to the FH wavelength.
The evolution of the energy transfer is therefore significantly dependent on the fraction of power in each wavelength, and for large imbalances in the fraction of power, the main movement of energy transfer is typically from wavelengths with higher powers to those with lower powers. However, the multiharmonic generation process is potentially efficient, if fabrication errors can be kept smaller than 6 nm.
This model is then employed to estimate the efficiency of the FWM FH wavelength genera-tion with the input power given by the output of OMF1. It was discovered that the maximum efficiency possible was ΥFH ∼ 1.8 × 10⁻⁶, corresponding to a maximum output power of
PFH ∼ 460 nW. This large discrepancy is likely due to the large fabrication error, which in this case was possibly>±50 nm, thereby significantly reducing the power transfer to the FH. The fact that the diameter range at which efficiency phase matching occurs is quite small may also contribute to the relatively low efficiency. This may be improved by optimizing both the pump parameters and the fabrication methods to reduce fabrication error. Furthermore, due to the relatively small diameter tolerance of the FWM process at dPMD∼0.8μm, it may be more advantageous to fabricate long OMFs at the other wider PMD d ∼ 1.7 μm despite the lower effective nonlinearity to allow for better conversion to the FH wavelength. Finally, efficiency of this process can be significantly increased by improving the efficiency of the SHG process or by employing more powerful coherent sources at the pump wavelengths.
4. Conclusion
In conclusion, all-fiberized fourth and fifth harmonic generation from a single source is demon-strated by employing a high power MOPA source working in the telecom C-band in conjunction with a PPSF and two OMFs. Phase matching in the two OMFs was achieved by exploiting the tailorable dispersion characteristics of OMFs to compensate for material dispersion of the in-teracting wavelengths. Calculations indicate that there are two PMDs for FHG, though there are no diameters at which 5HG will be phase matched. An experimental demonstration was undertaken, where it was shown that the FH wavelength is generated near the theoretical PMD, while the 5H wavelength appears at diameters for which the ‘gap’ in phase matching between the interacting wavelengths is small enough to be bridged by other nonlinear effects.
Simulations with a high power pulsed source at 1.55μm working in conjunction with a PPSF to generate a SH wavelength at 0.775 μm with an efficiency of 40% indicate the efficiency of parametric amplification at the TH can be in excess of 15% for a relatively broad range of OMF diameter. This broad diameter at which energy transfer occurs transcends the limitation imposed by random dephasing due to frozen-in surface waves, which have been suggested to limit the efficiency of intermodal THG in OMFs toη ∼< 1%. Using two OMFs, FWM over a wavelength range of over 1200 nm with efficiencies of more than 25% were theoretically predicted. In practice, the PMD will need to be considered carefully, as the fraction of power in each wavelength is crucial in determining the direction of energy transfer, and relatively inefficient transfer of energy is possible if the phase matching points between different FWM schemes overlap with one another. Notably, these simulations show that all-fiber multiharmonic generation may be efficient if the fabrication error is not too large.
Funding
Acknowledgments