Technology (IJRASET)
Repurchase Model for Telecom Customers
Astha Agrawal#1, Yamini Chouhan*2
Department of Computer Science, Shri Shankaracharya Technical Campus (SSGI), Bhilai, Chhattisgarh
Abstract— Intensified competition and frequent shifting of customer base for fixed- line telecom service providers, in the recent
years, has increased the necessity for better targeting and segmenting prospects and customers, for cross-sell and up-sell of products and services. Telecom service providers have now realized that old fashioned marketing is no longer the option, because of the abysmally low hit rates in targeting of customers, and the consequently low Return on investment. Decision makers in most fixed- line telecom operators are now of the view that better and accurate targeting of customers is only possible with accurate predictive analytics and data mining. A logistic regression paradigm has been used in this case study to identify those customers with the highest propensity to buy new products and services.
Keywords— Data mining, predictive modeling, Logistic regression, Propensity to buy, cross-sell and up-sell, lift, artificial
intelligence, machine learning,ROI, Proc Reg, categorical and continuous variables, odds ratio, training and validation datasets, outlier detection, data partitioning, maximum likelihood estimates, sensitivity, specificity, False positive, False negative, event, non-event
I. INTRODUCTION
A. Past and present scenarios of fixed- line telecom providers
A gold mine of the fixed- line telecom companies is their customer base. In the Asian region, telecom as a sector has witnessed dramatic changes in the past 15 years, owing to improvement in technology and socio- economic conditions. As a result, there has been a manifold increase in the customer base of the telecom providers. In the past, the fixed- line telecom operators, particularly in the Asian region, rarely engaged in marketing activities to manage customer relationships. With the emergence of many new market players in the past decade and a half, catering to diversified bouquets and offerings, the need for customer focus has increased greatly. Intensifying competition and multitude of choices has also resulted in frequent shifting of the customer base in the past few years. Telecom service providers have now realized that old fashioned marketing where prospects and customers are overwhelmed by thousands of competing messages, resulting in information overload, is no longer the option. As a marketing professional it has now become imperative to cut through the noise with the right offer, to the right person, with the right channel at the right time. By better targeting and segmenting prospects and customers fixed- line telecom operators can:
1) Identify more sales ready prospects
2) Grow more profitable customer relationships
3) Maximize marketing Return on investment
4) Optimize marketing campaign performance
B. Challenges faced by contemporary telecom service provider
Telecom is one among the sectors that have experienced dramatic changes in last two decades owing to numerous technological advances and change in socioeconomic conditions. Increased affordability of telecom services has led to exponential growth in subscriber base. At the same time intensifying competition and multitude of choices has led to frequent shifting of customer
loyalty. With higher base, cost of acquisition of a new customer has grown significantly higher than retention of an existing customer. It has forced service providers to focus more aggressively on customer retention. In developed and matured markets where tele-density is already high and subscriber addition follows flatter trajectory preventing churn becomes crucial to stay relevant. Although in emerging markets where subscriber growth is healthy still cost of churn affects bottom-line as these markets tend to be fiercely competitive regarding pricing. Decision makers in most fixed- line telecom operators are now of the view that all of the above is only possible with accurate predictive analytics and data mining.
Technology (IJRASET)
Data Mining is divided into two phases:-1) Descriptive analytics: - Explores data and provides summary of the data. In mainly provides visualisation of the data.
2) Predictive analytics: - Predictive analytics predict future trends by analysis historical data and patterns, using statistical, artificial intelligence and machine learning techniques.
D. Cross-sell and Up-sell definitions in telecom
Cross-selling is the sale of additional products to existing active customers. In the context of telecom, it could be selling 256 Kbps ADSL to a customer with only landline connectivity. The success of cross-selling practice not only increases revenue per customer, but also helps increase customer satisfaction and customer loyalty. Up-selling is the up gradation of the existing product. An example is moving someone up from a 256 Kbps ADSL to 512 Kbps ADSL speed. These requirements drive operators to actively manage their relationship with customers.
II. METHODOLOGY
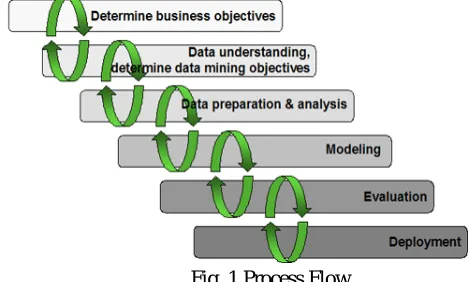
[image:3.612.189.425.290.431.2]Followed CRISP_DM methodology for this project. It stands for Cross – Industry standard process for Data Mining. It involves the following steps:
Fig. 1 Process Flow
A. Business Understanding
The first phase in CRISP-DM methodology focuses on understanding the business objectives and requirements from a business perspective. Once we have understood the business scenario and assessed the current business scenario, we define the data mining goal or problem statement.
The problem statement is identifying existing active telecom customers who have high probability to buy new products.
B. Data Preparation
The data understanding phase starts with an initial data collection, combining and creating an analytical datamart, cleaning of data and proceeds with activities in order to get familiar with the data, to identify data quality problems, verifying data quality, to discover first insights into the data, or to detect interesting subsets to form hypotheses for hidden information.
1) Data Collection: Data/information is scattered in various forms in the company. The first task is to collect data from various sources like Policy level data, Customer data, billing data etc. After we have collected all the data, we analyze the information and find out all the variables which may be relevant to our analysis. Then an analytical database is created which has all these relevant and useful information necessary for analyzing our problem statement.
2) Data Exploration: In this phase, first of all we visualize the distribution of each of the variables. Identify the extreme value in the variables known as outliers. Once these are identified, we treat the outliers either by removing the record or capping the value. If any of the variables has missing value we impute it with mean or mode depending on the type of data i.e. numerical or
categorical. However. there are many other ways of imputing the missing value.Once we have cleaned and understand the data
Technology (IJRASET)
directly use in the mode however, age of the person is more informative. Similarly we identify various variables which we can derive from the existing raw variables.
3) Multicollinearity & Variable Selection: Multicollinearity is the phenomenon of collinearity or inter-relation between the independent variables. The collinearity of independent/explanatory variables with the response or dependent variables is desirable. Multicollinearity is a problem because it can increase the variance of the coefficient estimates and make the estimates very sensitive to minor changes in the model. The result is that the coefficient estimates are unstable and difficult to interpret. Multicollinearity saps the statistical power of the analysis, can cause the coefficients to switch signs, and makes it more difficult to specify the correct model. In order to treat multicollinearity, we select one of the variables among the correlated predictors. Variable selection is a crucial step for model building without losing potential predictive power of the data. In data preparation stage, we include all the variables which may help to predict the dependent variables. However, if we fed all the variables to the model, it would be very difficult to predict the response variable as some of the variables might have very less predictive power. Too many variables may reduce the model efficiency. With many variables there is a potential of over fitting the data. The parameter estimates of the model are destabilized when variables are highly correlated between each other. Hence we select only those variables which have high predictive power.
C. Modelling
In this phase, statistical algorithm are applied to predict the response variable i.e. propensity to buy. As the response variable has only two values
1- Customer buy
0- Customer does not buy
Form of regression that allows the prediction of discrete variables by a mix of continuous and discrete predictors.
Logistic regression is often used because the relationship between the DV (a discrete variable) and a predictor is nonlinear
Logistic regression is a member of generalized linear model (GLM) family.The main function of using log is to regress error and make the curve linear.
D. Model Assessment
At this stage in the project you have built a model (or models) that appear to have high quality, from a data analysis perspective. Before proceeding to final deployment of the model, it is important to carefully evaluate the model, and decide how to use
results.Review the steps executed to construct the model, to be certain it properly achieves the business objectives. A key objective is to determine if there is some important business issue that has not been sufficiently considered. At the end of this phase, a decision on the use of the data mining results should be reached. Review the patterns you have discovered and assess their potential for business use. Tasks for this stage include determining the next steps, Decision, Evaluate results, Review of process.
[image:4.612.124.506.532.690.2]III. RESULT
Technology (IJRASET)
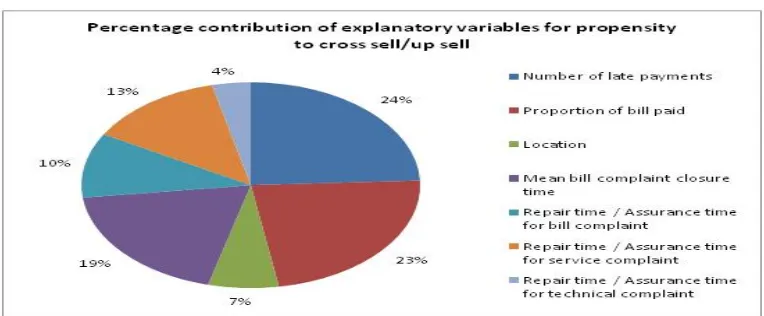
The percentage contribution of the significant explanatory variables is computed as a function of the Wald Chi-Square, Degrees of Freedom, and the intercept value of -2 log (likelihood).
[image:5.612.123.491.156.372.2]The results on percentage contribution of significant explanatory variables indicate that the number of late payments and the proportion of bills paid are the most important variables.
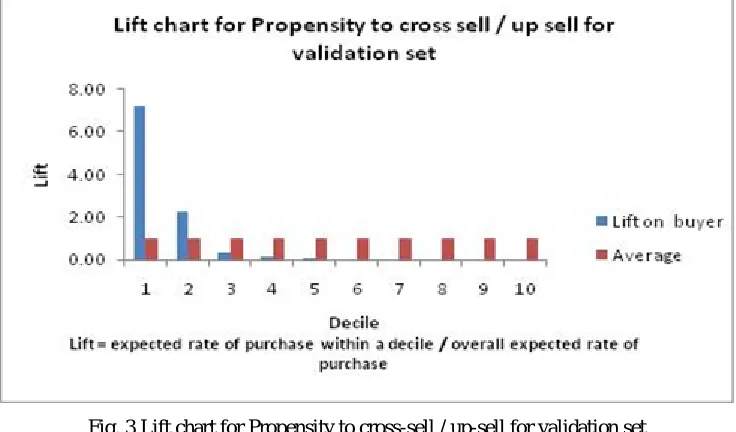
Fig. 3 Lift chart for Propensity to cross-sell / up-sell for validation set
It may be observed that in validation datasets lifts of ~7 have been observed in the top decile.This is an indication of very good model classification.
IV. CONCLUSIONS
The model has been very successful in classifying the best prospects from among the sample dataset of customers, for cross-sell and up-sell campaigns. The expected rate of purchase for these prospects are approximately 7 times more than the overall expected rate of purchase in the sample data. The predicted probability that these prospects would respond to a dedicated campaign is approximately 0.97, which means that 97 out of 100 prospects are likely to positively respond to a campaign.
Most of the parameters that influence the customer’s propensity to purchase belong to the category of “Customer experience” with the service provider.The results obtained can be considered a windfall for the sales and marketing workforce, enabling them to target the most likely prospects, resulting in maximum marketing ROI.
V. ACKNOWLEDGMENT
The authors wish to express their heartfelt gratitude to Hon’ble Shri I.P Mishra, Chairman, Gangajali Educational Society, Bhilai; Respected Shri Abhishek Mishra, Director Systems, SSGI, Bhilai; Respected Shri P.B. Deshmukh, Director Administration, SSGI, Bhilai; Respected Dr. G.R Sinha, Associate Director, SSGI, Bhilai for providing the facilities for the research and development work and for constant encouragement.
REFERENCES
[1] SAS Institute, Inc: SAS/STAT Software, Volume 2: the LOGISTIC Procedure [1] [2] TeleManagement Forum Business Metrics Framework 2006 Version [2]
[3] Gregory Piatetsky- Shapiro and Brij Masand, Estimating campaign benefits and modelling lift, Proceedings of KDD-99 Conference, ACM Press, 1999 [3] [4] Larose, D.T. 2006 Data mining methods and models. A John Wiley & sons, Inc Publication, Hoboken, NJ, USA [4]
[5] Berry, M.J.A and Linoff, G.S 2007 Data mining techniques. Wiley India (p) Ltd, 4435/7, Ansari Road, Daryaganj, New Delhi, India [5]
Technology (IJRASET)
USA [6][7] Gujarati, D.N. 2004 Basis Econometrics, Tata McGraw-Hill publishing company limited, 7 West Patel Nagar, New Delhi, India [7]
[8] Berry, M.J.A. and Linoff, G.S.2001 Mastering .Data Mining: The Art and Science of Customer Relationship Management .New York: Wiley[8] [9] Telecom Management – A golden opportunity by Rob Mattison[9]
[10] Mena ,Jesus. 2001. Web mining for profit: E-Business Optimization .Burlington,MA:Butterworth-Heinemann[10] [11] Pyle,Dorian.2003.Business Modelling and Data Mining.San Francisco: Morgan Kufmann[11]
[12] Berry, M.J.A. and Linoff, G.S..2004.Data Mining Techniques: For Marketing, Sales, and Customer Support(2nd edition).New York: Wiley[12]
[13] Victor S.Y. Lo, The True Lift Model - A Novel Data Mining Approach to Response Modeling in Database Marketing, Fidelity Investments, 82 Devonshire Street R3D, Boston, MA 02109-3614 [13]
[14] Piatetsky-Shapiro, G. and Steingold, S. Measuring lift quality in database marketing. SIGKDD Explorations, 2, Issue 2, 2000, p.76-80 [14] [15] Berry, M.J.A. and Linoff, G.S. Data Mining Techniques: For Marketing, Sales, and Customer Support, Wiley, 1997 [15]
[16] Blattberg, R.C., Getz, G., and Thomas J.S. Customer Equity: Building and Managing Relationships As Valuable Assets. Harvard Business School Press, 2001 [16]