Technology (IJRASET)
Enhancement of Heat Transfer in Shell and Tube
Heat Exchanger Using MGO Nano Fluid
Sharvari Sunku1, Veerabhadra Reddy B2 1
M.tech Student, 2Professor , G. Pulla Reddy Engineering college, Kurnool.
Abstract- Heat exchangers are most widely used devices for industrial purposes. Because there is a lot of need for cooling as well as to dissipate heat. So, here in this paper we aim at rapid cooling and high heat dissipation. For cooling purpose, we generally use heat exchangers with cooling medium as water, ethylene glycol, etc. Now to enhance heat transfer rate in linear flow we are adding Nano particles to the base fluid (water) such that it becomes nanofluid and trying to obtain maximum heat transfer rate in shell and tube heat exchanger. After all practicals done we obtain up to 40% improvement in the effectiveness of the heat exchanger.
Keywords: Rapid cooling, Heat dissipation, linear flow, shell and tube heat exchanger, effectiveness.
Nomenclature
Mfc Mass flow rate of cold fluid [kg] Mfh Mass flow rate of hot fluid [kg]
Tci Cold fluid inlet temperature [˚c] Thi Hot fluid inlet temperature [˚c]
Tco Cold fluid outlet temperature [˚c] Tho Hot fluid outlet temperature [˚c]
Cp Specific heat [kl/kg ˚c] Di Shell inner diameter [m] L Total length of heat exchanger [m] di Tube inner diameter[m] do Tube outer diameter [m] f Friction factor
Nu Nusset number Re Reynolds number
ρ Density [kg/m3] μ Kinetic viscosity [kg/m sec] nf Nanofluid bf Base fluid
θm Logarithmic mean temperature difference Tm Mean temperature [˚c] Φ Volume concentration K Thermal conductivity [W/m ˚c]
Pr Prantl number
I. INTRODUCTION
Technology (IJRASET)
Fig 1. Process in heat exchangers
There are many types of heat exchangers generally used as per requirement. So we can classify them on basis of different parameters like flow direction, compactness of body, transfer type and construction. But we have a general classification of Parallel flow Heat exchangers
Counter flow Heat exchangers Cross flow Heat exchangers
Parallel flow heat exchangers are one in which two fluids flow in parallel to each other, In counter flow heat exchangers the fluids flow in opposite direction and in counter flow heat exchangers the flow occurs in combination of parallel and counter flow.
Fig. 2 Parallel flow Fig. 3 Counter flow Fig. 4 Cross flow
[image:3.612.194.465.532.689.2]In the present experiment we are using shell and tube heat exchanger for analysis. Because they are most versatile in process industries, in conventional and nuclear power stations, steam generators etc. These provide large ratio of surface area to volume. Shell & Tube heat exchangers are built of one shell and many number of tubes. And we make use of both parallel flow as well counter flow.
Technology (IJRASET)
Basically heat exchangers use water, ethylene glycol etc. But here in this analysis we use nanofluids for better rate of heat transfer. Nanofluids are maiden used by Choi (1995)[1], then later many have experimented like L.B. Mapa, Sana Mazhar (2005)[2], “Heat transfer in mini heat exchanger using nanofluids”, A.K. Singh (2008) [3], “Thermal conductivity of nanofluids”, M.G. Mousa (2011)[6], “Effect of nanofluid concentration on the performance of circular heat pipe” and Xie et al (2011)[7], “Discussion on the thermal conductivity enhancement of nanofluids” . All these experiments were conducted and tested with copper and aluminium nanoparticles. Usually any metal will have most enriched properties as a Power in Nano (10-9) size than in its solid form. So we are opting for nanoparticles of Magnesium oxide mixed with water thus making a nanofluid as a medium in heat exchanger. There are two basic steps for preparation of nanofluids. i.e., Single step method and Two step method. Single step method is one in which preparation and dispersion are done at a time. Two step method preparation and dispersion are done differently. Two step method is widely used because it can be used in mass production, so we are using two step method for our experiment. We here are purchasing Nano powders and dispersing them in water (basic fluid) using magnetic stirrer. This nanofluid is used in heat exchanger on cold water side.
II. EXPERIMENT
To make use of nanofluids we have to know the volume concentration we are using. So here we consider MgO Nanofluid with a volume concentration of 0.1% and 0.2%. For this we use the formula as follows
Φ=
∗100 ...(1)
We take 30lit of water for experiment. So based on the above formulae we have calculated 108.36g & 207.48g respectively for 0.1% & 0.2% of MgO nanofluid to be dispersed.
[image:4.612.241.373.428.532.2]We will first make the experiment only with de-ionized water for both parallel flow and counter flow. Then we will replace the water with the nanofluid once with 0.1% & then with 0.2 % MgO. For above three mediums we will do both counter flow and parallel flow. Thus we will note down the readings of each in every practical done. The arrangement of the experiment is shown in fig.6.
Fig. 6 Apparatus of Shell and Tube heat exchanger
In the above figure it is shown that the water tank is kept at some height to make gravitational flow constant. Then a water heater of capacity 1.5KW is used to heat the water. Then 4no’s thermometers are used at each entrance and exit. These help in noting the readings at each section.
Table 1: Specifications of heat exchanger
1 Material used in heat exchanger Stainless Steel
2 Tube length 38.75cm
[image:4.612.44.571.623.720.2]Technology (IJRASET)
Table 2
Properties of Fluids For Water
Density,ρ 996.5Kg/m3
[image:5.612.213.408.373.635.2]Specific heat, Cp 4.181 KJ/Kg-K Thermal conductivity (K) 0.613W/mK
Table 3
For Magnesium oxide (MgO) :
Density,ρ 3580 Kg/m3
Specific heat, Cp 1030 KJ/Kg-K Thermal conductivity (K) 60W/mK
III. CALCULATION STEPS FOR EXPERIMENTAL EVALUATION
For analysing the heat transfer coefficient we need to calculate some parameters. And also Reynolds number for knowing the flow charecteristics. So following are the Formulae to be calculated.
A. For Water Alone
At the mean temperature we have to take all the parameters like Density (ρ), Specific heat (Cp), Kinetic viscosity (μ), Prantl number
(Pr) and thermal conductivity (K). With all these parameters we will find Reynolds number, nusset number, heat transfer coefficient, overall heat transfer.
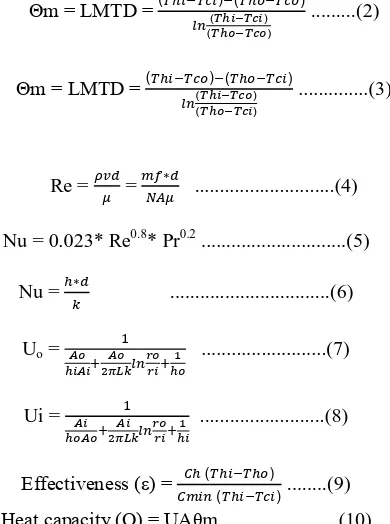
Θm = LMTD = ( () ( ) )
( )
...(2)
For parallel flow Θm = LMTD = ( ( ) ( ) ) ( ) ...(3)
For counter flow Re = = ∗ ...(4)
Nu = 0.023* Re0.8* Pr0.2 ...(5)
Nu = ∗ ...(6)
Uo = ...(7)
Ui = ...(8)
Effectiveness (ε) = ( ) ( ) ...(9)
Heat capacity (Q) = UAθm ...(10)
B. For Nanofluids Density (ρnf) = (1-Φ)ρf + Φρp ...(11)
Technology (IJRASET)
μ nf = μf [( )^ . ] ...(13)
K nf = ( ( () ) ( ( )( ) )) * Kbf ...(14)
Pr = ∗ ...(15)
IV. RESULTS AND DISCUSSIONS
For making of nanofluids we need to use volume concentration formula (1), for finding the quantity of water taken. Since we have taken 30lits of water, we should calculate the amount of MgO nanoparticles used
Case (I) : Concentration of 0.1%, we need to add 107.93gms of MgO Nanoparticles Case (II) : Concentration of 0.2%, we need to add 216.09gms of MgO Nanoparticles
Now let us compare and conclude by using graphs. As we have used two flow rates of 1.2kg/min and 0.852kg/min we will have comparison for these two flow rates too
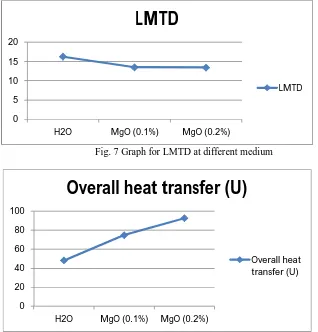
First of all we will look into the comparision of logarithmic mean temperature differences (LMTD), overall heat transfer (U) and
[image:6.612.149.467.346.678.2]effectiveness (ε) with each medium under the flow rate of 1.2kg/min and parallel flow at temperature of 50˚C.
Fig. 7 Graph for LMTD at different medium
Fig. 8 Graph for overall heat transfer (U)
0 5 10 15 20
H2O MgO (0.1%) MgO (0.2%)
LMTD
LMTD
0 20 40 60 80 100
H2O MgO (0.1%) MgO (0.2%)
Overall heat transfer (U)
Technology (IJRASET)
Fig. 9 Graph for Effectiveness
From the above graphs we can note that LMTD decreases when overall heat transfer and effectiveness increase drastically from water to MgO nanofluid.
[image:7.612.156.459.341.694.2]Now we shall compare the same parameters for counter flow at 50˚C and the flow rate of 1.2kg/min
Fig. 10 Graph for LMTD in counter flow
Fig.11 Graph for overall heat transfer (U)
0 0.1 0.2 0.3 0.4 0.5
H2O MgO (0.1%) MgO (0.2%)
Effectiveness
Effectiveness
12.5 13 13.5 14 14.5 15 15.5 16 16.5
H2O MgO (0.1%) MgO (0.2%)
LMTD
LMTD
0 20 40 60 80 100
H2O MgO (0.1%) Mgo (0.2%)
Overall heat transfer(U)
Technology (IJRASET)
Fig.12 Graph for effectiveness in counter flow Here also we see the same results of parallel flow.
[image:8.612.172.446.323.476.2]Then we shall change the flow rate now to 0.852kg/min, parallel flow at 50˚C
Fig. 13 Graph for LMTD at massflow rate of Mf B
Fig. 14 Graph for U at mass flow rate Mf B 0
0.1 0.2 0.3 0.4 0.5 0.6
H2O MgO (0.1%) Mgo (0.2%)
Effectiveness
Effectiveness
0 5 10 15 20 25
H2O MgO (0.1%) Mgo (0.2%)
LMTD
LMTD
0 20 40 60 80
H2O MgO (0.1%) MgO (0.2%)
Overall heat transfer (U)
Technology (IJRASET)
Fig.15 Graph for ε at flow rate MfB
[image:9.612.178.441.311.482.2]Next is counter flow in the changed flow rate at 50˚C.
Fig.16 Graph of LMTD in counter flow
Fig. 17 Graph for U in counter flow
0 0.1 0.2 0.3 0.4 0.5
H2O MgO (0.1%) MgO (0.2%)
Effectiveness
Effectiveness
0 5 10 15 20 25
H2O MgO (0.1%) MgO (0.2%)
LMTD
LMTD
0 10 20 30 40 50 60 70
H2O MgO
(0.1%)
MgO (0.2%)
Overall heat transfer (U)
Technology (IJRASET)
Fig.18 Graph for ε in counter flow
V. CONCLUSION
From the results obtained as per the experimental analysis, the overall heat transfer and effectiveness increases with decrease of LMTD. Highest effectiveness is obtained at the low flow rate and counter flow directions of fluid. Up to 40% of increment is seen in effectiveness of MgO nanofluid with 0.2% of MgO nanoparticle dispersion. Thus our assumption of increment of heat transfer rate has been proven.
REFERENCES
[1] Stephen U.S Choi (1995), “Enhancing thermal conductivity of fluids with nanoparticles”. ASME International Mechanical Engineering Congress & Exposition, November 12-17, 1995, San Francisco, CA.
[2] L.B. Mapa, Sana Mazhar (2005), “Heat transfer in mini heat exchanger using nanofluids”. American Society for Engineering Education April 1-2, 2005 – Northern Illinois University, DeKalb, Illinois. 2005 IL/IN Sectional Conference
[3] A.K. Singh (2008), “Thermal conductivity of nanofluids”. Defence Science Journal, Vol. 58, No. 5, September 2008, pp. 600-607 [4] Kevin G. Wallace (2010), “Research in heat transfer with nanofluids”. Research in Heat Transfer with Nanofluids 1-53, 2010.
[5] M. Hasanuzzaman (2011), “EFFECTIVENESS ENCHANCEMENT OF HEAT EXCHANGER BY USING NANOFLUIDS”. 2011 IEEE First Conference on Clean Energy and Technology CET 978-1-4577-1354-5
[6] M.G. Mousa (2011), “Effect of nanofluid concentration on the performance of circular heat pipe”.Ain Shams Engineering Journal (2011) 2, 63–69. [7] Xie et al (2011), “Discussion on the thermal conductivity enhancement of nanofluids”. Nanoscale Research Letters 2011, 6:124
[8] Teng et al (2011), “Performance evaluation on an air-cooled heat exchanger for alumina nanofluid under laminar flow”. Nanoscale Research Letters 2011, 6:488
[9] Senthilkumar R et al (2012), “Effect of Inclination Angle in Heat Pipe Performance Using Copper Nanofluid”. Procedia Engineering 38 ( 2012 ) 3715 – 3721 0
0.2 0.4 0.6 0.8
H2O MgO
(0.1%)
MgO (0.2%)