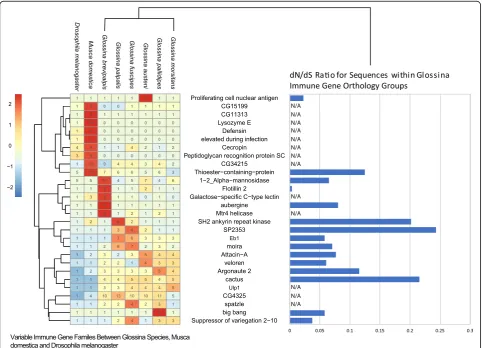
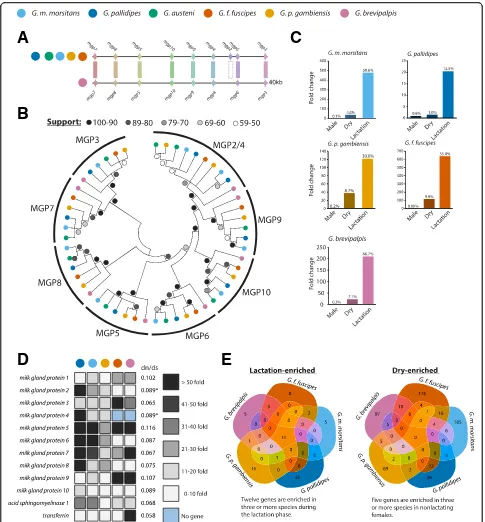
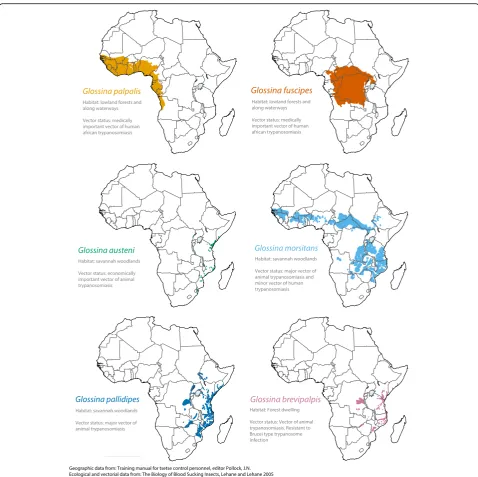
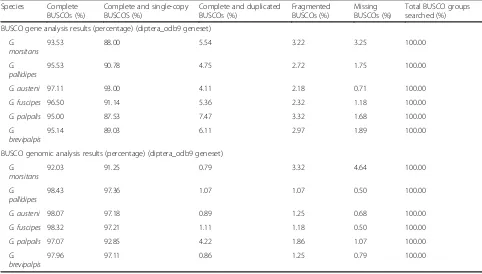
Comparative genomic analysis of six Glossina genomes, vectors of African trypanosomes
Full text
Figure
Related documents
In conclusion, the finding of this cross-sectional study of pre and post menopausal women show no evidence of a significant difference in BMD between Ocs users and never user
The extension in FDI inflows in the midst of 2008 is a result of extended money related advancement and bolstered developmental method of the country which restore outside
200 cases were selected using non- random purposive sampling in 2016.From this sample, 100 women with type 2 diabetes and 100 healthy women were selected based on
contacted the Assessment Librarian to discuss plans and strategies for including information literacy resources, including embedded librarians (if possible), in the LSU
Apple has granted MFi certification for PAX’s innovative portfolio of compact MPOS terminals D200, D210 which can now be used with iPhone, iPAD and other mobile
In order to evaluate the overall influence of roundabouts and T-junctions on drivers’ risk perception, the total number of SCR peaks and the average amplitude of SCR
To compute the economic insecurity index, the paper follows the Osberg (1998), and Osberg and Sharpe (2002, 2003) method of computing the insecurity index. They computed the
On the number of corruption items reported, the table shows that politics/governance sector ranked first with a total of 522 news items accounting for 57.2% of the whole
