5
VIII
August 2017
Linear Programming Approach to the Residential
Load Energy Management System
Sunny Prakash 1, Punya 2
1,2Department of EEE, Acharya Nagarjuna University
Abstract: This paper proposes an effective method to the Residential Load Energy Management System (EMS) of a given
consumer (e.g. house) with respect to hourly electricity prices. This paper considers a collection of compound charge reactive loads in a township. The loads can be provided through the main grid and arbitrary Distributed Energy Resources (DERs), such as the wind and photovoltaic power sources. The suggested EMS has the competence that each consumer can engage their own plan to govern the present load and prices in the electrical distribution system. To resolve this EMS problem an effective algorithm based on Linear Programming (LP) approach has been implemented. The main target of the suggested method is to maximize the utilization of the group of loads when it is subjected to a set of constraints. This Linear Programming approach algorithm permits the collection of loads to purchase, store and sell energy at suitable times to regulate the hourly load level. To assess the performance of the suggested algorithm an IEEE 14 bus system was considered. The results exhibit that the collection of loads of energy management system using the suggested approach increasing the efficiency and minimizing the losses than the previous methods.
Keywords: Energy Management System, Distributed Energy Resources (DER’s), Linear Programming (LP), Price responsive demands and optimization algorithm.
I. INTRODUCTION
simulation results of project. Finally in section V, the relevant conclusion and the main references of this paper are highlighted respectively.
II. EMS ARCHITECTURE AND OPERATIONAL CHARACTERISTICS
Energy management is the favourable, strategic and effective coordination of attainment, alter, supply and utilization of energy to reach the supplies, attractive into account atmospheric and monetary objectives. Energy management is an incessant function of energy managers. It is monumental to integrate the energy management in the structure of the organization so that the energy management can be accomplished. It is suggestible to setup a separate organizational unit "energy management" in large companies. Facility management is the vital part of energy management because the large proportions (avg. 25 per cent) of complete operating costs are energy costs.
In the proposed EMS, PV array's primary function is to produce 0.4MW energy to supply the loads. The block diagram of EMS is shown in Fig. 1
Fig.1 Block Diagram of EMS
Wind farm produces 0.02MW energy supply to the load. The converter works as a buck boost converter to amplify the output voltage range. From the DC converter, the input signal of voltage and current is given to the maximum power point tracking (MPPT) controller. This controller finds the error signal and activates the IGBT gate drive; this highly decreases the number of iterations in the MPPT technique.
Wind farm pitch regulator has an active control system that can adjust the pitch angle of the turbine blades to reduce the torque produced by the blades in a fixed speed turbine and to reduce the rotational speed in variable speed turbines. The adaptable speed operation of wind power generation systems yields optimum responses for both low and high wind speeds. A battery bank is used to store the DC energy at the voltage of 115kW. From the battery, AC loads are connected.
These AC loads are prioritized as lighting load which accounts light and fan for the building considered. If the load demand is lesser than the DERs output, the surplus energy will be utilized to incriminate the battery. The battery will be completely charged, the power can be inverted from DC to AC for the utilization of AC loads or surplus energy may be given to the grid. If the DC supply does not exist or be only partly available and the demand is on the dc loads, the battery will supply the power directly. If the load require being upper greater than the battery output, the AC grid will supply energy when it is available.
III. IMPLEMENTATION OF LP METHOD TO SOLVE THE EMS PROBLEM
It is a mathematical technique for maximizing or minimizing a linear function of several variables. Such as output or cost function. The step by step approach for mathematical formulation of linear programming method to solve energy management problem is as follows.
A. Step 1: Input the load variables for real time data and pre determined data using Neural Network (NN) of the energy management system.
B. Step 2: Formulate the demand function to be optimized (maximum or minimum) as a linear function of all distinctive variables. C. Step 3: Formulate the constraints of energy management system such as resource limitations, market demands, inter- relation
1
2
3
4
D. Step 4: From this project thirteen different types of demands available and three different types of energy sources available. Let denote the number of units of energy sources in the unit of demands =1, 2, 3: = 1, 2, 3, 4, 5, 6, 7, 8, 9, 10, 11, 12, 13. Let be the number of units consumed for demand. Then the total number of units of demands in the preferred source.
E. Step 5: Let be the number of units of minimum daily requirement of the demand and it can be expressed as follows
Where =1, 2, 3…13 F. Step 6: For each source , must be either positive or zero.
Where = 1, 2, 3
G. Step 7: Let be the energy management system output of energy source . Thus the total output of energy management system is given below
Finally, load scheduling was done based on linear programming approach. Production units and dynamic residential loads have the specific load profile i.e., every dynamic load has separate load profile based on that they will order to energy management system. Consequently, EMS sends information to the distributed generation resources in the micro grid. Then the DG's send respective energy to the EMS. Finally, EMS distributes energy to the required loads based on LP approach in an optimization procedure
IV. PROPOSED SYSTEM
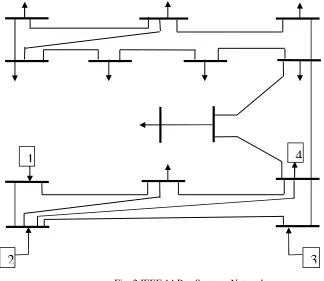
[image:4.612.142.466.436.717.2]For this work, the linear programming approach is used for mathematical analysis. The purpose of this project is to expand a MATLAB program maximize the utilization of the collection of demands when it is subjected to a set of constraints. Fig. 2 shows the total loads and the energy sources. For the identification purpose 1, 2, 3 and 4 are pv, wind, central grid and battery respectively. Remaining all arrow symbols are demands.
The proposed LP method simulation were developed using MATLAB 2017a and SIMULINK version 9.2 software packages and the system configuration is Intel Core i5-6200U Processor with 2.40 GHz speed and 8 GB RAM. In proposed work three energy sources, 13 demands and IEEE 14 bus system considered over specified time intervals. The computational results of EMS problem attained by the proposed LP method for the three energy sources analysed
A. Subsystems
1) Pv System: The PV Array block implements an array of photovoltaic (PV) modules. The array is a collection of strings of modules connected in parallel, each string consisting of modules connected in series. The PV Array block has five parameter model using a current sourceIlg (light-generated current), a diode (I0 and parameters), series resistance Rse, and shunt
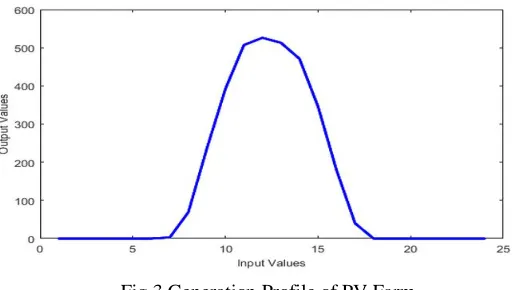
resistance to depict the irradiance and temperature-dependent I-V characteristics of the modules. This parameter is available only if display I-V and P-V characteristics of is set to one module @ & specified irradiances or array @ & specified irradiances. Enter a vector of irradiances in watts per square meter. The default value:[1000 500 100].Irradiance was given by 1-D Lookup table. Regarding PV Farm, we have sunlight from morning 06:00 AM to evening 06:00 PM. So we have only data in those hours. The irradiance data and respective graph are shown below.
Table: I PV Farm Generation Profile
Time(hours) Irradiance(w/m2) Time(hours) Irradiance(w/m2)
00.00 0 12.00 526
01.00 0 12.30 519.5
02.00 0 13.00 513
03.00 0 13.30 492
04.00 0 14.00 471
05.00 0 14.30 408
05.30 0.000009 15.00 346
06.00 0.049 15.30 262.5
06.30 1.5 16.00 179
07.00 3 16.30 109.5
07.30 36 17.00 40
08.00 69 17.30 20
08.30 152.5 18.00 0
09.00 236 18.30 0
09.30 314 19.00 0
10.00 392 20.30 0
10.30 449.5 21.00 0
11.00 507 22.00 0
Fig.3 Generation Profile of PV Farm
2) Wind System: Three 1.5 MW turbines contributed to form a 4.5 MW, connected to a 25KV distribution system exports power to a 120KV grid through a 25KM, 25KV feeder Wind turbines using a doubly –fed induction generator (DFIG) has wound rotor induction generator and an AC/DC/AC/IGBT – based Pulse Width Modulation converter modelled by voltage sources. The stator winding is connected directly to the 60Hz grid and its rotor windings are fed at adjustable frequency through the AC/DC/AC converter. The DFIG technology allows extracting maximum energy from the wind for low wind speed by optimizing the turbine speed while minimizing mechanical stresses on the turbine during gusts of wind.
Table. II Wind Generation Profile
Time(hours) Wind Speed(m/s) Time(hours) Wind Speed(m/s)
00.00 9 12.00 8
01.00 9 12.30 10.5
02.00 9 13.00 13
02.30 8.5 13.30 12
03.00 8 14.00 11
03.30 9.5 14.30 10
04.00 11 15.00 9
04.30 9.5 15.30 8.5
05.00 8 16.00 8
05.30 9.5 17.30 9.5
06.30 9 18.00 11
07.00 7 19.00 11
07.30 7.5 19.30 9.5
08.00 8 20.00 8
09.00 8 21.00 9
10.00 8 22.00 13
10.30 8.5 22.30 14
11.00 9 23.00 15
V. CONCLUSION
The suggested method provides the monitoring and control of demand side management system. It enhances the performance of system load to the level of distributed energy resources saturation. The photovoltaic and wind model was designed using MATLAB. The surplus energy which is produced from photovoltaic and wind power plant it shifted to the electrical network. The energy consumption of IEEE 14 bus system has been determined using LP method at all the buses and demand is satisfied with protection system for photovoltaic and wind power plant was implemented. The suggested method satisfies the collection of demands in the energy management system and also enhances the system efficiency and reduces the losses. The surplus energy from distributed energy resources can also be stored in the battery and it could be used by the load when there is a requirement of energy.
REFERENCES
[1] Sheng-yen Lu, Li Wang, Te-Ming Lo, and Anton V. Prokhorov, “ Integration of Wind Power and Wave Power Generation Systems Using a DC Micro grid ” IEEE Trans. on Industry Applications vol.51 Issue 4,July-Aug 2015
[2] https://en.wikipedia.org/wiki/Virtual_power_plant
[3] H. Pandic, J. M. Morales, A. J. conejo, and I. Kuzle, “Offering model for a virtual power plant based on stochastic programming,” Appl. Energy, vol. 105, pp. 282-292, May 2013.
[4] Smart grids, European Technology Platform for the Electricity Networks of the Future. [Online]. Available: http://www.smartgrids.eu.
[5] Felipe Valencia, Doris Sáez, Jorge Collado, Fernanda Ávila, Alejandro Marquez, and Jairo J. Espinosa, “Robust Energy Management System Based on Interval Fuzzy Models” IEEE Trans. On Control Systems Tech. Vol.24,Issue.1,Jan.2016
[6] Brown, P. D.; PeÇas Lopes, J. A.; Matos, M. A.; “Optimization of Pumped Storage Capacity in an Isolated Power System With Large Renewable Penetration”, IEEE Transactions on Power Systems, Volume 23, Issue 2, May 2008 Page(s):523 – 531.
[7] L. Baringo and A. J. Conejo, “Offering strategy via robust optimization”, IEEE Trans. Power System, vol. 26, no. 3, pp. 1418–1425, Aug 2011. [8] Amjad Anvari-Moghaddam, Ghassem Mokhtariand Joseph M. Guerrero “Coordinated Demand Response and Distributed Generation Management in
Residential Smart Micro grids” Research Article INTECH.