Investigation on the Effect of Process Parameters
For EN31 material By EDM using full factorial
method
1*Vaibhav Darji, 2* Prof Yashesh.A.Darji
1* Research scholar, Santilal shah gov.engineering college Bhavnager 2* Asst. Professor, Assistant professor C U Shah college of engineering Wadhwan
Abstract: This paper presents the results of experimental work carried out in electrical discharge machining (EDM) of EN31 using tool materials namely aluminium The machining process was carried out at three different supply current levels (17Amps, 21Amps, 28Amps) , pulse-on time (45μsec, 55μsec, 65μsec), and pulse off time (30μsec, 45μsec, 60μsec) their influence on surface roughness, material removal rate, tool wear rate. The optimal setting of the parameters are determined through experiments planned, conducted and analyzed using the full factorial method.
Key words: Electrical discharge machining (EDM) . Material removal rate, surface roughness, tool wear ratio. Full factorial method, and Design Expert7.01.
1. INRODUCTION:
Electric discharge machining is a non conventional machining process and has found its wide application in making moulds, dies, and in aerospace products and in surgical equipments[1]. The process is based on removing material from a part by means of a series of repeated electrical discharges between tool called the electrode and the work piece in the presence of a dielectric fluid. The electrode is moved toward the work piece until the gap is small enough so that the impressed voltage is great enough to ionize the dielectric. [3] The material is removed with the erosive effect of the electrical discharges from tool and work piece. EDM does not make direct contact between the electrode and the work piece. [4] In this work, a study focused on the electric discharge machining of the EN-31 alloy steel, whose field of applications is in constant growth. Consequently, an analysis on the influence of current and pulse on, pulse off, over surface roughness, material removal rate, tool wear ratio will performed. [2]
2. EXPERIMENTAL MATERIALS
Workpiece material: The workpiece material was a EN-31 The electrode materials was Aluminiam . The chemical composition of electrode materials which is show in Table 1.
Major properties of EN-31
Material Thermal
conductivity
(W/mk)
Density
(g/cc)
Electrical
resistivity
Specific
heat
capacity
(J/g-‘c)
Aluminium electrode.
Material Boiling point
(K)
Thermal conductivity
(W/m-K)
Melting point (K)
[image:3.612.25.522.135.597.2]Aluminium 2792.15 237 933.47
Fig:1:- Electro Discharge Machine used for performing experiments
The EDM machine is mfg by JOEMARS series Z 50 JM-322. To start at determine try-out of suitable parameter relative in EDM process, such as polarity, duty factor, on time, off time, open circuit voltage, discharge current and electrode materials type. The detailed machining conditions used in this
investigation were given in Table 2. Finally, the experiment result comparative the optimal parameters of material removal rate, surface roughness And tool wear ratio.
Surface Roughness
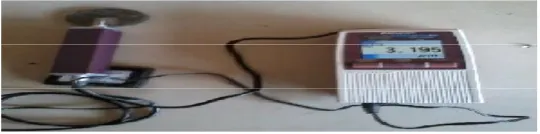
Surface topography or surface roughness ,also known as surface texture are terms used to express the general quality of a machined surface, which is concerned with the geometric irregularities and the quality of a surface Roughness measure as the arithmetic average, Ra (μm). The Ra will be measured using a surface roughness tester from Mitutoyo, Model: SJ 201P
3. EXPERIMENTAL SETUP
Electric power supply
Dielectric system (Kerosene Fluid is used.) Work piece (EN-31)
Electrode (Tool)( Aluminiam)
[image:3.612.18.259.140.583.2]TECHNICAL SPECIFICATION Table size 600 X 300 mm X, Y, Z Travel 300/200/200mm Max. Electrode
weight
60 Kg
Max. Workpiece Weight
550 Kg
Tank size 830X500X300 mm Weight of machine 1050 Kg
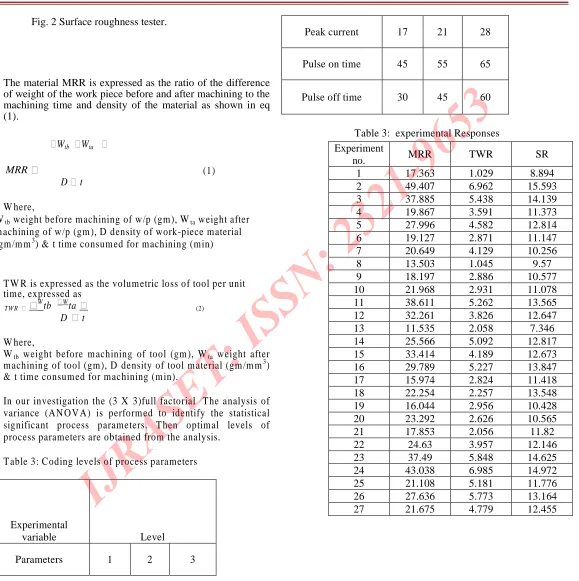
Table 2: Experimental conditions Work piece EN-31
Electrodes Al Polarity (+)
[image:3.612.311.581.612.679.2]Fig. 2 Surface roughness tester.
The material MRR is expressed as the ratio of the difference of weight of the work piece before and after machining to the machining time and density of the material as shown in eq (1).
MRR
Wtb Wta
(1 )
D t
W here,
Wtb weight before machining of w/p (gm), Wtaweight after m achining of w/p (gm ), D density of work-piece material (gm/m m3) & t time consum ed for machining (min)
T W R is expressed as the volum etric loss of tool per unit time, expressed as
TW R W
tb Wta (2)
D t
W here,
Wtb weight before m achining of tool (gm ), Wta weight after m achining of tool (gm), D density of tool material (gm /m m3) & t tim e consum ed for machining (m in).
In our investigation the (3 X 3)full factorial T he analysis of variance (AN O V A) is perform ed to identify the statistical significant process parameters. T hen optimal levels of process parameters are obtained from the analysis.
T able 3: Coding levels of process parameters
Experimental
variable Level
Parameters 1 2 3
Peak current 17 21 28
Pulse on time 45 55 65
Pulse off time 30 45 60
Table 3: experimental Responses Experiment
no. MRR TWR SR
1 17.363 1.029 8.894
2 49.407 6.962 15.593
3 37.885 5.438 14.139
4 19.867 3.591 11.373
5 27.996 4.582 12.814
6 19.127 2.871 11.147
7 20.649 4.129 10.256
8 13.503 1.045 9.57
9 18.197 2.886 10.577
10 21.968 2.931 11.078
11 38.611 5.262 13.565
12 32.261 3.826 12.647
13 11.535 2.058 7.346
14 25.566 5.092 12.817
15 33.414 4.189 12.673
16 29.789 5.227 13.847
17 15.974 2.824 11.418
18 22.254 2.257 13.548
19 16.044 2.956 10.428
20 23.292 2.626 10.565
21 17.853 2.056 11.82
22 24.63 3.957 12.146
23 37.49 5.848 14.625
24 43.038 6.985 14.972
25 21.108 5.181 11.776
26 27.636 5.773 13.164
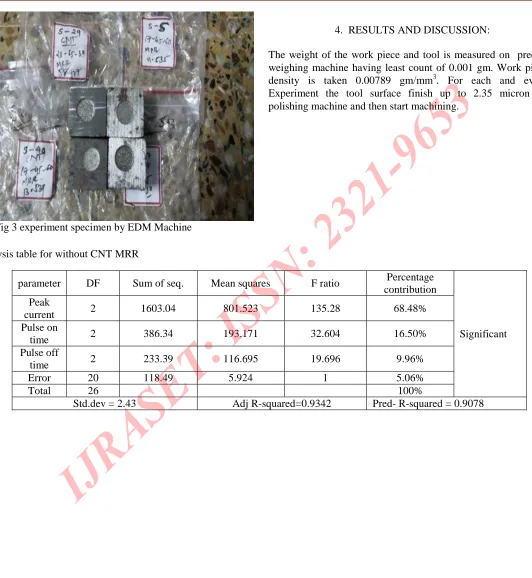
Fig 3 experiment specimen by EDM Machine
4. RESULTS AND DISCUSSION:
The weight of the work piece and tool is measured on precise weighing machine having least count of 0.001 gm. Work piece density is taken 0.00789 gm/mm3. For each and every Experiment the tool surface finish up to 2.35 micron on polishing machine and then start machining.
Analysis table for without CNT MRR
parameter DF Sum of seq. Mean squares F ratio Percentage contribution
Significant Peak
current 2 1603.04 801.523 135.28 68.48%
Pulse on
time 2 386.34 193.171 32.604 16.50%
Pulse off
time 2 233.39 116.695 19.696 9.96%
Error 20 118.49 5.924 1 5.06%
Total 26 100%
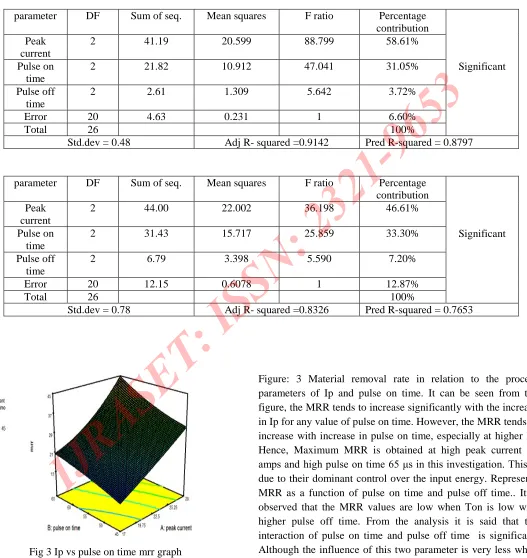
Fig 3 Ip vs pulse on time mrr graph
Figure: 3 Material removal rate in relation to the process parameters of Ip and pulse on time. It can be seen from the figure, the MRR tends to increase significantly with the increase in Ip for any value of pulse on time. However, the MRR tends to increase with increase in pulse on time, especially at higher Ip. Hence, Maximum MRR is obtained at high peak current 28 amps and high pulse on time 65 μs in this investigation. This is due to their dominant control over the input energy. Represents MRR as a function of pulse on time and pulse off time.. It is observed that the MRR values are low when Ton is low with higher pulse off time. From the analysis it is said that the interaction of pulse on time and pulse off time is significant. Although the influence of this two parameter is very less when parameter DF Sum of seq. Mean squares F ratio Percentage
contribution
Significant Peak
current
2 41.19 20.599 88.799 58.61%
Pulse on time
2 21.82 10.912 47.041 31.05%
Pulse off time
2 2.61 1.309 5.642 3.72%
Error 20 4.63 0.231 1 6.60%
Total 26 100%
Std.dev = 0.48 Adj R- squared =0.9142 Pred R-squared = 0.8797
parameter DF Sum of seq. Mean squares F ratio Percentage contribution
Significant Peak
current
2 44.00 22.002 36.198 46.61%
Pulse on time
2 31.43 15.717 25.859 33.30%
Pulse off time
2 6.79 3.398 5.590 7.20%
Error 20 12.15 0.6078 1 12.87%
Total 26 100%
compared with the effect of Ip on MRR.
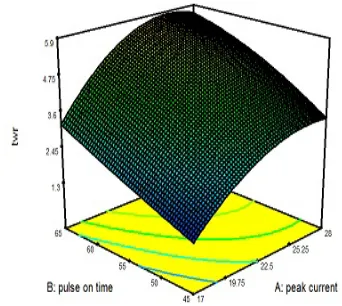
Fig 4 Ip vs pulse on time twr graph
The tool wear rate is decreasing, but discharge Current in the range of 17 to 28 A the tool wear rate is increasing. Because of Ip increases the pulse energy increases and thus more heat energy is produced in the tool work piece interface, leads to increase the melting and evaporation of the electrode. One can interpret that Ip has a significant direct impact on TWR. And pulse on time is directly proportional to the tool wear rate. And diameter of the tool has no significant effect on TWR.
Fig 5 Ip vs pulse on time sr graph
any value of pulse on time. However, the SR tends to increase with increase in Ton, especially at higher Ip. Hence, minimum SR is obtained at low peak current and low pulse on time. This is due to their dominant control over the input energy, i.e. with the increase in Ip and pulse on time generates strong spark for longer time, which create the higher temperature and crater, hence rough surface in the work piece and low Ip creates small crater and therefore smooth surface.
Conclusion:- Process parameters do not have same effect for every response. Significant parameters and its percentage contribution changes as per the behavior of the parameter with objective response
Finding the result of MRR the most significant factor was found to be peak current followed by pulse on time and the least significant was pulse off time. The
MRR increased linearly with the increase in current. For pulse on time the MRR first increased with linearly with increase in pulse off time, MRR decreased insignificantly.
For SR the most significant factor was again current followed by pulse on time and lastly the pulse off time. SR increased significantly with the increase in current in a nonlinear fashion. For increase in pulse on time SR increased. SR is decrease with respect to increase in Pulse off time. Surface roughness shows a marked improvement with increase in pulse off time.
In the case of Tool wear rate the most important factor is peak current then pulse on time and after that pulse off time.
REFERENCES
[image:7.612.74.281.441.623.2]Materials Processing Technology 191 (2007) 141–144
[2] “shailesh kumar” Experimental Investigation of Machining Parameters for EDM Using U-shaped Electrode of AISI P20 Tool Steel thesis (2010)
[3] Module 9 “Non conventional Machining”, Version 2 ME, IIT Kharagpur.
[4] J.L Lin, C.L. Lin, the use of orthogonal array with grey relational analysis to optimize the EDM process with multiple performance characteristics, international journal of machine tools &manufacture 42(2002) 237-244
[5] M. Mahardika and K. Mitsui, Total energy of discharge pulse calculation by stochastic methods, Proceeding of the International Conference of the 10thAUN/SEED.Net Field Wise Seminar, Hanoi, Vietnam in 28th–29th August 2007
[6] Poddar Ayush “Experimental Investigation of Mrr, Surface Roughness And Overcut of AISI 304 Stainless Steel In EDM”a thesis submitted to NIT (2012)
[7] M. Mahardika and K. Mitsui, A new method for monitoring micro-electric discharge machining processes, International Journal of Machine Tools & Manufacture (2007) doi:10.1016/j.ijmachtools.2007.08.023
[8] M. Mahardika and K. Mitsui, Total energy of discharge pulse calculation by stochastic methods, Proceeding of the International Conference of the 10thAUN/SEED.Net Field Wise Seminar, Hanoi, Vietnam in 28th–29th August 2007.
[9] “s prabhu1, b k vinayagam” Nano surface generation of grinding process using carbon nano tubes S¯adhan¯a Vol. 35, Part 6, December 2010, pp. 747–760
[10] “Hyun-Seok TAK, Chang-Seung HA”, Characteristic evaluation of Al2O3/CNTs hybrid materials for micro-electrical discharge machining.elsevier (2011)s28-s38
[11] “C. Mai & Hong Hocheng” Advantages of carbon nanotubes in electrical discharge machining Int J Adv Manuf Technol DOI 10.1007/s00170-011-3476-2 (2011)
[12]“Gautam kocher1, Karan Chopra”Investigation of Surface integrity of AISI D3 tool steel After EDM International Journal of Emerging Technology and Advanced Engineering (ISSN 2250-2459, Volume 2, Issue 4, April 2012)
[13] S Velusamy, U.O Bidwai, “Effect of Titanium Carbide particle addition in the aluminum composite on EDM process
parameters”. Journal of Manufacturing Processes (2011) 60-66 [14] P. Janmanee & A. Muttamara,” Performance of difference electrode materials in EDM of Tungsten carbide”. Science publication, (2010) 87-90
[15] M.P.Mohan, Y.S.Wong, “A study of Fine finishing die sinking Micro EDM of Tungsten Carbide using different electrode materials”. Journal of Material processing technology (2009) 3956-3967
[16] H.C. Tsai, B.H. Yan,” EDM performance of Cr/Cu-based composite electrodes”. International Journal of Machine Tools & Manufacture (2003) 245-252.
[17] A. A. Khan,” Electrode wear and MRR during EDM of aluminum and mild steel using copper and brass electrodes”. International journal of advance manufacturing (2008)482-487
[18] Y.S.Wong, Y.H. Fuh,” EDM performance of TIC/Copper based Sintered electrode”. Material & Design (2001) 669-678 [19] “yan. Cheng”Machining characteristics and optimization of machining parameters of SKH57 high-speed steel using electrical-discharge machining based on Taguchi method. Materials and Manufacturing Processes, 21(8), 922-929.
[20]“J. Simao, H.G. Lee”.Workpiece surface modification using electrical discharge machining,, 43 (2003) 121–128(2003) [21]“Khalid Hussain SYED, Kuppan PALANIYANDI”Performance of electrical discharge machining using aluminums powder suspended distilled water Turkish J. Eng. Env. Sci (2012)
[22] S.H Tomadi, M.A Hussain,”Analysis of influence of EDM Parameters on Surface quality, MRR, EWR on Tungsten carbide”. IMECS, (2009)
[23] C J Luis, I. Puertas,” MRR and EW study on the EDM of Silicon carbide “, Journal of Material processing technology (2005) 889-896
[24] Nixon Kuruvila and H. V. Ravindra,” Parametric influence and optimization of wire EDM of hot die steel,” Machining Science and Technology (2011), 15:47–7.
[25] Puertas, I. And Luis, C.J., 2004.” A study of optimization of machining parameters for Electrical discharge machining of boron carbide” Materials and Manufacturing Processes,
University.
[27] H. Theil, Principles of Econometrics 622– 27 (1971); G. Chow, Econometrics 320–47 (1983)
[28] Techniques for the estimation of nonlinear regressions have been developed. See, e.g., G.Chow, supra note 9, at 220–51. [29] statistical method for social scientists II0 – I6 johnston econometric method 1972