M E T H O D
Open Access
quantro
: a data-driven approach to guide the
choice of an appropriate normalization method
Stephanie C. Hicks
1,2and Rafael A. Irizarry
1,2*Abstract
Normalization is an essential step in the analysis of high-throughput data. Multi-sample global normalization methods, such as quantile normalization, have been successfully used to remove technical variation. However, these methods rely on the assumption that observed global changes across samples are due to unwanted technical variability. Applying global normalization methods has the potential to remove biologically driven variation. Currently, it is up to the subject matter experts to determine if the stated assumptions are appropriate. Here, we propose a data-driven alternative. We demonstrate the utility of our method (quantro) through examples and simulations. A software implementation is available from http://www.bioconductor.org/packages/release/bioc/html/quantro.html.
Background
Multi-sample normalization techniques such as quantile normalization [1, 2] have become a standard and essen-tial part of analysis pipelines for high-throughput data. These techniques transform the original raw data to remove unwanted technical variation. Technical vari-ation can cause perceived differences between samples processed on high-throughput technologies, irrespective of the biological variation. These differences are typically due to changes in experimental conditions that are hard or impossible to control [3] and confusing them with biological variability can lead to false discoveries [4, 5].
Some of the first attempts at normalizing microarray data mimicked the use of so-called house-keeping genes [6] as was done by the established gene expres-sion measurement technology that preceded microar-rays. This approach did not work well in practice [7, 8]; therefore, data-driven approaches were developed, such as median correction [9, 10], variance-stabilizing trans-formation [11], locally weighted linear regression (loess) [12] and spline-based methods [13]. The general idea of these approaches is to assume that observed variability in global properties are due only to technical reasons and are unrelated to the biology of interest [2, 14]. Here we refer to these asglobal adjustmentmethods [15].
Examples of global properties include the total number of differentially expressed genes across groups, the median gene expression across genes and the statistical distribution of gene expression values. These types of assumptions are justified in many biomedical applica-tions — for example, in gene expression studies in which only a minority of genes (or targeted set of genes) are expected to be differentially expressed. How-ever, if, for example, a substantially higher percentage of genes are expected to be expressed in only one group of samples, it may not be appropriate to use global adjustment methods.
Quantile normalization was originally developed for gene expression microarrays [1, 2] but today it is applied in a wide-range of data types, including genotyping arrays [16, 17], RNA-Sequencing (RNA-Seq) [18–20], DNA methylation [21], ChIP-Sequencing [22, 23] and brain imaging [24–26]. Quantile normalization is a global adjustment method that assumes the statistical distribution of each sample is the same. Normalization is achieved by forcing the observed distributions to be the same and the average distribution, obtained by taking the average of each quantile across samples, is used as the reference. This method has worked very well in practice but note that when the assumptions are not met, global changes in distribution that may be of biological interest will be wiped out and features that are not different across samples can be artificially induced [27]. A schematic of quantile normalization is provided in Fig. 1.
* Correspondence:[email protected]
1Department of Biostatistics and Computational Biology, Dana-Farber Cancer
Institute, 450 Brookline Avenue, Boston, MA 02115-5450, USA
2Department of Biostatistics, Harvard School of Public Health, 677
Huntington Avenue, Boston, MA 02115, USA
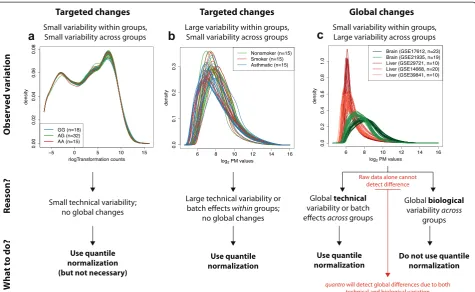
Previously, the burden of deciding if these assumptions hold have been left to the experimentalist. Graphical as-sessments such as boxplots and density plots can be helpful, but they do not provide a quantitative measure of the variability. Here we propose a statistical test, referred to as quantro, for the assumptions of global adjustment methods, such as quantile normalization, that tests for global differences in distributions between groups of samples. Our test uses the raw unprocessed high-throughput data as input to calculate a test statistic comparing the variability of distributions within groups relative to between groups. If the variability between groups is sufficiently larger than the variability within groups, then this suggests there may be global differ-ences in distributions between groups of samples and global adjustment methods may not be appropriate. We demonstrate the advantages of our method by applying it to several gene expression and DNA methylation data-sets with targeted and global changes in distributions (Fig. 2). We define global changes as an abundance of differences between two or more sets of samples affect-ing the shape or the location shift of the distributions across groups caused by a biological or a technical source of variation and targeted changes as differences between sets of samples not affecting the shape or location shift of the distributions caused by a biological or a technical source of variation. To study the specific downstream im-provements afforded byquantrowe studied the specificity and sensitivity of differential expression estimates with a Monte Carlo simulation. Specifically, we studied how glo-bal normalization methods can lead to increased bias in downstream analyses, such as detecting differential methy-lation, when there are global differences in the distribu-tions and how not applying appropriate normalization methods can lead to increased variance. We demonstrate how by guiding the choice of a normalization technique,
our method provides an overall improvement in sensitivity and specificity.
Results
quantro: test for global differences in distributions between groups
Consider a set of raw high-throughput dataXik
represent-ing i ∈ (1, …, nk) samples in each of the k ∈ (1, …, K)
groups (nTtotal samples) from a gene expression or DNA
methylation experiment. We assume Xik has some
com-mon distribution (Xik ∼ ℱk) where ℱk is the theoretical
distribution for the kth group. We define F−ik1 as the observed quantile distribution for theithsample in thekth group. As a first step, we use an ANOVA to test if the average of the medians of the distributions are different across groups and median normalize the samples accord-ingly. Let F−:k1¼ 1
nk
Xnk i¼1F
−1
ik be the quantile distribution averaged across all samples in the kth group and let
F−::1¼K1n1kXK k¼1
Xnk i¼1F
−1
ik be the quantile distribution averaged across all samples and groups.
To quantify the differences between two distributions, we use Mallow’s distance [28], which is defined as the distance between two probability distributions over a region (Eq. S1 in Additional file 1). We define thetotal variance of the distributions as the sum of squared differences betweenFik−1andF−
1
:: using Mallow’s distance
(in the case wherep= 2) as:
SStotal¼
XK k¼1
Xnk
i¼1 Z
F−ik1−F−::1
2
[image:2.595.55.541.90.245.2]XK k¼1
Xnk
i¼1 Z
F−ik1−F−::1
2
¼ XK
k¼1 Xnk
i¼1 Z
F−:k1−F−::1
2
þ XK
k¼1 Xnk
i¼1 Z
F−ik1−F−:k1
2
We propose using a data-driven test statistic, referred to as Fquantro, to test for global differences in the
distri-butions between the K groups. The null hypothesis is that there are no global differences in the distributions between the groups and the alternative hypothesis is that at least one group is different from the rest.
H0: ℱ1¼ℱ2¼⋯¼ℱK
Ha: ℱi≠ℱjfor at least onei; j
If there are no global differences in the distributions between the groups (due to technical or biological vari-ation), we can apply a global adjustment method, such as
quantile normalization, to remove any unwanted technical variation. If there are global differences in the distributions between the groups, quantile normalization may not be an appropriate normalization technique depending on the source of variation (technical or biological variation).
TheFquantrotest statistic (Eq. S8 in Additional file 1) is
a ratio of the mean squared error between groups (MSbetween) to the mean squared error within groups
(MSwithin):
Fquantro¼
MSbetween
MSwithin ¼
SSbetween=ðK−1Þ
SSwithin=ðnT−KÞ
We use permutation testing to assess the statistical significance of Fquantro and reject the null hypothesis if
thepvalue (Eq. S9 in Additional file 1) from the permu-tation test is less than someαsignificance level.
[image:3.595.61.537.88.380.2]Targeted and global changes in gene expression
We applied quantro to several publicly available gene expression datasets based on both microarray and RNA-Seq platforms (Table S1 in Additional file 1) to investi-gate targeted and global differences in distributions across groups. We used anα= 0.05 significance level as the threshold to test for global changes in the distribu-tions across groups. Examples of targeted changes in distributions across groups are the gene expression of samples from the Yoruba (YRI) population stratified by genotype based on an expression quantitative trait loci (eQTL) (p= 0.917; Fig. 2a; Figure S1 in Additional file 1), samples from two inbred mouse strains (p = 0.245; Figure S2 in Additional file 1), samples of alveolar mac-rophages from nonsmokers, smokers and patients with asthma (p = 0.562; Fig. 2b; Figure S3 in Additional file 1), samples of bronchial brushings from individuals with and without chronic obstructive pulmonary disease (p = 0.218; Figure S4 in Additional file 1) and samples from two regions of the brain in patients with Parkinson’s disease (p= 0.264; Figure S5 in Additional file 1). In all of the above examples, quantile normalization is considered appropriate because no global differences in the distributions across groups were detected at the
α= 0.05 significance level.
When comparing the gene expression of two tissues, we found striking global differences in the distributions between brain and liver tissues (p = 0.004; Fig. 2c; Figure S6 in Additional file 1). We considered multiple studies from the Gene Expression Omnibus (GEO) to represent each tissue to prevent batch effects [29] of different studies from GEO being confounded with differences in tissues. We also compared the gene expres-sion of normal and tumor samples. We obtained multiple studies from GEO and found global differences in the distributions between the normal and tumor samples of
lung (p < 0.001; Fig. 2d), breast (p < 0.001), prostate (p < 0.001), thyroid (p < 0.001), stomach (p < 0.001) and liver tissues (p= 0.044) (Figures S7–12 in Additional file 1). We also found global changes in the distributions of liver tissues between four groups of patients (control, healthy obese, steatosis and nash samples) from a study investigating the gene expression of non-alcoholic fatty liver disease (p= 0.004; Figure S13 in Additional file 1).
Targeted and global changes in DNA methylation
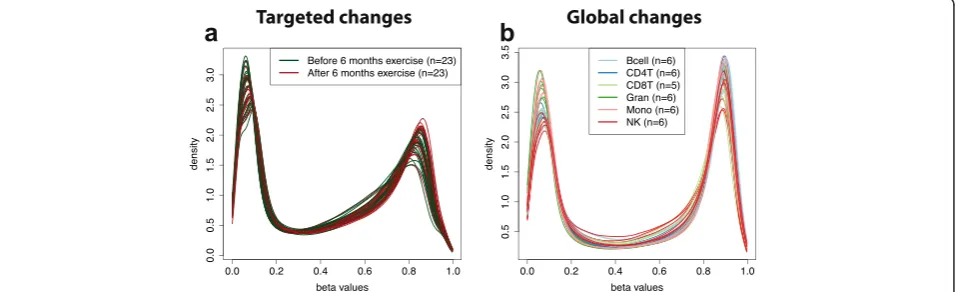
In addition to gene expression, we considered three pub-licly available DNA methylation data sets. We detected no global differences in distributions of adipose tissues from patients before and after six months of exercise (p= 0.132; Fig. 3a; Figure S14 in Additional file 1) and pancreatic tissues from non-diabetic and type 2 diabetes (p= 0.069; Figure S15 in Additional file 1). In contrast, quantro detected global differences in the distributions across six purified cell types from whole blood (p < 0.001; Fig. 3b; Figure S16 in Additional file 1), which may be relevant for the studies estimating the cell composition of whole blood using DNA methylation [30, 31].
quantroimproves the accuracy of detecting differentially methylated CpGs
Here we evaluate the performance of global normalization methods in the context oftargetedandglobalchanges in distributions with the goal of detecting differentially meth-ylated CpGs. We performed a Monte Carlo simulation study to illustrate how the use of global normalization methods, such as quantile normalization, is not always appropriate and the Fquantro test statistic can guide the
choice of normalization. For the simulation study, we simulate DNA methylation arrays with a goal of detecting differentially methylated CpGs, but note these results also translate for differential gene expression. We compare
[image:4.595.61.540.539.685.2]naively using quantile normalization to using quantro to guide the decision of using either quantile normalization or no normalization to assess the cost of using global normalization methods in the context of distributions with global differences.
If there is only a minority of differentially methylated CpGs, quantile normalization reduces the bias and mean squared error (MSE) in detecting true differences between groups of samples because it removes un-wanted technical variation (Figures S21 and S22 in Additional file 1). As the number of differentially meth-ylated CpGs increases, quantile normalization will re-move both the unwanted technical and interesting biological variation, resulting in higher bias and MSE when detecting differential methylation. In contrast, the use ofquantro detects these global differences and therefore reduces the bias and MSE compared with using quantile normalization (Figures S21 and S22 in Additional file 1). Similarly, the number of false discov-eries is reduced when using quantro to guide the normalization choice in the case when there are global differences between groups. For example, when consid-ering a 450K DNA methylation array if there are only a small number of differentially methylated CpGs (1 % of CpGs or 4500 CpGs),quantroand quantile normalization are comparable in the number of false discoveries (873 and 873, respectively), but if there are global differences in the distributions between groups (10 % of CpGs or 45,000 CpGs), quantro is able to detect those global differences and reduce the number of false discoveries compared with quantile normalization (4887 and 6583, respectively) (Figure S23 in Additional file 1). Using quantro gives researchers a data-driven tool to test if global normalization methods are appropriate, such as quantile normalization, which can result in larger bias, MSE and more false discoveries when detecting differ-entially methylated CpGs in the context of global differences in distributions.
In addition, we considered the true positive rate and false positive rate of using quantile normalization and using quantro to guide the choice of normalization while varying the threshold of the number of top differ-entially methylated CpGs selected. If there are only a small number of differentially methylated CpGs, quan-tile normalization and quantro are comparable in per-formance, but when the proportion of differentially methylated CpGs increases, quantile normalization fails to detect global differences between the groups, result-ing in lower sensitivity and specificity (Figure S24 in Additional file 1). Usingquantroas a tool to determine which type of normalization approach to employ results in higher sensitivity and specificity when detecting true differentially methylated CpGs compared with naively using quantile normalization.
Discussion
The advent of high-throughput technologies brought the opportunity for researchers to investigate and assess biological variability at the genomic level, but it also introduced unwanted technical variability that can cause perceived differences between samples processed on high-throughput technologies, irrespective of the bio-logical variation. These differences may be due to dif-ferences in the way the samples were processed (such as batch effects) or to platform-dependent technical variation. Because global changes in distributions be-tween groups can be caused by both technical variation and biological variation, it is important to note that our test statistic Fquantro will detect global differences
caused by both technical variation (e.g., batch effects) and biological variation. Data alone cannot determine if global changes are caused by technical variation or bio-logical variation (Fig. 2), but quantrooffers researchers a new tool to detect when there are global changes in distributions across groups.
Asquantroassess the assumptions of global normalization methods, it is important to note other global normalization methods such as VSN [11], Loess [12] and the trimmed mean method [32] make different assumptions about the true biological variability [33]. For example, the trimmed mean method assumes most genes are not differentially expressed and uses a global linear scaling factor for normalization. Similarly, Loess uses local scaling factors in a moving window. In contrast to scaling factors, VSN is based on a slightly different assumption that the variance is constant and transforms the raw data such that the vari-ance is constant across expression levels, reducing the variability observed in regions with low expression. The method introduced here, quantro, is not a normalization method, but rather it tests the assumptions of global normalization methods that assume there are no global dif-ferences in the distributions to guide the choice or whether or not global normalization methods are appropriate.
examples of a method that will likely remove true global differences as these are often captured by the first princi-pal components. In addition, methods that rely on control genes, such as RUV [15], are similar to other forms of global normalization methods such as subset quantile normalization.
Previous studies have evaluated and discussed normalization methods with and without global adjust-ments [2, 15, 32, 36], but the decision of which type of normalization method to use depends on the outcome of interest. For example, a recent study [27] discussed the use of normalization procedures in global gene expression analysis comparing two schematics: targeted changes in gene expression and global changes in gene expression such as transcriptional amplification [37] or transcriptional shutdown [38]. Not surprisingly, the au-thors show normalization methods with global adjust-ments are not appropriate if the total RNA is not the same across the samples. In this case, if normalization is performed at the experimental level (introducing similar amounts of RNA into the assay from the two groups with global changes), then we suggest using control genes or spike-in controls as no differences between the distributions will be detected (Figure S25 in Additional file 1). However, for the great majority of studies such strategies are not available. Furthermore, if one knows a priori that most genes are differentially expressed, then high-throughput technologies may not be the optimal tool as these technologies are mainly used and have been optimized for finding specific genes that are dif-ferentially expressed between groups of samples.
Conclusions
Normalization methods with global adjustments are widely used for data analysis in genomics, but rely on assumptions about the data generation process that are not appropriate in certain contexts. To the best of our knowledge, there is no quantitative method available to assess if the stated assumptions are appropriate or not, leaving the decision up to subject matter experts. Our method is the first to provide a data-driven solution to test the assumptions of global normalization methods. We have demonstrated the utility of our method by applying it to several gene expression and DNA methy-lation datasets, revealing examples of both targeted and global changes in distributions across groups, such as the global changes in distributions detected between the gene expression of brain and liver tissues. We demonstrated that global normalization methods can lead to increased bias and MSE in downstream analyses when there are global differences in distributions and quantro can detect when global normalization methods are not appropriate, which can prevent removing potentially in-teresting biological variation. We have implemented
our method into the quantro R-package providing re-searchers a tool to test the assumptions of global normalization methods in the analysis of their own data.
Materials and methods Data analysis
The method introduced here has been implemented into the quantro R-package available on Bioconductor. We used permutation testing to assess the statistical significance of the test statistic and distributed the computations across multiple cores to increase the speed. To test for global differences in distributions between groups of samples from high-throughput data sets, we applied quantro to several publicly available gene expression and DNA methylation data sets. Table S1 in Additional file 1 contains a list of all the data sets. For this analyses, we use the α= 0.05 significance level as the threshold to detect global changes in the distri-butions across groups.
To compare the gene expression on microarrays of cancer samples and brain and liver tissues, we consid-ered multiple studies from GEO [39] to represent each tissue to prevent batch effects of different studies from GEO being confounded with differences between can-cer samples or between tissues. For the gene expression samples using microarrays, we extracted the raw per-fect match (PM) values from the CEL files using the affyR/Bioconductor package [40]. To visualize the true biological variation in the experimentally normalized samples from Lovén et al. [27], we divided the raw PM values by the sample mean of the PM values across the spike-ins on the log2 scale. For the gene expression samples using RNA-Seq, we used the rlogTransforma-tion provided in the DESeq2 R/Bioconductor package [41] to transform the raw counts to the log2 scale, which reduces the variability in the low counts, but other transformations can be used such as the Variance Stabilizing Transformation (VST) in the DESeq2 pack-age. The RNA-Seq data were obtained from ReCount [42], which pre-processes the raw sequencing data and provides a table of raw counts for each gene. We removed all the rows with zero counts across all the samples. For the DNA methylation samples using microarrays, we used theminfiR/Bioconductor package [43]. We extracted the raw methylated and unmethylated signal using and com-puted the ‘beta’-values using Illumina’s default setting of theoffsetparameter equal to 100.
Details for simulation studies
technology, we use the Langmuir adsorption model [44] to model the chemical saturation in the hybridization of the probes. Each of the simulation studies considered two groups with five samples each (total of ten samples).
With the goal of detecting differentially methylated CpGs, we compared the performance of quantro to the naïve approach of always using quantile normalization wherequantro uses the Fquantrotest statistic to decide if
quantile normalization is appropriate (no normalization otherwise; Section 4 in Additional file 1). For the permu-tation testing inquantro, we used 100 permutations and a cutoff threshold ofα= 0.05, unless specified otherwise. After normalization, the difference between the group means were estimated and the top differentially methyl-ated probes were found using at-test.
We assessed the relative bias (bias fromquantroto the bias from quantile normalization) and relative MSE while varying the cutoff threshold from quantro and for a fixed threshold atα= 0.05. We simulated DNA methy-lation samples with a varying proportion of differentially methylated CpGs between the two groups and a varying level of technical variation (see Sections 3 and 4 in Additional file 1 for more details).
To select a list of top differentially methylated probes, we adjusted thepvalues from at-test using the Benjamini and Hochberg adjustment to correct for multiple testing. The number of false discoveries was calculated using as the number of incorrectly selected probes from a given set of top differentially methylated probes. The true positive rate was calculated as the number of correctly selected probes from the set of true differentially methylated probes. In contrast, the false positive rate was calculated as the number of incorrectly selected probes from the set of probes that are not differentially expressed.
Software
The R-packagequantroimplementing our method is avail-able in Bioconductor 3.1 [45]) (software license GNU GPL 3.0) and the quantroSim R-package to simulate gene expression and DNA methylation data is available on GitHub [46].
Additional file
Additional file 1:Supplementary materials are available in a single pdf.All scripts containing the code for these analyses are available on GitHub [47].
Abbreviations
GEO:Gene Expression Omnibus; MSE: mean squared error; PM: perfect match.
Competing interests
The authors declare that they have no competing interests.
Authors’contributions
SCH and RAI developed the methodquantroand the models used in
quantroSim. SCH wrote thequantroandquantroSimR packages, analyzed the gene expression and DNA methylation data and performed the simulation studies. SCH and RAI wrote the manuscript. Both authors read and approved the final manuscript.
Funding
SCH and RAI were supported by NIH R01 grants GM083084 and RR021967/ GM103552.
Received: 20 February 2015 Accepted: 18 May 2015
References
1. Amaratunga D, Cabrera J. Analysis of data from viral DNA microchips. J Am Stat Assoc. 2001;96:1161–70.
2. Bolstad BM, Irizarry RA, Astrand M, Speed TP. A comparison of normalization methods for high density oligonucleotide array data based on variance and bias. Bioinformatics. 2003;19:185–93.
3. Scherer A. Batch effects and noise in microarray experiments. Chichester, United Kingdom: John Wiley & Sons; 2009.
4. Allison DB, Cui X, Page GP, Sabripour M. Microarray data analysis: from disarray to consolidation and consensus. Nat Rev Genet. 2006;7:55–65. 5. Auer PL, Doerge RW. Statistical design and analysis of RNA sequencing data.
Genetics. 2010;185:405–16.
6. Butte AJ, Dzau VJ, Glueck SB. Further defining housekeeping or“maintenance”, genes focus on“Aacompendium of gene expression in normal human tissues”. Physiol Genomics. 2001;7:95–6.
7. Eisenberg E, Levanon EY. Human housekeeping genes are compact. Trends Genet. 2003;19:362–5.
8. Eisenberg E, Levanon EY. Human housekeeping genes, revisited. Trends Genet. 2011;29:569–74.
9. Cho RJ, Campbell MJ, Winzeler EA, Steinmetz L, Conway A, Wodicka L, et al. A genome-wide transcriptional analysis of the mitotic cell cycle. Mol Cell. 1998;2:65–73.
10. Selinger DW, Cheung KJ, Mei R, Johansson EM, Richmond CS, Blattner FR, et al. RNA expression analysis using a 30-base pair resolutionEschericha coli
genome array. Nat Biotechnol. 2000;18:1262–8.
11. Durbin BP, Hardin JS, Hawkins DM, Rocke DM. A variance-stabilizing transformation for gene-expression microarray data. Bioinformatics. 2002;18:S105–10.
12. Yang YH, Dudoit S, Luu P, Lin DM, Peng V, Ngai J, et al. Normalization for cDNA microarray data: a robust composite method addressing single and multiple slide systematic variation. Nucleic Acids Res. 2002;30, e15. 13. Workman C, Jensen LJ, Jarmer H, Berka R, Gautier L, Nielser HB, et al. A new
non-linear normalization method for reducing variability in DNA microarray experiments. Genome Biol. 2002;3:research0048.1–research0048.16. 14. Reimers M. Making informed choices about microarray data analysis. PLoS
Comput Biol. 2010;6, e1000786.
15. Gagnon-Bartsch JA, Speed T. Using control genes to correct for unwanted variation in microarray data. Biostatistics. 2012;13:539–52.
16. Carvalho BS, Louis TA, Irizarry RA. Quantifying uncertainty in genotype calls. Bioinformatics. 2010;15:242–9.
17. Scharpf RB, Irizarry RA, Ritchie ME, Carvalho B, Ruczinski I. Using the R package crimm for genotyping and copy number estimation. J Stat Softw. 2011;40:1–32.
18. Cloonan N, Forrest AR, Kolle G, Gardiner BB, Faulkner GJ, Brown MK, et al. Stem cell transcriptome profiling via massive-scale mRNA sequencing. Nat Methods. 2008;5:613–9.
19. Bullard JH, Purdom E, Hansen KD, Dudoit S. Evaluation of statistical methods for normalization and differential expression in mRNA-Seq experiments. BMC Bioinformatics. 2010;11:94.
20. Dillies MA, Rau A, Aubert J, Hennequet-Antier C, Jeanmougin M, Servant N, et al. A comprehensive evaluation of normalization methods for Illumina high-throughput RNA sequencing data analysis. Brief Bioinform. 2013;14:671–83.
22. Bilodeau S, Kagey MH, Frampton GM, Rahl PB, Young RA. SetDB1 contributes to repression of genes encoding developmental regulators and maintenance of ES cell state. Genes Dev. 2009;23:2484–9.
23. Kasowski M, Grubert F, Heffelfinger C, Hariharan M, Asabere A, Waszak SM, et al. Variation in transcription factor binding among humans. Science. 2010;328:232–5.
24. Nyúl LG, Udupa JK, Zhang X. New variants of a method of MRI scale standardization. IEEE Trans Med Imaging. 2000;19:143–50. 25. Shah M, Xiao Y, Subbanna N, Francis S, Arnold DL, Collins DL, et al.
Evaluating intensity normalization on MRIs of human brain with multiple sclerosis. Med Image Anal. 2011;15:267–82.
26. Shinohara RT, Sweeney EM, Goldsmith J, Shiee N, Mateen FJ, Calabresi PA, et al. Statistical normalization techniques for magnetic resonance imagine. Neuroimage Clin. 2014;6:9–19.
27. Lovén J, Orlando DA, Sigova AA, Lin CY, Rahl PB, Burge CB, et al. Revisiting global gene expression analysis. Cell. 2012;151:476–82.
28. Mallows CL. A note on asymptotic joint normality. Ann Math Statist. 1972;43:508–15.
29. Leek JT, Scharpf RB, Bravo HC, Simcha D, Langmead B, Johnson WE, et al. Tackling the widespread and critical impact of batch effects in high-throughput data. Nat Rev Genet. 2010;11:733–9.
30. Houseman EA, Accomando WP, Koestler DC, Christensen BC, Marsit CJ, Nelson HH, et al. DNA methylation arrays as surrogate measures of cell mixture distributions. BMC Bioinformatics. 2012;13:86.
31. Koestler DC, Christensen B, Karagas MR, Marsit CJ, Langevin SM, Kelsey KT, et al. Blood-based profiles of DNA methylation predict the underlying distribution of cell types: a validation analysis. Epigenetics. 2013;8:816–26. 32. Robinson MD, Oshlack A. A scaling normalization method for differential
expression analysis of RNA-seq data. Genome Biol. 2010;11:R25. 33. Garmire LX, Subramaniam S. Evaulation of normalization methods in
mammalian microRNA-Seq data. RNA. 2012;18:1279–88.
34. Leek JT, Storey JD. Capturing heterogeneity in gene expression studies by surrogate variable analysis. PLoS Genet. 2007;3:1724–35.
35. Stegle O, Parts L, Piipari M, Winn J, Durbin R. Using probabilistic estimation of expression residuals (PEER) to obtain increased power and interpretability of gene expression analyses. Nat Protoc. 2012;7:500–7.
36. Quackenbush J. Microarray data normalization and transformation. Nat Genet. 2002;32:496–501.
37. Lin CY, Lovén J, Rahl PB, Paranal RM, Burge CB, Bradner JE, et al. Transcriptional amplification in tumor cells with elevated c-Myc. Cell. 2012;151:56–67. 38. Bar-Joseph Z, Glitter A, Simon I. Studying and modeling dynamic biological
processes using time-series gene expression data. Nat Rev Genet. 2012;13:552–64.
39. Edgar R, Momrachev M, Lash AE. Gene Expression Omnibus: NCBI gene expression and hybridization array data repository. Nucleic Acids Res. 2002;30:207–10.
40. Gautier L, Cope L, Bolstad BM, Irizarry RA. Affy—analysis of Affymetrix GeneChip data at the probe level. Bioinformatics. 2004;20:307–15. 41. Love MI, Huber W, Anders S. Moderated estimation of fold change and
dispersion for RNA-Seq data with DESeq2. Genome Biol. 2014;15:550. 42. Frazee AC, Langmead B, Leek JT. ReCount: a multi-experiment resource of
analysis-ready RNA-seq gene count datasets. BMC Bioinformatics. 2011;12:449. 43. Aryee MJ, Jaffe AE, Corrada-Bravo H, Ladd-Acosta C, Feinberg AP, Hansen
KD, et al. Minfi: a flexible and comprehensive Bioconductor package for the analysis of Infinium DNA methylation microarrays. Bioinformatics. 2014;30:1363–9.
44. Hekstra D, Taussing AR, Magnasco M, Naef F. Absolute mRNA
concentrations from sequence-specific calibration of oligonucleotide arrays. Nucleic Acids Res. 2003;31:1962–8.
45. quantro. http://www.bioconductor.org/packages/release/bioc/html/ quantro.html.
46. quantroSim. https://github.com/stephaniehicks/quantroSim. 47. quantroadditional material and scripts. http://stephaniehicks.github.io/