6
I
January 2018
Experimental Study on Soil Stabilization using
Waste Fiber Material
R. Krishna Chaitanya1, V. Radha Krishna2
1, 2
Department of Civil Engineering, Narayana Engineering College, Nellore.
Abstract: Soil Stabilization is the alteration of soils to enhance their physical properties. The stabilized soil materials have a higher strength, lower permeability and lower compressibility than the non – stabilized soil. Laboratory tests may be required in order to determine the properties of soil. The main objective of this study is to investigate the effect of polypropylene fibers on soil samples collected at two different locations. The effects of 0.5% polypropylene fiber on Index and Engineering properties of soil were studied. The properties of stabilized soil are compared with natural soil and it is observed that the soil properties are enhanced and improved.
Keywords: Soil Stabilization, Polypropylene Fibers, Index Properties, Engineering Properties, Waste Fibers.
I. INTRODUCTION
For any land based structure, the foundation is very important and has to be strong to support the entire structure. In order for the foundation to be strong, the soil around it plays a very critical role. The process of soil stabilization helps to achieve the required properties in a soil needed for the construction work. In India, the modern era of soil stabilization began in early 1970’s, with a general shortage of petroleum and aggregates, it became necessary for the engineers to look at means to improve soil other than replacing the poor soil at the building site [1]. Soil stabilization was used but due to the use of obsolete methods and also due to the absence of proper technique, soil stabilization lost favour. In recent times, with increase in the demand for infrastructure, raw materials and fuel, soil stabilization has started to take a new shape. With the availability of better research, materials and equipment, it is emerging as a popular and cost – effective method for soil improvement. In this project, soil stabilization has been done with the help of randomly distributed polypropylene fibers obtained from waste materials. Soil stabilization is the process of altering some soil properties by different methods, mechanical or chemical in order to produce an improved soil material which has all the desired engineering properties. Soils are generally stabilized to increase their strength and durability or to prevent erosion and dust formation in soils [2].
Soil properties vary a great deal and construction of structures depends a lot on the bearing capacity of the soil, hence, we need to stabilize the soil which makes it easier to predict the load bearing capacity of the soil and even improve the load bearing capacity. The gradation of the soil is also a very important property to keep in mind while working with soils. Soil stabilization is a process to treat a soil to maintain, alter or improve the performance of the soil as a construction material and very important to minimize the cost of earth work in case of unavailability of good earth at nearby source. The soil can be stabilized by introducing geo textiles and fabrics which are made of synthetic materials, such as polythene, polyester, and nylon. Evangelin Ramani Sujathaet, al, has done research in which geo – grids are used to improve the strength of the sub grade and reduce the pavement thickness. The results show that the strength of the sub grade is considerably increased by introducing geo – grid reinforcement in the soil. It is found that geo – grids placed at 2/3 the distance from the base showed higher CBR than when placed at ½ and 1/3 distances from the base. Polymer soil stabilization refers to the addition of polymers to improve the physical properties of soil. Even at very small concentrations within soils, various polymers have been shown to increase water retention, increase soil bearing capacity [3].
II. EXPERIMENTAL INVESTIGATION A. Materials
Fig. I – Red Loam Soil Fig. II – Black Cotton Soil
[image:3.612.215.399.320.536.2]Polypropylene fiberis used in this study and it is a synthetic material. Fibers used for this study has a length of 12mm were purchased from the market. The water absorption of polypropylene fiber is about 0.3% after 24 hours immersion in water, and thus its regain – the amount of water absorbed in a humid atmosphere is virtually zero. The physical and chemical properties of polypropylene fiber are represented in Table I.
TABLE I Properties of Polypropylene Fiber
S. No. Parameters Value
1 Fiber Type Single
Fiber
2 Unit Weight 0.91 g/cm3
3 Average Diameter 0.034 mm
4 Average Length 12mm
5 Breaking Tensile
Strength 350 MPa
6 Modulus of
Elasticity 3500 MPa
7 Fusion Point 165 ˚C
8 Burning Point 590 ˚C
9 Acid and Alkali Resistance
Very Good
10 Dispensability Excellent
The polypropylene Fiber is represented in Fig. III below,
[image:3.612.199.417.557.718.2]B. Preparation of sample and Testing
The soil sample should be oven dried and then ground. A 0.5% of polypropylene fiber is mixed to the soil sample such that all the fibers were mixed thoroughly and the required water is added. The tests conducted on soil samples are tabulated in Table II. Sample - I without fiber is indicated as S-I and Sample - I with fiber is indicated as S-I (F).
TABLE II Tests Conducted on soil samples
S.No. Name of the Property I.S. Code
1
Index Properties
Liquid Limit IS 2720 –
Part 5
2 Plastic Limit IS 2720 –
Part 5
3 Shrinkage Limit IS 2720 –
Part 6 4 Engineering Properties Compaction Characteristics
IS 2720 – Part 8
5 California Bearing ratio
test
IS 2720 – Part 16
6 Unconfined
Compression test
IS 2720 – Part 10
III. RESULTS AND DISCUSSIONS A. Liquid limit
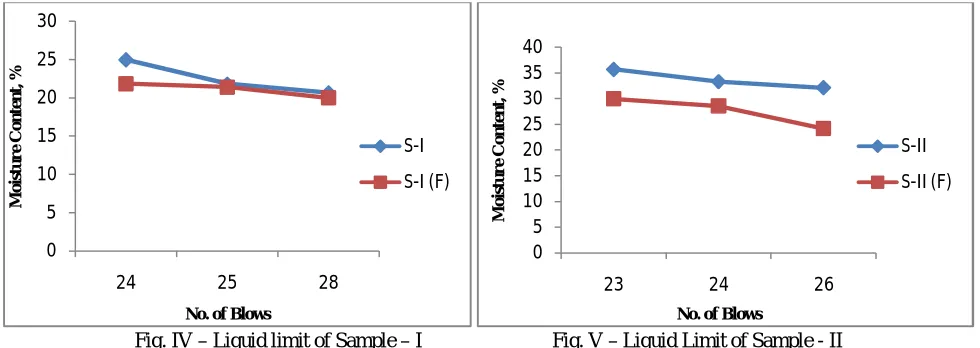
[image:4.612.69.559.410.584.2]Liquid limit, a very important property of fine grained soilcan be defined as “The water content at which soil passes from the plastic to the liquid state under standard conditions”. The limit is expressed as a percentage of the dry weight of the soil. Liquid limit test is carried out according to IS 2720 – Part5 [4]. Liquid limit of two soil samples with and without fiber are represented below in Fig. IV & Fig. V.
Fig. IV – Liquid limit of Sample – I Fig. V – Liquid Limit of Sample - II
From the above flow curves, it is observed that the addition of Fiber results in reduction of liquid limit for both soil samples. The reduction in liquid limit may cause a slight increase in permeability of soils. For Sample – I, the Liquid Limit is reduced by 8.46% and for Sample – II, the Liquid Limit is reduced by 14.79%.
B. Plastic Limit
Plastic Limit is defined as “The moisture content at which soil begins to behave as plastic material”. A plastic material can be moulded in to a shape and the material will retain that shape. Plastic limit test is carried out according to IS 2720 – Part5 [4]. Plastic limit is expressed as a percentage of the weight of the oven dried soil at which the soil can be rolled in to threads one-eight inch in diameter without the soil breaking into pieces. Plastic limit of two soil samples with and without fiber are represented in Fig. VI & Fig. VII. 0 5 10 15 20 25 30
24 25 28
M o is tu r e C o n te n t, %
No. of Blows
S-I S-I (F) 0 5 10 15 20 25 30 35 40
23 24 26
M o is tu r e C o n te n t, %
No. of Blows
S-II
Fig. VI – Plastic limit of Sample – I Fig. VII – Plastic Limit of Sample - II
From the above figures, it is observed that there is a reduction in plastic limit of soil with addition of fiber. The reduction in plastic limit causes less swelling and shrinkage. For sample – I, the plastic limit is reduced by 6%, and for sample – II, plastic limit is reduced by 8.5%. So, addition of fiber makes the soil less plastic or non plastic in some cases.
C. Shrinkage Limit
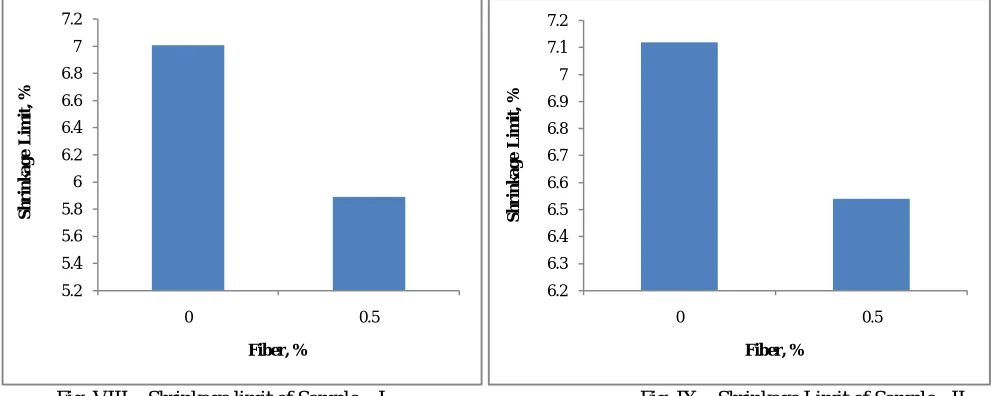
Shrinkage limit of soil is defined as “The water content at which a reduction in water content will not cause a decrease in volume of the soil” or “The amount of water content that converts soil from Semi – Solid state to Solid state”. Liquid limit test is carried out according to IS 2720 – Part6 [5]. Shrinkage limit of two soil samples with and without fiber are represented in Fig VIII & Fig. IX.
Fig. VIII – Shrinkage limit of Sample – I Fig. IX – Shrinkage Limit of Sample - II
From the above figures, it is observed that the shrinkage limit of soil reduces with addition of fiber. The reduction in shrinkage limit indicates there will be less volume change. For sample – I, the shrinkage limit is decreased by 15.9% and for sample – II, shrinkage limit is decreased by 8.14%.
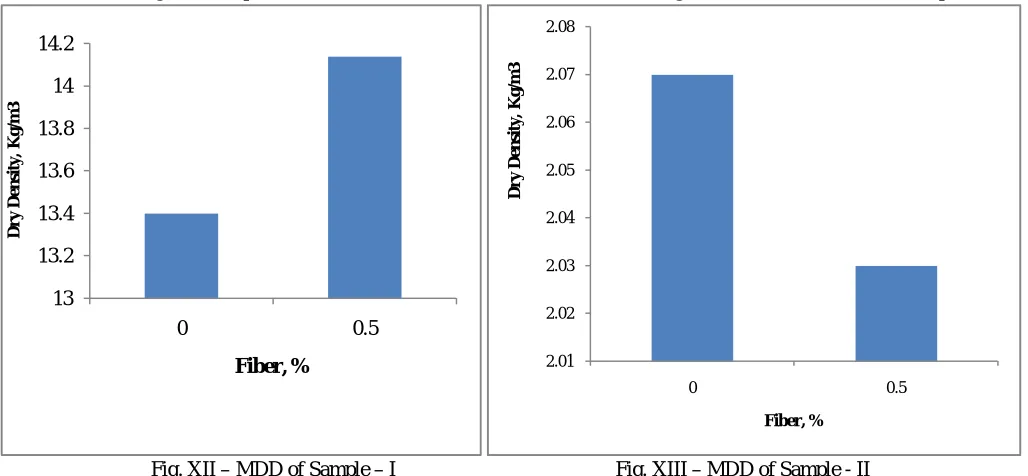
D. Compaction Characteristics
[image:5.612.58.558.377.575.2]Fig. X – OMC of Sample – I Fig. XI – OMC of Sample – II
From Fig.’s X, XI, XII & XIII – with addition of fiber, optimum moisture content increases which causes a reduction in maximum dry density (MDD). Less water absorption and light weight of polypropylene fiber causes increase in OMC and decrease in MDD. Therefore, addition of 0.5% fiber results in 11.2% increase in OMC and 0.5% decrease in MDD for sample – I, where as for sample – II, 5.52% increase in OMC and 1.93% decrease in MDD.
E. California Bearing Ratio (CBR)
The California Bearing ratio is a penetration test for evaluation of the mechanical strength of soil. It is the ratio of force per unit
Fig. XII – MDD of Sample – I Fig. XIII – MDD of Sample - II
area required to penetrate a soil mass with circular piston at the rate of 1.25mm/min. to that required for the corresponding penetration of a standard material. CBR test on two soil samples is done according to IS 2720 – Part 16 [7] and the results are represented in Fig. XIV& Fig. XV.
13.5 14 14.5 15 15.5 16 16.5 0 0.5 M o is tu r e C o n te n t, % Fiber, % 13 13.2 13.4 13.6 13.8 14 14.2 0 0.5 M o is tu r e C o n te n t, % Fiber, % 13 13.2 13.4 13.6 13.8 14 14.2 0 0.5 D r y D e n si ty , K g /m 3
Fiber, % 2.01
[image:6.612.51.565.420.658.2]Fig. XIV – CBR of Sample – I Fig. XV – CBR of Sample - II
The CBR values have been calculated for the load corresponding to the penetration of 2.5 mm and 5.0 mm. Generally the CBR value at 2.5mm penetration is higher. However, in the present study the CBR values of fiber reinforced for red loam soil at 5.0mm are found to be higher than those at 2.5 mm penetration. The polypropylene fiber samples shows improvement in CBR values. The CBR Values are increased by 16.25% for sample – I and 25.36% for sample –II. The CBR test results showed that the addition of polypropylene fibers significantly improved the behaviour of soil.
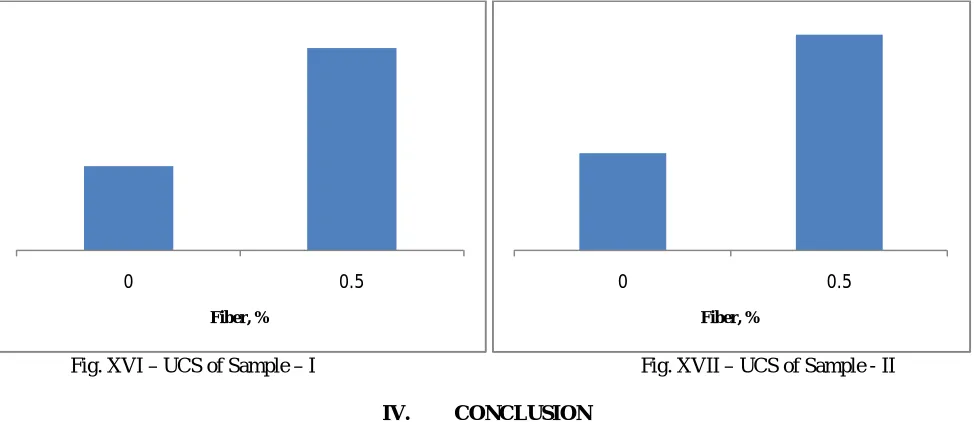
F. Unconfined Compression Strength:
The Unconfined Compression strength (UCS) test is used to measure the shearing resistance of cohesive soils which may be undisturbed or remoulded specimens. An axial load is applied using either strain – control or stress – control condition. The test is carried out according to IS 2720 – Part 10 [8]. The results are represented in Fig. XVI & Fig. XVII. In the present study, UCS test on fiber reinforced samples shows higher values than non – fiber samples. Addition of polypropylene fiber improves the soil strength by 11.86% for sample – I and 19.79% for Sample – II. The UCS test results showed that the addition of polypropylene fiber improved the behaviour of soil.
Fig. XVI – UCS of Sample – I Fig. XVII – UCS of Sample - II
IV. CONCLUSION
With addition of 0.5% polypropylene fiber to soil,
1) Liquid Limit is decreased for both sample – I and sample – II. The reduction in liquid limit for soil may cause a slight increase in permeability.
0 100 200 300 400 500 600
0.0 0.2 1.0 1.5 2.0 2.5 3.0 4.0 5.0 7.5 10.0 12.5
Lo
a
d
,
k
N
Penetration, mm
S-II S-II (WF)
0 50 100 150 200 250 300 350
0.0 0.2 1.0 1.5 2.0 2.5 3.0 4.0 5.0 7.5 10.0 12.5
Lo
a
d
,
k
N
Penetration, mm
S-I S-I (WF)
0 0.5
Fiber, %
0 0.5
[image:7.612.72.559.461.672.2]2) Plastic Limit is decreased for both sample – I and sample – II. The reduction in plastic limit for soil results in less swell and shrinkage.
3) Shrinkage Limit is decreased for both sample – I and sample – II. The reduction in shrinkage limit results in less volume change.
4) Optimum moisture content and maximum dry density of soil decreases due to the less water absorption & light weight of polypropylene fiber.
5) CBR Values are increased by 16.25% for sample – I and 25.36% for sample –II.
6) UCS values are increased by 11.86% for sample – I and 19.79% for Sample – II.
REFERENCES
[1] Raja.K, Sivaraja. M, Kathirvel. M, “Stabilization of waste soil at Karur dump yard by using polypropylene fiber”, International Journal of Modern Engineering research (IJMER), Vol. 5, pp. 38-42, August 2015.
[2] www.in.gov/indot/files/smod.pdf
[3] Mukesh A. Patel, Dr. H. S. Patel, “A Review on Effects of Stabilizing Agents for Stabilization of Weak Soil”, Civil and Environmental Research, Vol. 2, No.6, 2012.
[4] _____Methods of Tests for Soils, IS 2720 – Part 5, 1985 (Reaffirmed – 2008), Bureau of Indian Standards, New Delhi. [5] _____Methods of Tests for Soils, IS 2720 – Part 6, 1972 (Reaffirmed – 2001), Bureau of Indian Standards, New Delhi. [6] _____Methods of Tests for Soils, IS 2720 – Part 8, 1983 (Reaffirmed – 2006), Bureau of Indian Standards, New Delhi. [7] _____Methods of Tests for Soils, IS 2720 – Part 16, 1987, Bureau of Indian Standards, New Delhi.