Educational Policy Studies Dissertations Department of Educational Policy Studies
Spring 5-15-2015
A Multilevel Analysis of Institutional Factors
Affecting Student Success at Community Colleges
Aaron ThomasonGeorgia State University
Follow this and additional works at:https://scholarworks.gsu.edu/eps_diss
This Dissertation is brought to you for free and open access by the Department of Educational Policy Studies at ScholarWorks @ Georgia State University. It has been accepted for inclusion in Educational Policy Studies Dissertations by an authorized administrator of ScholarWorks @ Georgia State University. For more information, please contactscholarworks@gsu.edu.
Recommended Citation
Thomason, Aaron, "A Multilevel Analysis of Institutional Factors Affecting Student Success at Community Colleges." Dissertation, Georgia State University, 2015.
This dissertation, A MULTILEVEL ANALYSIS OF INSTITUTIONAL FACTORS
AFFECTING STUDENT SUCCESS AT COMMUNITY COLLEGES, by AARON NEIL
THOMASON, was prepared under the direction of the candidate’s Dissertation Advisory
Committee. It is accepted by the committee members in partial fulfillment of the requirements
for the degree, Doctor of Philosophy, in the College of Education, Georgia State University.
The Dissertation Advisory Committee and the student’s Department Chairperson, as
representatives of the faculty, certify that this dissertation has met all standards of excellence and
scholarship as determined by the faculty.
_________________________________ William L. Curlette, Ph.D.
Committee Chair
_________________________________ Hongli Li, Ph.D.
Committee Member
_________________________________ Richard Lakes, Ph.D.
Committee Member
_________________________________ Blaine Bennett, Ph.D.
Committee Member
_________________________________
Date
_________________________________ William L. Curlette, Ph.D.
Chairperson, Department of Educational
Policy Studies
_________________________________
Paul Alberto, Ph.D.
By presenting this dissertation as a partial fulfillment of the requirements for the advanced
degree from Georgia State University, I agree that the library of Georgia State University shall
make it available for inspection and circulation in accordance with its regulations governing
materials of this type. I agree that permission to quote, to copy from, or to publish this
dissertation may be granted by the professor under whose direction it was written, by the College
of Education’s Director of Graduate Studies, or by me. Such quoting, copying, or publishing
must be solely for scholarly purposes and will not involve potential financial gain. It is
understood that any copying from or publication of this dissertation which involves potential
financial gain will not be allowed without my written permission.
All dissertations deposited in the Georgia State University library must be used in accordance
with the stipulations prescribed by the author in the preceding statement. The author of this
dissertation is:
Aaron Neil Thomason Educational Policy Studies
College of Education Georgia State University
The director of this dissertation is:
William L. Curlette, Ph.D.
Department of Educational Policy Studies College of Education
Aaron Neil Thomason
ADDRESS: 30 Pryor St, Suite 450 Atlanta, GA 30303
EDUCATION:
PROFESSIONAL EXPERIENCE:
2009-Present Systems Engineer
ZogoTech LLC
2004-2009 Database Administrator
Georgia State University
2000-2004 Clinical Instructor II
University of Central Arkansas
PRESENTATIONS:
Thomason, A. N. (March, 2009). “VB Mailer: The Only Email Tool You’ll Ever Need.” Atlanta Code Camp, Atlanta, GA.
Thomason, A. N. (March, 2008). “PDF Forms Management.” Atlanta Code Camp, Decatur, GA.
Thomason, A. N., LaMar J. (July, 2004). "Build or Buy." Syllabus 2004, Technology in Higher Education Conference. San Francisco, CA.
Thomason, A. N., Jones, Jeffrey M. (January, 2003). "Candidate Information System." College of Education Program Coordinators Special Meeting, Conway, AR.
Ph.D. 2015 Georgia State University
Educational Policy Studies
M.S.E. 1997 University of Central Arkansas
Elementary Education with a Gifted Emphasis
B.S.E. 1996 University of Central Arkansas
vember, 2002). "Technology: Meeting the Needs of Faculty & Students." Southeastern Re-gional Association of Teacher Educators, Hot Springs, AR.
McHaney, J., Barnes, D., Vaughn, K., & Thomason, A. N. (August, 2002). "Using Information Technology to Systematically Gather and Evaluate Candidate Performance Assessments." 2002 Southeast Regional Association of Teacher Educators, Hot Springs, AR.
Thomason, A. N. (April, 2002). "Attendance Manager." TechFest 2002, University of Central Arkansas, Conway, AR.
Thomason, A. N. (April, 2002). "Tapping into SQL Server 2000: Creating a Faculty Vita On-Demand." TechFest 2002, University of Central Arkansas, Conway, AR.
McHaney, J., Barnes, D. & Thomason, A. N. (April, 2002). "Performance Assessment Using a Web-Based System." Mid-South Instructional Technology Conference, Murfreesboro, TN.
Thomason, A. N. (April, 2001). "Web Course Tools." AAIM Conference, Hot Springs, AR.
Benson, T. R., Thomason, A. N. (October, 2000). "Portfolio Development." University of Cen-tral Arkansas, IDC Special Topic Seminar, Conway, AR.
PUBLICATIONS:
Thomason, A. N. (March, 2004). "Assessment with a New Mindset." Syllabus: Technology in Higher Education, vol. 17, no. 8. pgs 30-32.
McHaney, J., Barnes, D. & Thomason, A. N. (April, 2002). Performance-based assessment in teacher preparation using a web-bases system. Proceedings from Mid-South Instructional Technology Conference.
Thomason, A. N. (December, 1996). “A Study of the Affective Needs of Gifted Children in 10 Schools.” University of Central Arkansas Honors College. Funded by SILO (Science Infor-mation Liason Office).
PROFESSIONAL SOCIETIES AND ORGANIZATIONS
AT COMMUNITY COLLEGES
by
AARON NEIL THOMASON
Under the Direction of William L. Curlette, Ph.D.
ABSTRACT
Community colleges serve approximately fifty percent of all students seeking post-secondary
education, yet few studies have specifically focused on institutional policies and factors that
affect student success. The purpose of this study is to investigate important institutional and
student factors affecting student success in order to better inform community college policy
makers. Utilizing transcript level data over a period of seven years from 28 community colleges
across 6 states, multilevel growth analyses were conducted using hierarchical linear modeling.
This permits teasing out the effects of institutional policies on three student success outcomes:
(a) grade point averages, (b) enrollment intensity, and (c) completion rate in classes. This study
adds to the limited research on 2-year community colleges using transcript level data to
investigate institutional factors related to student success. Results show that institutions that
report mid-term grades show a positive effect on the grade point average and the completion rate
of classes after controlling for student factors. Institutional size is negatively associated with
INDEX WORDS: Hierarchical Linear Modeling, Growth Model, Community College,
AT COMMUNITY COLLEGES
by
Aaron Neil Thomason
A Dissertation
Presented in Partial Fulfillment of Requirements for the
Degree of
Doctor of Philosophy
in
Research, Measurement, and Statistics
in
Educational Policy Studies
in the
College of Education
Georgia State University
I want to thank Randy Jones, Mike Metzler and Ron Calarusso for hiring me to the
Dean’s Office for the College of Education at GSU. They took a chance on hiring me all the way
from Arkansas, and I could not have started this PhD program without their support and belief in
me. The Dean’s Office was a tremendous work environment, and it gave me the chance to work
with so many of the incredible faculty of the College of Education. I especially want to thank
Mike Metzler who included me on everything and was literally the best boss I have ever had.
I would be remiss if I did not thank Jane McHaney who encouraged me to start a PhD
program while she was my Dean in the College of Education at the University of Central
Arkansas. Your recommendation to Ron Calarusso to hire me is what got this whole thing
started. Your support of me at UCA and beyond is what made all of this possible.
To the faculty of Educational Policy Studies, your passion for teaching and your
compassion for students is what I will remember the most. Sheryl Gowen, thank you for all the
talks we had when I would just drop by, and thank you so much for serving on my doctoral
advisor committee. Carolyn Furlow and Phil Gagne, I learned so much from your classes on
HLM, SAS, and SEM. This dissertation is only possible from what I learned from you both.
Richard Lakes, thank you for the guidance during the seminar class where we prepared the
prospectus. You are exceptional at helping students, and your style for having us prepare and
present the prospectus was immensely helpful. A special thanks as well for serving on my
dissertation committee. Hongli Li, thank you so much for serving on my committee as well.
To Blaine Bennett, I feel like your passion for community colleges and for helping
just amazing to see the interactions you had with students and with your staff. Thank you for
serving on my dissertation committee and being such a great mentor.
To all the great people at ZogoTech, I owe so much. The work we do to help community
colleges inspired this dissertation. The data I was able to get from our colleges is normally
impossible to get. The reputation we have as a company is hopefully enhanced by the work I did
here. I am truly grateful to all of you for supporting me through my studies and for being so
encouraging and excited about this type of data analysis. Keith Wiggans and Rob Spence, thank
you both for talking with the schools about what I was trying to do. I could not have done this
without you guys. Mike Taft, Michael Nguyen, and Rod Mancisidor, thank you so much for
giving me this chance. I hope to repay you by doing more analysis in the future and helping our
schools.
To Bill Curlette, you are truly a dear friend, and I feel so fortunate to have had you as my
major advisor my entire time at GSU. I started in the EPS library with you, and fittingly finished
there as well. Thank you for all the long talks and excitement for new ideas we shared. I felt
priveleged to get so much of your time, and truly appreciate all the guidance you have given me.
To my wife, Erin, you are amazing and truly the love of my life. Thank you for always
being there, for hearing out new ideas, and for helping me put together this dissertation. Bill
thanks you too for not getting too upset when we would end up talking until eight or nine o’clock
Table of Contents
LIST OF TABLES ... v
LIST OF FIGURES ... vi
ABBREVIATIONS ... vii
GLOSSARY OF TERMS ... viii
CHAPTER 1 THE PROBLEM ... 1
Significance of the Study ... 2
Purpose ... 2
Research Questions ... 2
CHAPTER 2 REVIEW OF THE LITERATURE ... 3
CHAPTER 3 METHODOLOGY ... 19
Model Specification ... 19
Participants ... 20
Selection Procedures ... 22
Measures ... 24
Data Analysis Strategy ... 26
CHAPTER 4 RESULTS ... 29
CHAPTER 5 DISCUSSION ... 48
Suggestions for Further Research ... 52
REFERENCES ... 54
LIST OF TABLES
Table 1: Number of students and time points for FTE, Completion, and GPA data sets . 21
Table 2: Number of students by semesters attended ... 22
Table 3: Number of students by institution... 24
Table 4: Summary of Unconditional Means Models ... 30
Table 5: Comparison tests for three- and two-level nested models ... 31
Table 6: Unconditional Growth Models ... 31
Table 7: Fixed Effect Estimates for Unconditional Growth Models ... 32
Table 8: Comparison Tests for Models with Random Effects ... 34
Table 9: Comparison Tests for Models with Autocorrelation ... 37
Table 10: Final FTE Model Estimates ... 38
Table 11: Final Completion Model Estimates ... 39
Table 12: Final GPA Model Estimates ... 40
Table 13: Summary of Institutional Factors ... 48
LIST OF FIGURES
Figure 1: FTE Unconditional Growth Model ... 32
Figure 2: Completion Unconditional Growth Model ... 33
Figure 3: GPA Unconditional Growth Model ... 33
Figure 4: FTE UGM Adjustments ... 36
Figure 5: Completion UGM Adjustments ... 36
Figure 6: GPA UGM Adjustments ... 37
Figure 7: Effect of Repeating 2 Classes on GPA ... 47
Figure 8: Effect of Pell Awards on Completion Rate ... 48
ABBREVIATIONS
GPA Grade point average
FTE Full-time enrollment
ICC Intraclass Correlation Coefficient
IRB Institutional Review Board
IPEDS Integrated Postsecondary Education Data System
NELS National Education Longitudinal Study
GLOSSARY OF TERMS
Departures – In this study, a departure refers to a student’s last term attended regardless of
whether he or she dropped out, transferred, or graduated. It refers simply to the last time a
student was observed at an institution in this study.
Enrollment pathway – This is the pattern of enrollment over time. Some students attend 1 term
and leave college (one term and done). Others enroll every fall and spring term either full- or
part-time without any skipping any terms (known as continuous enrollment). Other student start
with a full-time load and in subsequent terms reduce their load.
Incidental student – A student that earns 10 or fewer credits at an institution.
Open-door enrollment – The unrestricted enrollment of students at a college. A college has an
open-door enrollment policy when it accepts to enroll students without asking for evidence of
previous education, experience, or references. Usually payment of the academic fees is all that is
required to enroll. This type of policy is commonly used by many junior colleges and community
colleges and differs from selective admission policies held by most liberal arts colleges and
research universities which often take into account standardized test scores as well as other
academic qualifications or character references. Colleges with an open-door enrollment policy as
Time wave – In growth modeling, this refers to an observation of an outcome for a student at a
point in time. This could also be called a wave of data.
Traditional aged – In this study, these students are 18-24 years of age. In this study,
non-traditional aged student would then refer to students 25 and older. However, in a reference cited
Community colleges serve as the gateway to higher education for approximately fifty
percent of all postsecondary students. These institutions can be characterized as open-access
in-stitutions that enroll a disproportionate number of minority, low income, and other
underrepre-sented populations as compared to four-year schools. Students that attend community colleges
leave college without a degree at twice the rate of students at four-year institutions (Strauss &
Volkwein, 2004). To compound this problem, our current assumptions about student retention
are based almost wholly on a university model where traditional aged students are seeking a
de-gree. A paucity of research exists that examines retention factors of community college students.
Even fewer studies have specifically focused on institutional policies and factors that affect
stu-dent success.
Much of the research regarding student persistence in higher education has been limited
to 4-year institutions (Marti, 2007). Marti reports that the literature is biased to 4-year
institu-tions, where less than 10 percent of research includes community college students. Previous
re-search done in community colleges shows that student reasons for attending and their levels of
engagement are vastly different from students at 4-year institutions.
Data from the Beginning Postsecondary Survey shows that 38 percent of students
enrol-ling in a public 2-year school did so because of either personal enrichment or to obtain job skills.
Marti (2007) has written that “large percentages of students who enroll at community colleges
have an educational goal that does not necessarily involve earning a degree or certificate from
that institution” (p. 319). He goes on to write that “although measurements of persistence and
attainment are obvious institutional performance measures, there is considerable controversy
Significance of the Study
This study is meant to address the limited research available on community college
stu-dents. Because community college students are known to attend for many reasons other than
ob-taining a degree, this study focuses on term outcomes instead of long-range outcomes. It is hoped
that by examining multiple institutions simultaneously while holding student and time-varying
factors constant, this study should be able to tease out what institutional factors are indeed
relat-ed to student success and enrollment intensity.
Purpose
The purpose of this study is to look at student level and institutional factors that explain
student success in community colleges. This study will add to the limited literature on
institu-tional factors for explaining differences between community colleges. This study will examine
both policy factors that institutions have direct control over and environmental factors that are
normally out of the control of school administrators. The goal of this study is to better inform
community colleges and state legislatures on the various factors associated with community
col-lege success and enrollment intensity.
Research Questions
Six primary research questions will be addressed:
1. What institutional factors contribute to students’ ability to complete credits efficiently?
2. What institutional factors contribute to an increase or decrease in student credit load?
3. What institutional factors have a significant effect on student grade point averages?
4. What student factors are associated with their ability to attend full-time?
5. What student factors have an effect on the completion rate of attempted credits?
CHAPTER 2 REVIEW OF THE LITERATURE
Community Colleges
Community colleges serve an important role as an accessible pathway for a wide range of
students to pursue a college education. At the same time, states face unprecedented constraints
on budgets where the public investment of these funds results in greater scrutiny of student
suc-cess rates. Traditionally, community colleges serve underrepresented student populations who
would have limited access to college otherwise (Bailey et al., 2005).
Community colleges serve an overrepresented population of low-income,
first-generation, and immigrant students. Research has shown that many of these students would not
be in college at all if not for these low-cost institutions that are geographically within commuting
distance for these students. Fifty-one percent of college-aged students attend a community
col-lege in their postsecondary history (Bailey et al., 2005). “Community colcol-leges are the only
feasi-ble entry to higher education for many students due to their relatively low cost and open-door
admission policies” (Marti, 2007, p. 317). Part of the mission of many community colleges is to
directly serve community needs by offering vocational and trade educational programs for adult
learners. This makes for lower degree completion rates since these schools serve students who
are seeking short-term outcomes such as taking one or two classes to improve job skills.
First to second year institutional retention rates in community colleges are estimated at 52
percent (Marti, 2007). Only about a third of all community college students receive any sort of
degree or certificate, even after eight years from initial enrollment (Bailey et al., 2005). The rates
for low-income and minority students is even lower. Only 20 percent of students complete 10
hours, so a good portion of students never accumulate any significant momentum towards a
Characteristics of Community College Students
“Community colleges serve students who usually possess characteristics negatively
asso-ciated with educational attainment. These characteristics include caring for children at home,
single parenting, struggling with financial independence, delaying enrollment after high school
graduation, being a first-generation college student, commuting, lacking a high school diploma,
attending college part-time, working full-time and working off campus” (Burns, 2010, p. 35).
Burns goes on to cite that half of community college students face two or more of the above
challenges while attending.
Westry (2010), in a dissertation studying the goal oriented patterns of adult learners in
community colleges, found that older students can be categorized into one of three categories:
goal-oriented, activity-oriented, or learning-oriented. Westry points out that older students are
seeking a life change by enrolling at a community college, but the goal of their enrollment is
more diverse than simply attaining a degree or seeking a transfer to another institution. Many of
these students have identified a need for self-improvement, a desire to better their existing work
skills, or to seek out a complete career change. The implication here is that community colleges
need to make an assessment of the goals that all students have in enrolling. Westry points out
that there is limited research on non-traditional aged students’ persistence and completion at
two-year institutions. Older students are more than twice as likely as traditional-aged students to
leave college without a degree. Of course, if the reason for attending is not degree-oriented, then
some of this disparity can be explained. Westry reports that 53 percent of all community college
students in 2003-04 were non-traditional aged 24 years or older, compared to just 35 percent at
Measures of student success have looked mostly at graduation rates (Bailey et. al., 2005).
The problem with this is that community college students have a variety of reasons for attending.
Unlike baccalaureate institutions where the assumption that all students are seeking a degree is
plausible, at community colleges there is a high number of incidental students – those who earn
less than 10 credits (Adelman, 2006). Also, with the high number of non-traditional and
disad-vantaged student populations, measures of persistence and completion present unique challenges
for community colleges.
Substantial variation exists in community college students’ postsecondary pathways
(Marti, 2007). Marti used a latent trajectory analysis to identify a core set of common enrollment
patterns of community college students. Using transcript level data from 28 community colleges
in Florida that spanned 3 years, Marti discovered there are five common enrollment patterns: (a)
one term and done, (b) full-time continuous, (c) part-time continuous, (d) steady decliners over
time, and (e) two years and out. This methodology used a student-centered variable approach that
measured credits earned over time. Six time points, one each for fall and spring for three years,
were calculated per student. This latent trajectory method can use both linear and quadratic
equa-tions simultaneously to determine how many underlying student populaequa-tions exist by examining
the time variant nature of earned credits from each of these groups. In the final model, two of the
groups, part-time continuous and the steady decliners, were modeled with a linear equation, and
the other three groups with a quadratic one. The implication for future research is that the
varia-tion in enrollment not only varies substantially in community colleges, but the enrollment trends
are not always linear.
Marti ties membership in these latent trajectory groups to survey results from the
dif-ferences in student engagement among these groups. “Students following less efficient pathways
consistently exhibited lower levels of engagement” (Marti, 2007, p. 330). Basically there are
im-portant behavioral differences directly linked with persistence patterns. Marti notes that one of
the limitations of his study is that the 3 year timeframe may not completely capture all the
en-rollment pathways that students take. He even suggests that future work include data from
multi-ple institutions so that enrollment patterns of students who attend multimulti-ple colleges can be
mod-eled as well.
Student Characteristics influencing Success
A great deal of research suggests that students who attend part-time, come from
low-income families, or have weaker high school preparation skills earn academic awards at lower
rates than other students (Bailey et al., 2005). In a recent review of the literature, Burns (2010)
adds that students who enter college immediately after high school, have parents that attended
college, and attend full-time uninterrupted are most likely to succeed. Several researchers have
cited that math preparation is one of the most predictive indicators of success (Burns, 2010;
Adelman, 2006; Calcogno, 2007; Radcliffe et al., 2006). This preparation is most likely to
hap-pen in high school when students can get direct instruction in this area.
Radcliffe et al. (2006) used a parametric survival analysis model and found that failing a
remedial mathematics course lowered the probability of graduating to 34 percent. Calcogno et al.
(2007) found that a higher percentage of older students were more likely to be remedial in math,
but being enrolled in remedial math was less determinant of success for older students than
younger ones. This suggests that older students can accept needing a refresher course in
Institutional Factors on Success
Why do some colleges have higher completion rates of degrees and certificates than
oth-ers? “Even though community colleges are similar types of institutions on many levels, there is
wide variation among colleges in various student outcome measures such as graduation, transfer,
and retention” (Bailey et al., 2005, p. 1). Limited research has been done to examine institutional
factors on student success at community colleges (Bailey et al., 2005). Institutional size has been
shown to be negatively correlated with student success. Students complete at higher rates at
smaller community colleges. It could be that students get a more personalized experience at the
smaller schools. Smaller schools might also have a more focused set of programs which may
help guide students to a clearer set of outcomes (Bailey et al., 2005).
A larger proportion of minority students (Black, Hispanic, and Native American) lower
the overall institutional success rate, even after controlling for race. Studies of student factors
have found that minorities complete at lower rates, but this finding means that all students at
schools with large minority population will complete at lower rates. However, Bailey et al.
(2005) say this finding needs further investigation
A larger percentage of part-time faculty is correlated with lower graduation rates for an
institution. The reasons here may stem from the differences in educational credentials between
full-time and part-time faculty. The differences between part-time and full-time faculty have not
been fully explored. One theory is that part-time faculty simply do not engage the students as
much as full-time faculty. Part-time faculty may also not be as committed to the goals of the
in-stitution as full-time faculty. There may be less personal connections with students by part-time
faculty. Part-time faculty may also be less available outside the classroom either through limited
Bailey et al. (2005) found that a larger number of part-time students lowers graduation
rates for all students. In a similar respect, institutions that serve a high proportion of part-time
students have lower graduation rates overall. It could be that these institutions face advising
chal-lenges that would otherwise propel more students toward degree attainment. It could also be that
the expectations in the classroom are lessened when a higher proportion of part-time students are
enrolled. Part-time students tend to have less time to study and do homework, and this effect may
hurt all students by causing faculty to lessen the load and the academic intensity of their courses.
Rates of instructional expenditures and student service expenditures have some positive
impact on student success (Bailey et al., 2005). Schools that tend to spend more on student
ser-vices such as tutoring, advising, mentorship programs, technology loan programs, and academic
support resource groups may be more reflective of an institution engaging its student population
more, thus helping students feel more connected to the school and the importance of degree
completion.
There is some evidence that residential institutions are positively associated with student
persistence (Bailey et al., 2005). Conversely, schools that have a higher proportion of commuter
students can expect lower graduation rates. Examining the institutional factors that lead to
stu-dent success has important implications when trying to compare schools on accountability
measures. Two colleges that have different completion rates could actually be equal if one
con-trols for the proportion of low-income and underprepared students. Large differences can occur
between isolated community colleges and those near the heart of a major city. Also, “failing to
control for student’s academic readiness unfairly penalizes institutions, such as community
col-leges, which enroll less well prepared students and give undeserved credit to those with selective
Gaps in the Literature
The 2-year educational sector has historically been understudied (Marti, 2007). Current
understanding of student persistence and completion are based on research using four-year
insti-tutions. Community colleges are wholly different in structure, demography of students, funding
mechanisms, and missions (Bailey et al., 2005). On top of that, community colleges are
open-access institutions that are intentionally non-selective, are available to a wide range of students
with differing college readiness, and are low cost to serve primarily disadvantaged students
(Bai-ley et al., 2005).
In addition to a lack of research of student success in community colleges, the use of
de-gree completion as the student success outcome is limited. Researchers have pointed out that
students attend for various reasons (Burns, 2010; Bailey et al., 2005; Marti, 2007). Using a latent
trajectory analysis, Marti discovered there were five distinct student enrollment patterns. His
study was limited to a three-year enrollment history, and he points out that using a longer
en-rollment window may yield different results and uncover more student groups. Measures of
stu-dent success other than completion of a degree should be considered when evaluating and
com-paring community colleges (Bailey et al., 2005). Thirty-six percent of community college
stu-dents report their reasons for enrolling are to learn new job skills or for personal enrichment
(Bailey et al., 2005).
Bailey et al. (2005) noted that their finding that a larger proportion of minority students at
an institution lowers the probability of success of all students needs further investigation. They
also noted their study was limited to institutional data reported to Integrated Post-Secondary
Da-ta System (IPEDS) and that this system does not include measures of many of the institutional
Variations in how colleges use these types of services may shed light on what types of
interven-tions help to improve student success.
Methodological Limitations
“Current definitions of retention and graduation rates distort the picture of student
suc-cess by limiting it to completion of a degree at the institution of entry” (Jones-White et al., 2010,
p. 154). The most widely used measures of success rely on the Integrated and Post-Secondary
Education System (IPEDS) graduation rates. These rates are limited to students who originally
enrolled for the first time at the institution and graduated within 150 percent of the time it takes a
full-time student to graduate. For community colleges the 150 percent rules mean they report the
graduation rate at the end of the third year. Researchers have cited that this time-frame is
unreal-istic for two-year schools. “By focusing exclusively on institution-specific graduation rates, the
current IPEDS methodology distorts the true picture of student success by underestimating the
actual rate of degree completion” (Jones-White et al., 2010, p. 155).
Adelman (2006) recognized the need for tracking students through the variety of
path-ways they take towards degree attainment. By using data from the National Educational
Longi-tudinal Study from 1998 (NELS:88), which followed a nationally representative traditional-aged
cohort of students who were in eighth grade in 1988 through high school and also into college
through 2000, his study included high school transcripts and all college transcripts through 8
years from graduation in 1992. Adelman reduced the sample of students to those who attended a
four-year college at some point in their post-secondary history. He utilized a logistical regression
of a single outcome, bachelor degree completion to determine factors that contributed to student
DesJardins and Lindsay (2008) were critical of Adelman’s study for its use of a
compo-site variable that was created as a measure of a student’s academic intensity in high school.
Three indicators of high school preparation were combined into a single predictor: curriculum
intensity, high school GPA, and a senior year test score. DesJardins and Lindsay replicated
Adelman’s study and determined that curriculum intensity and high school GPA were both
sig-nificant predictors of college completion, but the senior year test score was not (DesJardins &
Lindsay, 2008). Interestingly, they found that the inclusion of the senior year test score lessened
the effect of the composite variable, but that this variable was still the most predictive of student
success as it was in Adelman’s study.
Adelman pointed out that his study “does not include students who failed to graduate
from high school, those who earned General Education Diplomas (GEDs), those who had not
enrolled in any postsecondary institution by the age of 26, and those who entered the
postsec-ondary system but never attended a bachelor’s degree-granting institution” (Adelman, 2006, p.
xvi). While his study might have included a nationally representative sample of students, the
fi-nal selected sample were all traditiofi-nal-aged students who failed to match the student
demogra-phy at community colleges. Moreover, Adelman limited the studied population to students who
entered a four-year institution at some point between 1992 and 1996. Adelman found that
rough-ly half of traditional-aged students will earn a bachelor’s degree from the same institution where
they originally enrolled in the traditional four-year period. This percentage goes up to 58 percent
when using six-years from point of entry, and it approaches 70 percent if using an eight-year
his-tory. Adelman (2006) pointed out that success at four-year institutions is greatly explained by the
high school preparation a student receives. He recommended that high schools “ratchet up the
Adelman found nine significant predictors for the time it takes students to graduate:
withdrawn and repeated for no credit course ratio, continuous enrollment, community college
transfer, four-year transfer, if the student was ever part-time, if the student needed remedial
edu-cation, the first-year GPA, whether the student changed majors, and the income level of the
stu-dent. The most important of these was the number of withdrawn and repeated for no credit
clas-ses that students took. As this number increased, so did the time it took the student to graduate.
In fact, Adelman (2006) was highly critical of institutional policies that do limit the number of
withdrawn classes a student can have before it affects GPA as well as the lack of policies that
limit the number of repeated attempts a student can have. He pointed out that some institutions
allow students to withdraw from courses as late as 10 weeks into a 15 week semester without
penalty, and that some institutions have a volume of withdrawals that amount to 15 percent of all
credits offered by the institution in a calendar year (p. 163). Adelman challenged future
research-ers by saying “here is a prime candidate for future research governed by quasi-experimental
de-sign: Find two comparable institutions (mission, size, demography, distribution of majors), one
with lax withdrawal rules, the other with restrictive rule. The hypothesis, from everything
learned in this data essay: An institution that restricts course withdrawal policy will witness
higher graduation rates and shorter average time to degree” (p. 163). While Adelman suggested
comparing two institutions, a researcher could also use a multilevel growth model to examine
this and other institutional factors on student success across 30 institutions.
One of the limitations of current research findings is that most studies only included data
from a single institution (Jones-White et al., 2010). The National Student Clearinghouse (NSC)
offers a promising way for colleges to track their students once they leave. Ninety-two percent of
The enrollment data represents 91 percent of all college students, while the degree verification
represents only 68 percent of all degrees conferred. The tracker service that NSC offers is free
for schools that regularly submit enrollment and degree information (Jones-White et al., 2010).
Researchers could use NSC data to track successful student outcomes for their students.
Most studies of student graduation and retention have used a binary logit method of
esti-mation. Jones-White et al. (2010) used the MNL (multinomial logit) model to simultaneously
estimate several binary outcomes: (a) earned baccalaureate degree from home institution, (b)
earned baccalaureate degree from another institution, and (c) earned associate degree or
certifi-cate from another institution. The researchers pointed out that while separate models could be
run for the three outcomes, using a multivariate simultaneous estimation procedure enforces
lo-gistical relationships among the predictor variables and utilizes the data more efficiently. Some
interesting findings were made as a result of this methodology. For example, students with
high-er SAT and ACT scores whigh-ere more likely to graduate with a bachelor’s degree than to graduate
with an associate’s degree or certificate. Also, students admitted to their first choice college were
more likely to stay at their home institution and graduate than to transfer or drop out. Regardless
of degree, female students were more successful than males, and minority student were less
like-ly to graduate. Students who lived on campus were more likelike-ly to graduate, and those students
from another state with a reciprocity agreement were more likely to transfer and graduate than
graduate from the starting institution. This plays into Vincent Tinto’s theory of student
integra-tion. Students who were Pell eligible were less successful in degree attainment than other
dents. Being Pell eligible raised the percentage of not graduating by 10 percent, and these
stu-dents were more likely to earn an associate’s degree than a bachelor’s. The limitations of these
universi-ty, which makes the results less generalizable to 2-year institutions. The authors also stated “a
final limitation stems from our focus on student outcomes, and not on the full path students take
to achieve those outcomes” (Jones-White et al., 2010, p. 170). The authors stated that “nearly all
the theory and resulting student retention literature has been built around a single institutional
perspective of success” and that “we know with a great deal of certainty what factors influence
student success from a single institution perspective” (Jones-White et al., 2010, p. 171.). The
au-thors argued that in order to understand the complexities of factors on student success, “an
ex-panded definition of graduation and an alternative set of methodological tools are needed” (p.
173).
Bailey et al. (2005) claimed that they “conducted, for the first time in the literature, an
analysis of institutional graduation rates at community colleges” (p. 15). Their data was made up
of IPEDS reported 3-year graduation rates. The researchers found that these rates were unstable
for about 20 percent of the schools examined using rates reported over six years. Smaller schools
were more likely to have unstable rates than were larger colleges. Using a grouped logistical
technique, their results indicated that colleges located in urban areas were 3.5 percent less likely
than a rural college to graduate a student. Larger schools with more than 2,500 full-time
equiva-lent (FTE) students were predicted to have between 9 and 14 percent lower graduation rates.
In-structional expenditures were also significantly related to higher graduation rates, but the effect
was a marginal 1.3 percent increase per $1,000 spent per full-time student. Their results also
showed that schools with a higher ratio of female to male students could expect lower
comple-tion rates. This contrasts previous research that has consistently shown that women are more
likely to graduate than men. They also found that colleges with a higher ratio of full-time
stu-dent data with IPEDS institutional data so that they could “control for both individual stustu-dent
and institutional characteristics simultaneously to tease out the particular effects of each” (Bailey
et al, 2005, p. 170). The researchers used the NELS:88 dataset which contained 2,438 students
whose first postsecondary education was in one of 686 community colleges. The sample was
limited to students who had data on all explanatory variables. This limited the study to 1,464
stu-dents in 441 community colleges. Interestingly, this resulted in a ratio of just 3.3 stustu-dents per
institution, which means that the findings in the analysis suffered from having only a few student
observations per school. Such a low number at the student level would not satisfy the
require-ments of a more robust multilevel approach. To make matters worse, 40 percent of the
communi-ty college students in the NELS:88 data set enrolled in more than one postsecondary institution.
To control for this, the researchers weighted the institutional effects per student based on the
number of earned credits. The study utilized a group logistical analysis where institutional level
data is analyzed at the same level as the student factors. This is how the researchers were able to
weight the institutional effects when students attended more than one school. The authors found
many of the same results as using IPEDS data alone. Students enrolled in institutions with 2,500
FTE or more were 20 percent less likely to graduate. Also, the proportion of students receiving
Pell grants has a significant negative factor on degree attainment. A larger proportion of minority
students was negatively associated with degree attainment for all students. Importantly, the
re-sults indicated that individual student characteristics had a greater bearing on student success
than did the institutional factors. The researchers blocked the 16 institutional variables into the
model after all the student factors were entered to test if the addition of the institutional factors
Model Specification
Some researchers have used event history modeling that measures time to a particular
event such as graduating. This type of analysis is more widely known as survival analysis, where
the time to event is measured. These models are appropriate when the outcome variable is
di-chotomous but there is a temporal process to reaching the outcome. In this case, graduating takes
a certain amount of earned credits, and credits are a better estimate of time to degree than is the
number of elapsed terms, which can vary widely, based on the enrollment patterns of students.
Such analysis can actually show how predictors of student success can change over time.
DesJardins et al. (2008) demonstrated that senior year test scores are initially a positive
predictor of graduating, but this effect wanes over time and actually reverses after five years.
GPA is a constant predictor over time. Being in a minority group was less deterministic of
grad-uating when GPA and financial aid were considered. What is interesting in a time series analysis
is that the predictors are allowed to change for student over time. The amount of financial aid a
student receives is not constant over time, nor is a student’s attempted credits, which can range
from full to part-time and perhaps include one or more stop-out periods. DesJardins et al. found
that event history models provide better model specification than logistical models that assume
time-constant effects.
One of the limitations of an event history model is competing events that may occur as a
result of students seeking different outcomes. While this type of modeling may provide more
in-sight into factors related to graduation, it still suffers from the fact that community college
stu-dents attend for multiple reasons. Modeling a single outcome on a population known to have
In a study of university students, Radcliffe et al. (2006) applied survival analysis to their
institution, and they were able to correctly identify 71.8 percent of students as either graduating
or not graduating based on student factors. However, the final predictive model was more
accu-rate at identifying students that graduated (87.5 percent) than those who did not graduate (46
percent). With the disparities that exist in student populations and the number of degree seeking
students between university and community college students, the application of survival analysis
in community colleges is likely to yield lower predictive power.
Marti (2007) has documented that there is substantial heterogeneity in postsecondary
pathways of community college students. His latent trajectory group analysis differs from
sur-vival analysis in important ways. Where sursur-vival analysis uses earned credits as the measure of
time, Marti’s application of latent trajectory analysis was interested in how many credits were
earned at fixed time points in order to identify distinct enrollment patterns. The two techniques
are aimed at answering completely different questions. For survival analysis, the question is
when do predictors correlate the highest to the outcome of interest: graduation. For latent
trajec-tory, the identification of underlying student groups allows the correlation of group membership
with predictors. Latent trajectory analysis should be followed up with a categorical data analysis
to see how predictors vary across groups.
Data Availability
There is insufficient national data on institutional policies that affect student success in
community colleges. Much of the research on student success is based on samples from single
institutions (Bailey & Alfonso, 2005). Some studies have utilized NELS data to create
student-centered analyses (Adelman, 2006; DesJardins et al., 2004), and other researchers have utilized
nature of multiple institutional community college data almost necessitates a state-wide or
na-tional effort to collect this data. This problem is compounded by the community colleges since
many do not keep or ever ask students for important admission data such as high school GPA,
parental educational levels, income level, and whether the student plans to work while attending.
These are open-access institutions whose admission requirements do not necessitate this type of
data collection.
Also, because community college students can take as long as 8 years to graduate,
gain-ing access to multiple years of transcript level data is difficult at a sgain-ingle institution and is
com-pounded when trying to collect this data for a large number of schools. Adelman’s study, which
utilized NELS:88 data set, contained high school and college transcripts plus demographic data
on students and their families. However, this data set is not representative of community college
students since the NELS:88 data followed students who were in 8th grade in 1988 through
col-lege. This means the population were traditionally aged students who would have graduated high
school in 1992.
The data report to IPEDS also has limitations in that it contains institutional aggregate
da-ta, not student level data. IPEDS is criticized for limiting its reported graduation rates to students
who are first-time in college and who graduate within three years of starting. The IPEDs
gradua-tion rates for community colleges is essentially limited to full-time students who do not stop out,
linger in picking a major, or have to repeat any classes, and who focus on a single educational
outcome: earning an associate’s degree.
Finally, Marti’s study of latent trajectory groups was limited to three years of student data
from Florida community colleges. All the institutions in the current study have data for seven
CHAPTER 3 METHODOLOGY Model Specification
FTE Model
The first of three models analyzed is called the full-time equivalent (FTE) model. It
ana-lyzes the number of attempted credits over the cumulative number of fall and spring semesters
attended by a student. This growth model essentially measures the enrollment intensity over
time allowing the introduction of student and institutional factors to account for enrollment
var-iation. The time variable, the cumulative number of semesters, was coded such that the first long
semester attended was zero, and each long semester thereafter incremented the time variable by
one. By coding the first semester zero, this becomes the time point used to interpret the model
intercept.
Completion Model
The second of three models is called the Completion model. It analyzes the ratio of
com-pleted credits over attempted credits with time measured by cumulative attempted credits.
Un-like previous studies which focus on more long-term outcomes such as graduation, this growth
model takes a more agnostic view of completion by looking at each student’s term completion
percentage. Regardless of what a student’s purpose in college, all students complete credits with
different efficiency rates. If a student attempted 12 credits and completed 9 of them, the
comple-tion outcome would be 75 percent. Also, if the number of attempted credits taken over three
terms was 12, 12, and 6, the time variable would be coded 12, 24, and 30 respectively. Coding
time with cumulative attempted credits normalizes the analysis regardless of the enrollment
in-tensity which is being analyzed in the FTE model. Here the growth model can detect student and
GPA Model
The final model analyzed in this study is called the GPA model. It analyzes the grade
point average (GPA) which is the weighted average of grade points multiplied by credits divided
by total GPA credits. Not every class attempted counts towards the GPA, so the time dimension
is similar to the Completion model but reduced to only include cumulative GPA credits.
Accord-ingly, the data set used in this analysis was reduced from the previous two models by simply
re-moving semester waves where no GPA information was present. Rere-moving waves with no GPA
information was necessary to ensure that the outcome variable was based on the performance in
at least one class. This model is very similar in structure to the completion model, but it
measures student ability with more detail than the rate at which students complete classes.
Participants
This study utilized transcript level data from 28 community colleges across 6 states.
Indi-viduals were restricted to students who started their academic career between Fall 2007 and Fall
2011 and who were at least 18 years of age in their respective first term enrolled. Transcript and
financial aid data from 2007 to 2014 were randomized by each school using the ZogoTech
Ana-lytics software. Proper consent was obtained from each institution’s data steward or Institutional
Review Board (IRB) office. In exchange for the use of data, institutions were promised
anonymi-ty and that the study results would be shared with them.
Two data sets were constructed from the obtained randomized data in order to conduct
the three separate statistical models: FTE, Completion, and GPA models. Table 1 provides a
summary of how the two data sets were constructed. Both data sets contained over 400,000
Table 1: Number of students and time points for FTE, Completion, and GPA data sets
Students Waves (se-mesters)
Initial data load 445,559 1,296,686
Removal of students with greater than 24 credits in a term -1,038 -3,645
Removal of waves past the 4th year -- -20,500
Removal of students missing gender -964 -1,451
Data set 1 (used for FTE and Completion models) 443,557 1,271,090 Removal of data with no GPA information -25,916 -88,316
Data set 2 (used for GPA model) 417,641 1,182,774
Students who took more than 24 credits in any single term were removed as outliers
based on data quality concerns. All institutions in the study set full-time enrollment at 12
at-tempted credits. Twice the number of full-time credits was chosen as an upper limit in order to
make the number of attempted credits equatable across semesters attended. This upper limit
re-moved a very small percentage of the total students and waves of data, 0.2% and 0.3%
respec-tively.
Time waves (semesters) were coded based on each student’s first term attended,
increas-ing by one for each subsequent term attended. Waves were restricted to fall and sprincreas-ing terms so
that attempted credits in each wave were equatable, which is one of the measurement conditions
of an HLM growth model analysis (Singer & Willett, 2003). Therefore, all students in the study
have at least one wave of data, and all students appear in the first wave.
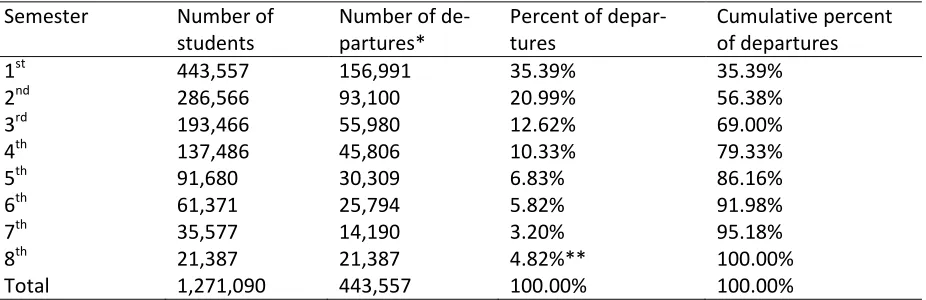
One term and done students represented 35.39% of the total number of students. These
students were not removed from the study since one of the main advantages of HLM growth
modeling is its ability to accommodate unbalanced data. Table 2 shows the departure term for
each student, the last wave observed per student. Due to the way time was coded, the number of
departures decreases after each wave except for the last wave. Waves 9 through 14 were
was only 2.46%, and the pattern of attempted credits varied considerably by this group. By
trun-cating these waves, the number of reported departures increases slightly in the 8th semester over
those departing in the 7th semester. The actual number departing after the 8th semester was
2.36%.
Students missing gender were removed along with their waves of data. This resulted in a
very small reduction of the total numbers of students and waves, 0.2% and 0.1% respectively.
Due to these low percentages, reporting those with unknown gender would not have been
[image:41.612.70.533.311.461.2]mean-ingful.
Table 2: Number of students by semesters attended Semester Number of
students
Number of de-partures*
Percent of depar-tures
Cumulative percent of departures
1st 443,557 156,991 35.39% 35.39%
2nd 286,566 93,100 20.99% 56.38%
3rd 193,466 55,980 12.62% 69.00%
4th 137,486 45,806 10.33% 79.33%
5th 91,680 30,309 6.83% 86.16%
6th 61,371 25,794 5.82% 91.98%
7th 35,577 14,190 3.20% 95.18%
8th 21,387 21,387 4.82%** 100.00%
Total 1,271,090 443,557 100.00% 100.00%
*Departures refer to the last semester attended whether the student received a degree or not.
** This number does not decrease due to using the 8th semester as the study cut off. 2.46% of students departed after 9 to 14 semesters.
Selection Procedures
The community colleges solicited in the study were all customers of ZogoTech LLC and
had implemented the ZogoTech Analytics data warehouse. This software provides a common
schema by coding institutional specific logic into the interpretation of transcript level data. That
means the use of attempted credits, completed credits, and GPA as outcomes have a reliable
in-terpretation across the 28 colleges in this study. Without a common schema, three-level
More-over, community colleges use a variety of student information systems that require specialized
software and expertise to extract transcript data. This is likely the reason why multi-institutional
transcript-level studies are so rare.
Individual students included in the study were limited to those who first attended between
Fall 2007 and Fall 2011. Fall 2007 was the first term for which all 28 participating colleges had
transcript data loaded into their data warehouse, and Fall 2011 was the last term that allowed at
least 6 waves of data to be observed for all students. Transcript and financial aid data were
ana-lyzed through Spring 2014. Given these restrictions, Table 3 provides the number of level 2 units
(individuals) per level 3 units (institutions) which ranged from 5,116 to 35,720 or 1.15% to
8.05% of total individuals respectively. The average length of attendance (number of waves per
level 2 individual) ranged from 1.87 to 3.2 semesters across institutions. The number and
Table 3: Number of students by institution Institution Number
of stu-dents Number of students with GPA Average length of attendance (semesters) Percent of study partic-ipants Percent of study partici-pants with GPA
1 5,116 4,875 2.472 1.15% 1.17%
2 32,065 31,145 3.202 7.23% 7.46%
3 7,378 7,090 2.854 1.66% 1.70%
4 9,755 9,363 2.667 2.20% 2.24%
5 12,054 11,327 2.640 2.72% 2.71%
6 23,417 21,780 2.921 5.28% 5.22%
7 11,497 10,719 2.616 2.59% 2.57%
8 18,546 17,075 2.837 4.18% 4.09%
9 26,475 24,961 3.012 5.97% 5.98%
10 17,529 16,590 3.043 3.95% 3.97%
11 22,815 21,341 3.001 5.14% 5.11%
12 35,720 33,916 3.200 8.05% 8.12%
13 12,323 11,855 3.034 2.78% 2.84%
14 11,595 11,261 2.595 2.61% 2.70%
15 11,548 11,120 2.576 2.60% 2.66%
16 17,862 13,581 2.656 4.03% 3.25%
17 17,924 16,338 3.171 4.04% 3.91%
18 17,192 16,582 2.438 3.88% 3.97%
19 26,671 25,198 2.665 6.01% 6.03%
20 6,742 6,497 3.064 1.52% 1.56%
21 6,951 6,399 3.018 1.57% 1.53%
22 11,229 10,888 2.852 2.53% 2.61%
23 14,566 14,259 2.744 3.28% 3.41%
24 23,095 21,940 3.130 5.21% 5.25%
25 6,585 6,196 1.872 1.48% 1.48%
26 12,604 12,170 3.012 2.84% 2.91%
27 14,652 14,051 2.810 3.30% 3.36%
28 9,651 9,124 1.876 2.18% 2.18%
Total 443,557 417,641 2.866 100% 100%
Measures
Most of the measures used in this study were computed from transcript level data. Some
measures, however, were obtained from the city-data web site, the Integrated Post-Secondary
Education Data System (IPEDS) web site, academic catalogs, or direct correspondence with the
schools. All measures and how they were computed are described in the code book in Appendix
Institutional Factors
Several factors were calculated from transcript data. The size of the institution was
cal-culated based on the average number of students enrolled in a term between 2007 and 2011.
Size, however, does not take into account the variable number of hours students attempt, so the
full-time enrollment (FTE) was also calculated by averaging the number of attempted credits in
terms between 2007 and 2011 and dividing by 12. The percent receiving Pell grant awards was
calculated by the number of students who ever received a Pell award and dividing by the total
number of students in the study. In a similar fashion the percent of male students, percent of
white students, percent of full-time students, percent of remedial students, and the percent of
withdrawals were calculated.
Many of the institutional factors came from the Integrated Post-Secondary Education
Da-ta System (IPEDS). These included the percent of budget spent on academic support, the percent
of budget spent on student services, the percent of online students, and the percent of full-time
faculty. IPEDS also provided a way to determine if a college was located near an urban center.
The urbanization categories of town-distant, town-remote, and rural-distant provided the means
to calculate a binary factor of whether the school was isolated.
Some factors were obtained from course catalogs or direct correspondence with the
insti-tution. The factors included the reporting of midterm grades to students, whether orientation was
provided to new students, whether students are required to complete a degree plan with an
advi-sor, whether advisement is required before or during registration, whether attendance is tracked
systematically by the institution, and finally whether the last grade or best grade is used when a
student repeats a class. The reporting of midterm grades was determined by whether students
Student Factors
All the student factors were calculated from transcript, financial aid, and demographic
tables from the ZogoTech Analytics data warehouse. Demographic factors included whether the
student was male, white, whether the student was traditionally aged (18-24). One financial aid
factor was calculated to determine if the student was ever a Pell recipient. Many transcript
fac-tors were calculated at the student level such as the total attempted credits across all term
attend-ed, the total number of repeated credits, the total withdrawn credits, whether or not the student
attended for one term, the total number of terms the student attended, whether the student was an
incidental student earning 10 or less credits, whether the student was continuously enrolled for
two years, whether the student was continuously enrolled full-time for two years, was ever
en-rolled full-time, was ever enen-rolled part-time, was ever enen-rolled less than part-time (less than 6
hours), whether the student enrolled immediately after high-school (within 8 months of
graduat-ing), whether the student ever took a remedial class, and whether the student ever failed a
reme-dial class.
Time-varying Factors
Because this is a three level growth model analyzing student outcomes in waves
(semes-ters), term level factors were also computed. These include whether the student took a remedial
class, failed a remedial class in the term, attended full-time, part-time, or less than part-time, and
finally whether the student received Pell grant funds in the term.
Data Analysis Strategy
Analysis in this study were carried out with the nlme library (Pinheiro & Bates, 2000)
under R, version 3.1.1. This library allows hierarchical analysis of data similar to other software
mixed effect modeling using full maximum likelihood estimation. Because this library runs
in-side R there are some distinct advantages. The first is that it is free, which means the results of
this study can be reproduced by a much wider audience. Also, R has the ability to visualize
mul-tilevel data through various plotting functions. It can provide tests of normality assumptions as
well as provide histogram charts to visually inspect the normality of data. In addition, the nlme
package provides the ability to test for fit and improvement of competing models. Nlme also
provides a table of intercepts and slopes at all levels to allow graphing and inspection of the
pa-rameter estimates. Most importantly, R can handle very large data sets such as the one in this
study.
Multilevel growth modeling has many advantages for longitudinal data analysis. First, it
allows for individual growth modeling by nesting time-varying growth effects within individual
characteristics. Second, it allows time points to vary across cases, which is ideal for community
college students who attend at different rates and can have multiple stop-out periods. Third, there
is no need to do anything special when the data are unbalanced, meaning that there are varying
number of measurement points across individuals (Singer & Willet, 2003; Bryk & Raudenbush,
2002). Finally, multilevel modeling using nlme supports three levels of analysis which enables
contextual variation to be modeled directly. In this study a 3-level growth model will be
speci-fied so at level 1 multiple observations of individual student change (time waves) are modeled as
an individual growth trajectory nested with students (individuals) nested with institutions
(con-textual factors).
In growth modeling the temporal variable can only change monotonically. In other
words, it cannot change direction. Also there are three requirements of the outcome variable.
2003). For the metric to be preserved the scores must be equatable over time. A given value of
the outcome on a measurement occasion must represent the same amount of the outcome on
oth-er occasions. The second requirement is that measurements are equally valid at evoth-ery
measure-ment occasion. This means that the instrumeasure-ment used to measure your outcome is appropriate at
differing points in time. The third requirement is that the measurements over time preserve
preci-sion. The time and outcomes variables in this study met these metric conditions.
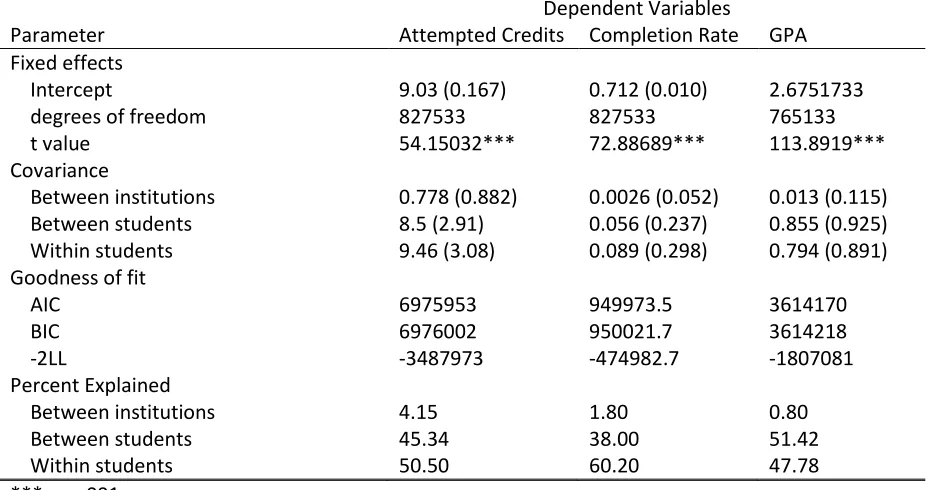
In this study, three different growth models were estimated. Using steps outline by
Bliese (2013) a six step analysis was performed. First, an unconditional means model (UMM)
was constructed for each of the three outcomes. This served to calculate the Intraclass
Correla-tion Coefficient (ICC) of the student and instituCorrela-tional levels, and the UMM served as the baseline
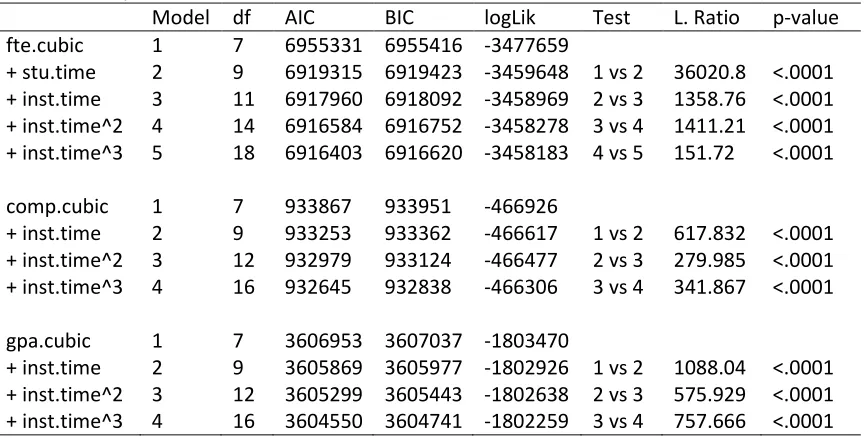
to evaluate subsequent models. Second, time was modeled beginning with a linear relationship
and progressively adding more complicated relationships such as quadratic, and cubic. Each of
these models was compared using a -2 log likelihood ratio test. Third, slope variability was
test-ed at the student and institutional levels to see if allowing the time coefficients to vary improvtest-ed
model fit. Fourth, error structures were examined to see if model fit is improved by correcting for
autocorrelation, which is often the case in repeated measures analysis (Bliese, 2013). Fifth,
pre-dictors of the intercept were entered into the models to see what factors could potentially explain
intercept variation. Finally predictors of slope and higher order time coefficients were entered