Hydrol. Earth Syst. Sci., 17, 751–760, 2013 www.hydrol-earth-syst-sci.net/17/751/2013/ doi:10.5194/hess-17-751-2013
© Author(s) 2013. CC Attribution 3.0 License.
EGU Journal Logos (RGB)
Advances in
Geosciences
Open Access
Natural Hazards
and Earth System
Sciences
Open Access
Annales
Geophysicae
Open Access
Nonlinear Processes
in Geophysics
Open Access
Atmospheric
Chemistry
and Physics
Open Access
Atmospheric
Chemistry
and Physics
Open Access
Discussions
Atmospheric
Measurement
Techniques
Open Access
Atmospheric
Measurement
Techniques
Open Access
Discussions
Biogeosciences
Open Access Open Access
Biogeosciences
DiscussionsClimate
of the Past
Open Access Open Access
Climate
of the Past
Discussions
Earth System
Dynamics
Open Access Open Access
Earth System
Dynamics
Discussions
Geoscientific
Instrumentation
Methods and
Data Systems
Open Access
Geoscientific
Instrumentation
Methods and
Data Systems
Open Access
Discussions
Geoscientific
Model Development
Open Access Open Access
Geoscientific
Model Development
Discussions
Hydrology and
Earth System
Sciences
Open Access
Hydrology and
Earth System
Sciences
Open Access
Discussions
Ocean Science
Open Access Open Access
Ocean Science
Discussions
Solid Earth
Open Access Open Access
Solid Earth
Discussions
The Cryosphere
Open Access Open Access
The Cryosphere
DiscussionsNatural Hazards
and Earth System
Sciences
Open Access
Discussions
Environmental flow assessments in estuaries
based on an integrated multi-objective method
T. Sun, J. Xu, and Z. F. Yang
State Key Laboratory of Water Environment Simulation, School of Environment, Beijing Normal University, Beijing 100875, China
Correspondence to: T. Sun ([email protected])
Received: 19 April 2012 – Published in Hydrol. Earth Syst. Sci. Discuss.: 31 May 2012 Revised: 28 December 2012 – Accepted: 17 January 2013 – Published: 20 February 2013
Abstract. An integrated multi-objective method for
environ-mental flow assessments was developed that considered vari-ability of potential habitats as a critical factor in determin-ing how ecosystems respond to hydrological alterations. Re-sponses of habitat area, and the magnitude of those reRe-sponses as influenced by salinity and water depth, were established and assessed according to fluctuations in river discharge and tidal currents. The requirements of typical migratory species during pivotal life-stage seasons (e.g., reproduction and juve-nile growth) and natural flow variations were integrated into the flow-needs assessment. Critical environmental flows for a typical species were defined based on two primary objec-tives: (1) high level of habitat area and (2) low variability of habitat area. After integrating the water requirements for var-ious species with the maximum acceptable discharge bound-ary, appropriate temporal limits of environmental flows for ecosystems were recommended. The method was applied in the Yellow River estuary in eastern Shandong province, China. Our results show that, while recommended environ-mental flows established with variability of potential habitats in mind may not necessarily benefit short-term survival of a typical resident organism on a limited temporal or spatial scale, they may encourage long-term, stable biodiversity and ecosystem health. Thus, short-term ecosystem losses may be compensated by significant long-term gains.
1 Introduction
The intense regulation of water resources, including major hydraulic engineering projects, has significantly altered the natural flow of rivers worldwide (D¨oll et al., 2009). The
re-sulting impacts to environmental gradients and species dis-tribution, as well as the quality and quantity of many ecosys-tem habitats, have been further aggravated by global climate change (Pyron and Neumann, 2008; Arthington et al., 2010). One of the major challenges for sustainable water resource management and ecosystem protection is the accurate as-sessment of both available water and the volume that can be withdrawn from an aquatic ecosystem before its ability to meet social, ecological and economic needs significantly declines (Richter et al., 1997; Sun et al., 2008; McCartney et al., 2009). Environmental flows, also known as instream flows, describe the quantity, quality and timing of water flows required to sustain freshwater and estuarine ecosystems and the human populations that depend on them (The Brisbane Declaration, 2007). Environmental flow assessments have become an important tool for ecosystem restoration, water resource management and reservoir management (Arthing-ton et al., 2006; Vogel et al., 2007; Poff et al., 2009; Yang, 2011; Archer et al., 2010).
historic monthly inflow and fish catch were utilized in the TxEMP model to arrive at an optimized inflow/harvest re-lationship (Powell et al., 2002). In contrast with the direct linkages between flow and species and community responses observed in experimental research, habitat simulation models often incorporate preferred, optimal habitat for target species as an intermediate step in addressing environmental flow re-quirements (Townsend and Padovan, 2009; Sun et al., 2009; Shafroth et al., 2010). Considering thresholds of salinity ap-propriate for different species, environmental flows were de-fined based on simulated relationships between freshwater inflows and the salinity in fixed locations for different habi-tats of various species (Sun et al., 2012).
It should be pointed out that alteration of hydrological con-ditions can have either direct effects on habitat concon-ditions and structure, or indirect effects on biological distributions and larger-scale impacts to ecosystems. Species vary in their ability to tolerate or adapt to habitat change, regardless of whether that change occurs due to natural or anthropogenic forces. Some species, for example, may be able to adapt their habitat site selection in response to changes in hydrologi-cal processes without significant effects on the population (Koehn et al., 2011). According to Buzan et al. (2009), floods may have short-term negative consequences for oyster har-vesting but play a vital role in ensuring the long-term health of oyster populations. Cissoko et al. (2008) found that a re-covery of production rates of freshwater bacteria and viruses will be followed by a sharp decline immediately after seawa-ter addition. The impacts of hydrological alseawa-terations on any particular species will vary according to the vulnerability of that species and associated habitats (van de Pol et al., 2010). It is important to understand how key abiotic parameters within an ecosystem vary spatially and temporally across the full range of actual or projected hydrological change (Petts, 2009). Inclusion of these data is generally recognized as a key component of an ecological evaluation that must be ad-dressed in environmental flow assessments.
In this study, variability of potential habitats was analyzed as part of an environmental flow assessment using a proposed integrated multi-objective method. Thresholds of various en-vironmental factors for typical species were used to define a potential habitat area over a given period time. Also, a bound-ary of environmental flows was recommended to maintain a high level of habitat area and low variability of habitat area for typical species. The method was applied in the Yellow River estuary, for which water resource management strate-gies were proposed.
2 Methodology
Because species vary in their water requirements and toler-ance due to different and often conflicting life history strate-gies, we proposed an integrated multi-objective method to assess the impacts of changing environmental flows,
utiliz-ing a two-step process where environmental flow data were integrated for (1) one typical species and (2) a wider variety of representative taxa.
2.1 Consideration of a typical representative species
Our one a priori hypothesis for this evaluation was that was that species migrating into an area that is being affected by altered water flows may adapt their operable habitat to meet environmental changes but still encompass the ideal environ-mental factors for that species. The habitat can be accepted by the species only when every key factor falls within the acceptability limits.
As a key ecological factor, habitat area can be considered as an integrated index that represents the intertwined require-ments of a variety of environmental factors. When three or more environmental factors are included in the study, the habitat area can be determined as
A= {A1=f1(S1)∩ · · · ∩Ai=fi(Si)∩ · · · ∩An=fn(Sn)},(1)
whereAis the required habitat area given various environ-mental factors, Si is the distribution of the environmental
factor numberi,An is the habitat area under the indexSn,
andfi(S)is the relationship between the distribution of
en-vironmental factors and habitat area.
A suitable habitat area for a species can be defined as the area of certain physical and conditional dimensions where each environmental factor is suitable for the species. For any particular species, the key environmental factors are repre-sented by a range demarcated by minimum and maximum boundaries. An excursion of the particular factor above (ex-cess) or below (deficiency) those boundaries in either a quan-titative or qualitative fashion may result in significant popu-lation decline or even extirpation from a given geographic area. For highly specialized, localized populations, demon-strable deviations could lead to species extinction. As shown in Eq. (1), habitat area and variability associated with species survival can be defined to simultaneously meet the require-ments posed by different ecological factors.
The occurrence of suitable habitat is driven by the distri-bution of favorable environmental factors, which vary with changes in river flow and tidal current. Suitable habitat area may change at different scales. In our current research, habi-tat area is defined as the average result of suitable area in a tidal cycle. The degree or amplitude of habitat variability was calculated by the differences between the maximum and the minimum habitat area that were observed in one tidal cycle. Since populations and communities tend to be healthier un-der stable conditions, it is reasonable to assume that greater habitat area and dampened variability of the key habitat pa-rameter (e.g., water availability) would yield a more ideal environment for improved fecundity and growth of any given species. In the current study, critical environmental flows for a typical species were defined through the application of two
primary objectives: (1) greater habitat area and (2) low vari-ability of habitat area.
The relationship between environmental factor distribu-tions and flow regime was established using a numerical model that simulates the spatial and temporal distributions of selected environmental factors as a combined function of the river discharge and tidal currents. The depth-integrated equations for conservation of motion and water are
∂ζ ∂t +
∂
∂x(H u)+ ∂
∂y(H v)=0, (2)
∂u ∂t +
∂uu
∂x +
∂vu
∂y =f v+g ∂ζ ∂x+g
u
√
u2+v2
H C2
+ ∂
∂x
ε∂u ∂x
+ ∂
∂y
ε∂u ∂y
, (3)
and
∂u ∂t +
∂uv
∂x +
∂vv
∂y =f u+g ∂ζ ∂y +g
v
√
u2+v2
H C2
+ ∂
∂x
ε∂v ∂x
+ ∂
∂y
ε∂v ∂y
, (4)
wheret(s) is time,uandvare current velocities (m s−1) in thex andy directions, respectively,f is the Coriolis factor,
C is the Ch´ezy coefficient (m1/2s−1),H is the total depth (m) of the water from the water surface to the bottom (H=
ζ+d, wheredis the local depth (m) of water measured from mean water level to the bottom andζ is the water surface elevation (m) measured upwards from the mean water level),
gis gravitational acceleration (m s−2)andεis a dispersion
coefficient (m2s−1).
The two-dimensional convection–diffusion equation inte-grated over water depth, which assumes vertical mixing, is written as
∂ (H S)
∂t +
∂ (H uS)
∂x +
∂ (H vS)
∂y =
∂ ∂x
KxxH
∂S ∂x
+ ∂
∂x
KxyH
∂S ∂y
+ ∂
∂y
KyxH
∂S ∂x
+ ∂
∂y
KyyH
∂S ∂y
+Sm, (5)
where S is the concentration of dissolved solutes (unit/volume), Sm is a source term that describes the
sources and sinks of the solutes andKis the depth-averaged dispersion–diffusion coefficient (m2s−1) for orientations x
andy.
Potential habitats are determined by distribution of critical environmental factors. In the calculation, habitat area can be determined by distributions of selected environmental factors at every time step. The habitat area of one species is defined as the average of suitable area during a tidal cycle, calcu-lated as the smallest intersection of different environmental factor-derived areas as described by Eq. (1). The amplitude of habitat variability was calculated by the differences be-tween the maximum and the minimum habitat area during
one tidal cycle. The spatial extent of a habitat (total area as well as geographic orientation) may also change with hydro-logical processes. Consequently, species may adapt to chang-ing ecological conditions by shiftchang-ing their usable habitat.
2.2 Consideration of multiple species
Variations in the temporal and spatial distribution patterns of different species will cause incremental overlap resulting in nearly identical, to highly disparate, water requirements. Consequently, what is suitable, or even preferential, for one species is likely to be unacceptable for one or more other species. At the same time, biodiversity within an ecosys-tem generally corresponds to variations in river discharge, suggesting that fluctuations in river discharge may actually enhance and maintain ecosystem biodiversity (Huisman and Weissing, 1999). When considering ecosystem biodiversity health on a holistic basis, therefore, the recommended envi-ronmental flow for any given ecosystem is that which falls within the upper and lower tolerance thresholds, obtained by integrating the minimum and maximum water requirements of the keystone species:
Emin=Min(W1,min,· · ·, Wj,min,· · ·, Wn,min) (6)
and
Emax=Max(W1,max,· · ·, Wj,max,· · ·, Wn,max)
, (7)
whereEmin andEmaxare the minimum and maximum
en-vironmental flows, respectively, allowing for maintenance of an aquatic ecosystem,Wj,minandWj,maxare the minimum
and maximum environmental flows, respectively, for habitat
j,n is the number of species considered in the study, and Min (a,b)and Max (a,b)are the minimum and maximum values, respectively, betweenaandb.
2.3 Temporal variability in environmental flows
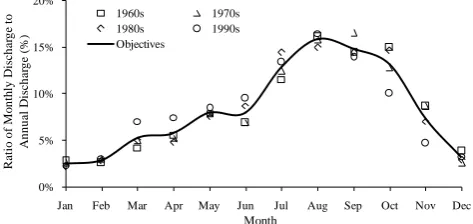
Given the temporal variations that are characteristic of hy-drological and biological processes, it is expected that en-vironmental flows would also exhibit temporal variability at various scales. Despite these variations, however, the quan-tification of appropriate environmental flows that correspond to every specific objective remains challenging, particularly given the different spatial and temporal scales at which those processes are manifested. Considering the close relationships between hydrological and biological processes in ecosys-tems, temporal changes in natural river discharge was se-lected as an indicator of the temporal variation objectives of environmental flows. Temporal variations of environmental flows are expressed as the ratio of the monthly or daily river discharge to the annual discharge, as shown in Eq. (8).
Ri = n X j=1
Wj i , n
X j=1
1
119.05 119.1 119.15 119.2 119.25 119.3 119.35 119.4 119.45 119.5 37.7
37.75 37.8 37.85 37.9 37.95 38
Longitude
L
a
tit
u
d
e
Fig. 1. Location of the Yellow River estuary.
whereRi is the ratio (%) of the monthly (or daily) river
dis-charge in monthi(or dayi)to the annual discharge,Wj is
the annual river discharge (m3)in yearj, andWj iis the river
discharge (m3)in monthi(or dayi)of yearj.
After integrating the objectives for ecosystem protection for a particular time of the year or season that is crucial to reproduction, survival and/or growth of a target species, with temporal variation objectives of the natural flow regime, en-vironmental flows can be defined to satisfy the desired eco-logical objectives in the critical season. This process can also quantify the environmental flows to meet the objectives for other seasons that may have been excluded in the initial envi-ronmental flow assessments. The annual envienvi-ronmental flows can also be determined using the water requirements of the critical seasons, and the monthly or daily variations in envi-ronmental flows, as defined in Eq. (8).
3 Study area
The Yellow River estuary is located in eastern Shandong province, west of the Bohai Sea (Fig. 1). With abundant freshwater and nutrient inputs, the Yellow River estuary pro-vides critical habitats for many ecologically and commer-cially important species (Dong et al., 2007).
Freshwater inflows in the Yellow River estuary have de-creased for several decades. The frequency of complete dry-ing or ephemeral flow has been risdry-ing consistently since the early 1970s. In the early 1990s, the estuary experienced com-plete drying each year, with an average of 100 d yr−1 with-out water in the lower reaches as a result of both reduced rainfall and excess withdrawals of water to support agricul-ture and industry. Reduction in freshwater inflows to estuar-ies causes a concurrent decrease in available aquatic habitat, which, in turn, has negative consequences for many aquatic species (Attrill et al., 1996). In the Yellow River estuary and the Bohai Sea, species number, density, and biomass dropped by 38.7 %, 35.5 %, and 46.0 %, respectively, from 1982/1983 to 1992/1993 (Zhu and Tang, 2002; Fan and Huang, 2008).
Estuarine species tend to be euryhaline, although the abil-ity to tolerate a wide range of salinities may not be equal in all life stages. Egg laying and maturation, as well as ju-venile growth may need to occur in an environment that
re-1
0%
5% 10% 15% 20%
Jan Feb Mar Apr May Jun Jul Aug Sep Oct Nov Dec 1960s 1970s
1980s 1990s Objectives
Month
R
a
ti
o of
M
o
nt
h
ly
D
is
c
ha
rge
t
o
A
nnua
l D
is
c
ha
rge
(
%
[image:4.595.309.546.66.178.2])
Fig. 2. Temporal variation objectives for environmental flows in the Yellow River estuary. Each point represents the average flow during the indicated decade.
mains within a narrower salinity range. Maintaining a rea-sonable salinity balance is an essential environmental flow requirement for the Yellow River estuary. Since recruitment strength, and therefore the future population, is mainly driven by the success of spawning events and the survival of young, understanding how the flow regime influences the early life history of species is critical to maintaining ecosystem health. Habitats that are utilized during the breeding and growth pe-riods for typical species are usually located at shallow estuar-ine depths. Various studies have indicated that the acceptable depth and salinity requirements for these life stages vary by species (Table 1).
In the case study of the Yellow River estuary, salinity and water depth were selected as the critical environmental fac-tors for habitat maintenance of typical species. The finite-difference method was used to solve the partial differential equations. Four species were selected as keystone organ-isms for the evaluation of essential environmental flows on a wider, multi-species scale: Chinese shrimp (Penaeus
chinen-sis [larvae]), ridgetail prawn (Exopalaemon. carinicauda),
Chinese mitten crab (Eriocheir sinensis Milne-Edwards) and jellyfish (Rhopilema esculenta Kishinouye). These inverte-brate species are functionally and economically different, but all depend on the estuary for completion of key life history events, including spawning and early life stage development. The temporal variation in objectives is expressed as the ratio of the monthly or daily river discharge to the annual discharge. Figure 2 shows the ratio of the monthly river dis-charge to the annual total disdis-charge in the 1960s, 1970s, 1980s, and 1990s at the Lijin Station, which is the last hy-drologic station before the estuary in the Yellow River basin. The average ratio of the temporal distribution of natural river discharge was considered to be representative of the temporal variations in environmental flows.
4 Results
Changes in habitat area were driven by the combined influ-ence of river flows and tidal currents. The numerical model
Table 1. Habitat requirements for four key indicator species in the Yellow River estuary.
Indicator Species Salinity Water depth (m) Critical periods References Minimum Maximum Minimum Maximum
Chinese shrimp 8.77 29 1 6 June–July Hu and Lu (1990);
Zhang et al. (1998); Deng et al. (1990)
Ridgetail prawn 9 28 1.5 10 October Wang and Cao (2010)
Chinese mitten crab 6 27 7 15 October Xue et al. (1997)
Jellyfish 8 30 5 15 April–May Song et al. (2009);
Zhao et al. (2006); Lu et al. (1989)
0 20 40 60 80 100 120
0 500 1000 1500 2000 2500 3000 3500 4000
H
a
bi
ta
t
a
re
a
(
km
2)
River discharges (m3/s)
[image:5.595.49.302.88.387.2]Chinese Shrimp Ridgetail Prawn Jellyfish Chinese Mitten Crab
Fig. 3. Relationship between river discharge and habitat area for typical species.
for salinity and water depth distributions with changes in river discharge and tidal current was validated with the hy-drographic data from different monitoring stations in the Es-tuary (Sun et al., 2012). On the basis of the validated nu-merical model, the relationships between freshwater inflow and habitat area for different species were established in the Yellow River estuary. A comparison of average habitat area that occurs during a tidal cycle under various river dis-charge scenarios (from 100 m3s−1 to 4000 m3s−1) yields substantially different results depending on the volume of discharge (Fig. 3). There are no stable relationships between river discharge and average habitat area when river discharge is less than 500 m3s−1. When river discharge rises to about 1000 m3s−1, the maximum habitat area occurring over a
tidal cycle can be derived for several different species, in-cluding those considered in this study. Habitat area remained relatively stable when river discharge exceeded 1000 m3s−1, but tended to decrease above 2500 m3s−1.
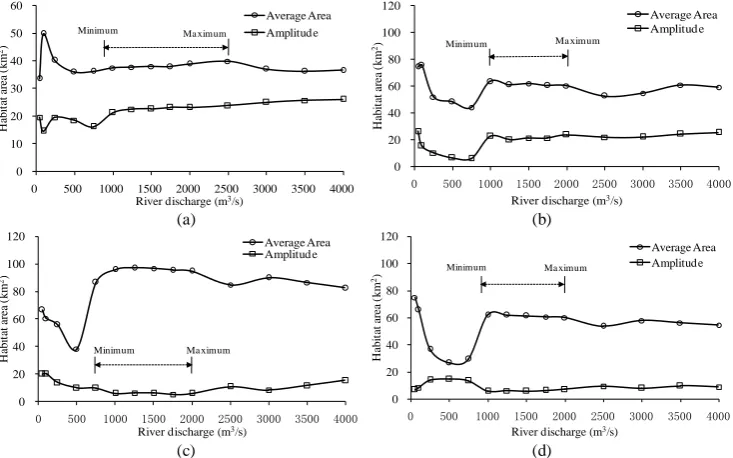
The variability of average habitat area, and the amplitude of that habitat variability, that occurs over one tidal cycle un-der different river discharge scenarios is illustrated in Fig. 4. For Chinese shrimp, there was a trend of increasing ampli-tude in habitat variability with increasing river discharge.
Therefore, given the goal of maintaining high habitat area, suitable river discharge for the Chinese shrimp is between 750 m3s−1and 2500 m3s−1. Available habitat area is likely
to decrease when discharge exceeds 2500 m3s−1, where the energy of the discharge is sufficiently high to exacerbate ero-sion, negatively impact salinity, and result in water depths that are not conducive to shrimp survival and reproduction. Similarly for the Chinese mitten crab, our results suggest that greater habitat area with low variability occurs when river discharge fluctuates between 750 m3s−1and 2000 m3s−1.
The range of preferable environmental flows for the Chi-nese shrimp are the widest of any of the species studied, both in terms of discharge during critical seasons and annual vol-ume in the Yellow River estuary (Table 2). Based on the tem-poral changes in environmental flow variation objectives that occur over the course of a year (shown in Fig. 2) and river dis-charge requirements in critical seasons, the acceptable annual environmental flows, which vary with species, can be deter-mined. These data were used to develop the integrated model of minimum and maximum flows, which are illustrated in Fig. 5. The delta between the upper and lower lines repre-sents the range which is allowable in any particular month. Differences in flow requirements are driven primarily by the different ecological needs of each species at various stages in their life history.
When all of the studied species are considered, 25 % and 112 % of the average annual river discharge were defined as the environmental flow boundaries. These values were equal to the minimum requirement of the Chinese mitten crab, which yielded the lowest minimum annual flow require-ment, and the maximum requirement of the jellyfish, which yielded the highest annual maximum flow requirement, as shown in Table 2. These two species represent, therefore, the flow requirement “extremes”. Establishing these quantita-tive boundaries is critical to the environmental flows assess-ment process, as they provide for the integration of different ecosystem objectives and goals, by which management suc-cess can be measured. By meeting these goals, biodiversity is encouraged and maintained within the ecosystem.
1
(a) (b)
(c) (d) 0
10 20 30 40 50 60
0 500 1000 1500 2000 2500 3000 3500 4000
H
abi
ta
t
ar
ea
(
km
2)
River discharge (m3/s)
Average Area Amplitud e
Minimum Ma ximum
0 20 40 60 80 100 120
0 500 1000 1500 2000 2500 3000 3500 4000
H
abi
ta
t
ar
ea
(
km
2)
River discharge (m3/s)
Average Area Amplitud e
Minimum Ma ximum
0 20 40 60 80 100 120
0 500 1000 1500 2000 2500 3000 3500 4000
H
abi
ta
t
ar
ea
(
km
2)
River discharge (m3/s)
Average Area Amplitud e
Minimum Ma ximum
0 20 40 60 80 100 120
0 500 1000 1500 2000 2500 3000 3500 4000
H
abi
ta
t
ar
ea
(
km
2)
River discharge (m3/s)
Average Area Amplitud e
[image:6.595.115.482.64.293.2]Minimum Ma ximum
[image:6.595.158.437.362.457.2]Fig. 4. Changes in habitat area with changes in freshwater inflows. (a) Chinese shrimp; (b) ridgetail prawn; (c) Chinese mitten crab; (d) jel-lyfish.
Table 2. Environmental flows in the Yellow River estuary.
Environmental flows in Annual environmental
Indicator organism critical seasons (m
3s−1) flows (109m3)
Minimum Maximum Minimum Maximum
Chinese shrimp 750 2500 18.5 61.6
Ridgetail prawn 1000 2000 19.7 39.4
Chinese mitten crab 750 2000 14.8 39.4
Jellyfish 1000 2000 32.4 64.8
Note: critical seasons include those when reproductive and key juvenile growth periods occur.
1 0
1000 2000 3000 4000 5000
Jan Feb Mar Apr May Jun Jul Aug Sep Oct Nov Dec
R
ive
r d
is
c
ha
rge
s (
m
3/s
)
Month Minimum
Maximum
Fig. 5. Acceptable environmental flows in the Yellow River estuary, calculated through the integration of multiple species’ needs.
5 Discussion
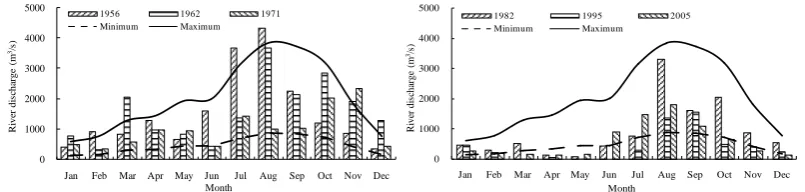
In the Yellow River, dam construction, along with the cor-responding regulation of hydraulic conditions, was intended to prevent disastrous floods and to withdraw water for crop irrigation and improving agricultural production. To pro-vide a comparison of measured, historical flows with rec-ommended environmental flows, data from six years (1956, 1962, 1971, 1982, 1995 and 2005) were selected that closely reflect the average river discharge over the corresponding decade (Fig. 6).
In 1956, monthly river discharges were greater than the maximum level of the environmental flows in February, June and July. In 1965, river discharges fluctuated within the range of the recommended environmental flows, except during the winter (December and January). In 1971, river discharge fell below the minimum environmental flow in June, and ex-ceeded the maximum water requirement in November; other months were within the range of acceptable flows.
[image:6.595.49.286.495.621.2]0 1000 2000 3000 4000 5000
Jan Feb Mar Apr May Jun Jul Aug Sep Oct Nov Dec
Ri
ve
r di
sc
ha
rge
(m
3/s
)
Month
1956 1962 1971
Minimum Maximum
0 1000 2000 3000 4000 5000
Jan Feb Mar Apr May Jun Jul Aug Sep Oct Nov Dec
Ri
ve
r di
sc
ha
rge
(m
3/s
)
Month
1982 1995 2005
[image:7.595.96.499.63.159.2]Minimum Maximum
Fig. 6. Monthly river discharge during a typical year and the associated environmental flow boundary in the Yellow River estuary.
With the development of agriculture and industry in the Yellow River basin, water withdrawal for irrigation has grown at an increasing rate since the 1980s in the upstream area of the Yellow River estuary. In 1982, river discharges dropped below the minimum required flows from April to June, which was directly related to irrigation withdrawals during this critical period in the upstream estuarine area. Be-cause of hydraulic regulation by dams for flood control in the upstream region, river discharge rose sharply in August. In the 1990s, with a climb in water demand for economic growth, freshwater inflows in the estuary were mainly con-centrated in the flood periods in August and September. In 1995, river discharge met the minimum water requirements only in the winter (December and January) and summer (Au-gust to September).
In order to reduce or eliminate the occurrence of zero or ephemeral flow, the Yellow River Water Conservancy Com-mittee has conducted “water and sediment regulation” in June for the Yellow River basin since 1999. In contrast to the situation in 1995, river discharge in June has exceeded mini-mum water requirements each year since 2001 in the Yellow River basin. However, not even the minimum water require-ments have been met during other periods.
While use of average river discharge is typical in envi-ronmental flow assessments, variability in flow should also be considered. Over an approximate 50-yr period, from the 1950s to 2000s, monthly river discharge showed substantial fluctuation, as did associated environmental flow boundaries (Fig. 7a and b, respectively) , The greatest difference between minimum and maximum monthly river discharge generally occurred during late summer and early autumn. In the 1950s, variations in river discharge volumes exceeded the recom-mended boundaries for environmental flows in the summer (July to August) and winter (December and January). In the 2000s, fluctuations in monthly river discharges were much more substantial, frequently falling above, and more often below, recommended environmental flows. The most dra-matic swings in discharge rates occurred in June and July, re-sulting in the maximum volume amplitude during this period of time. Although maximum river discharge that occurred during the summer season could fulfil the maximum water requirements, the minimum river discharges fell short of the minimum requirements.
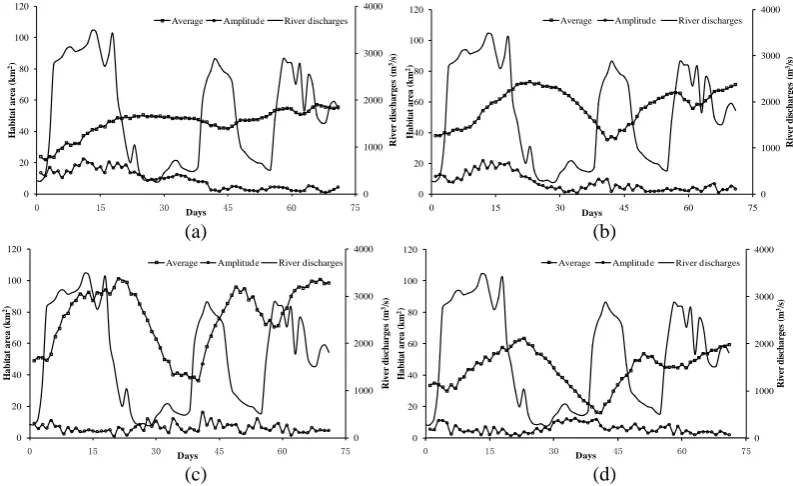
The response time frame of habitat conditions to different river discharge scenarios is not instantaneous; there is always a delay in the effects on associated habitat and, subsequently, to the organisms that utilize those habitats. The impacts of river discharge excursions on available habitat also do not oc-cur in isolation, but impose cumulative effects on the system, species, communities and ecosystems much more vulnera-ble to hydrological alteration. Figure 8 shows fluctuations in habitat area for typical species under a scenario of contin-uously varying river discharge. In the Yellow River estuary, changes in habitat area lagged behind the freshwater inflow variations by 5∼7 d during the high amplitude flood pulses. The cumulative effects on habitat area do not occur linearly with the hydrological processes.
In general, the calculated environmental flows for typical species, based on ideal habitat objectives for that species, are often unsatisfactory for a broader array of organisms, making achievement of a holistic strategy for protection of the aquatic ecosystem difficult to construct. When environ-mental flows are established that encompass the require-ments of a variety of typical habitats, those conditions may not be preferable for several species, or favorable for short-term survival for some organisms. However, the adaptability of populations over time may result in sustainable diversity and improved aquatic ecosystems health on extended spatial and temporal scales. In the presence of short-term tolerance and long-term adaptability of many aquatic and semi-aquatic species, it is possible to establish a wider range of accept-able environmental flows by integrating a diversity of envi-ronmental factors.
There are two major issues that must be addressed dur-ing environmental flow assessments: (1) definition of ecosys-tem protection goals and (2) determination of ecosysecosys-tem responses to hydrological alterations. Recommended envi-ronmental flows may be different when different ecosys-tem response–hydrological alteration relationships were es-tablished, even though the ecosystem protection objectives are the same (Sun et al., 2012). It is important to remember that the relationship between habitat area and hydrological alteration may be significantly impacted by additional envi-ronmental factors such as, for example, water temperature, velocity, and total suspended and dissolved solids. These factors can also impact available habitat area and quality.
1 0 1000 2000 3000 4000 5000 6000
Ja n Feb Ma r Apr Ma y Jun Jul Aug Sep Oct Nov Dec
R iv er d is ch a rg e (m 3/s) Month
Minimum river discha rges Ma ximum river discha rges Minimum requirement Ma ximum requirement
0 1000 2000 3000 4000 5000 6000
Jan Feb Mar Apr May Jun Jul Aug Sep Oct Nov Dec
R iv er d is ch a rg e (m 3/s) Month
Minimum river discharges Maximum river discharges Minimum requirement Maximum requirement
[image:8.595.102.493.64.159.2](b) (a)
Fig. 7. Changes in monthly river discharge and the associated environmental flow boundary in the (a) 1950s and (b) 2000s.
1
(a) (b)
(c) (d)
0 1000 2000 3000 4000 0 20 40 60 80 100 120
0 15 30 45 60 75
R ive r d is ch ar ge s (m 3/s ) H ab it at ar ea ( k m 2) Days
Average Amplitud e River discharges
0 1000 2000 3000 4000 0 20 40 60 80 100 120
0 15 30 45 60 75
R ive r d is ch ar ge s (m 3/s ) H ab it at ar ea ( k m 2) Days
Average Amplitud e River discharges
0 1000 2000 3000 4000 0 20 40 60 80 100 120
0 15 30 45 60 75
R ive r d is ch ar ge s (m 3/s ) H ab it at ar ea ( k m 2) Days
Average Amplitud e River discharges
0 1000 2000 3000 4000 0 20 40 60 80 100 120
0 15 30 45 60 75
R ive r d is ch ar ge s (m 3/s ) H ab it at ar ea ( k m 2) Days
Average Amplitud e River discharges
Fig. 8. Variations of habitat area with changes in river discharge. (a) Chinese shrimp; (b) ridgetail prawn; (c) Chinese mitten crab; (d) jellyfish.
Recommended environmental flows are likely to require ad-justment when additional species are included in the assess-ments. The construction of realistic relationships between species distribution and freshwater inflows remains prob-lematic considering adaptation of species to environmental changes at different spatial and temporal scales. In this study, a potential habitat simulation model was employed as an in-termediate step in addressing environmental flow require-ments, rather than attempting to establish a direct relation-ship between biological adaptation and hydrological alter-ation, which would likely have a high degree of uncertainty. To overcome these uncertainties, data from long-term field studies are critical (Adams et al., 2002; Poff et al., 2003; Schreiber et al., 2004; Richter et al., 2006), as are adaptive management strategies for the implementation and adjust-ment of environadjust-mental flow regimes (Gregory et al., 2006; King et al., 2010).
6 Conclusions
Environmental flow assessments were evaluated based on an integrated multi-objective method which considered variabil-ity of potential habitats for various species in estuaries. A relationship was established between ecological responses and freshwater inflow fluctuations that considered the po-tential positions of the critical habitats following incorpo-ration of the requirements of various environmental factors. Whereas historical flow assessments may have only consid-ered average river discharge, the overall amplitude of change over a given time period must also be considered in envi-ronmental flow assessments. The objectives for a suitable habitat were a high level of habitat area and low environ-mental variability of habitat area. After integrating the water requirements for various species, acceptable environmental flows for the ecosystem over a given temporal range could be recommended.
[image:8.595.98.495.198.441.2]Although environmental flows can be recommended that encompass a range of conditions under which populations can survive and ultimately adapt, variability of potential habitats itself may increase the complexity and uncertainty in an environmental flow assessment. Valuable information can be derived from additional research focusing on ecosys-tem response to hydrological alterations under various time and spatial scales. Although the proposed methodology was applied in an estuary, the principle and approaches used to integrate variability of potential habitats can also be applied in other types of aquatic ecosystems.
Acknowledgements. This work was supported by the National Basic Research Program of China (973) (2013CB430402), the Fund for Creative Research Groups of the National Natural Science Foundation of China (Grant No. 51121003), the Fok Ying Tung Education Foundation (122046), and the National Natural Science Foundation of China (51079005).
Edited by: P. Regnier
References
Acreman, M. C. and Dunbar, M. J.: Defining environmental river flow requirements – a review, Hydrol. Earth Syst. Sci., 8, 861– 876, doi:10.5194/hess-8-861-2004, 2004.
Adams, S. M., Hill, W. R., Peterson, M. J., Ryon, M. G., Smith, J. G., and Stewart, A. J.: Assessing recovery in a stream ecosys-tem: applying multiple chemical and biological endpoints, Ecol. Appl., 12, 1510–1527, 2002.
Archer, D. R., Forsythe, N., Fowler, H. J., and Shah, S. M.: Sus-tainability of water resources management in the Indus Basin under changing climatic and socio economic conditions, Hy-drol. Earth Syst. Sci., 14, 1669–1680, doi:10.5194/hess-14-1669-2010, 2010.
Arthington, A. H., Bunn, S. E., Poff, N. L., and Naiman, R. J.: The Challenge of Providing Environmental Flow Rules to Sus-tain River Ecosystems, Ecol. Appl., 16, 1311–1318, 2006. Arthington, A. H., Naiman, R. J., McClain, M. E., and Nilsson, C.:
Preserving the biodiversity and ecological services of rivers: new challenges and research opportunities, Freshwater Biol., 55, 1– 16, 2010.
Attrill, M. J., Rundle, S. D., and Thomas, R. M.: The influence of drought-induced low freshwater flow on an upper-estuarine macroinvertebrate community, Water Res., 30, 261–268, 1996. Buzan, D., Lee, W., Culbertson, J., Kuhn, N., and Robinson, L.:
Positive relationship between freshwater inflow and oyster abun-dance in Galveston Bay, Texas, Estuar. Coast., 32, 206–212, 2009.
Cissoko, M., Desnues, A., Bouvy, M., Sime-Ngando T., Verling, E., and Bettarel, Y.: Effects of freshwater and seawater mixing on vireo and bacterioplankton in a tropical estuary, Freshwater Biol., 53, 1154–1162, 2008.
Clements, W. H., Arnold, J. L., Koel, T. M., Daley, R., and Jean, C.: Responses of benthic macroinvertebrate communities to nat-ural geothermal discharges in Yellowstone National Park, USA, Aquat. Ecol., 45, 137–149, 2011.
Deng, J. Y., Ye, C. C., and Liu, Y. C.: Penaeid Prawn and its resource management in Bohai Sea and Yellow Sea, Ocean Press, Beijing, 1990 (in Chinese).
D¨oll, P., Fiedler, K., and Zhang, J.: Global-scale analysis of river flow alterations due to water withdrawals and reservoirs, Hy-drol. Earth Syst. Sci., 13, 2413–2432, doi:10.5194/hess-13-2413-2009, 2009.
Dong, L. X., Su, J. L., Deng, J. Y., and Chen, Q.: The importance of estuarine gravitational circulation in the early life of the Bohai Penaeid Prawn, J. Mar. Syst., 67, 253–262, 2007.
Fan, H. and Huang, H. J.: Response of coastal marine eco-environment to river fluxes into the sea: A case study of the Huanghe (Yellow) River mouth and adjacent waters, Mar. En-viron. Res., 65, 378–387, 2008.
Fleenor, W. E., Bennett, W. A., Moyle, P. B., and Lund, J. L.: On developing prescriptions for freshwater flows to sustain desir-able fishes in the Sacramento-San Joaquin Delta. Working Paper, Delta Solutions Program, Center for Watershed Sciences, Uni-versity of California – Davis, available at: http://deltasolutions. ucdavis.edu (last access 1 September 2011), 2010.
Gregory, R., Ohlson, D., and Arvai, J.: Deconstructing adaptive management: criteria for applications to environmental manage-ment, Ecol. Appl., 16, 2411–2425, 2006.
Hu, Q. X. and Lu, J. S.: Preliminary analysis of the relation of growth of penaeus orientalis kishinouye with environmental fac-tors, Donghai Mar. Sci., 8, 58–62, 1990 (in Chinese).
Huisman, J. and Weissing, F. J.: Biodiversity of plankton by species oscillations and chaos, Nature, 402, 407–410, 1999.
King, A. J., Ward, K. A., O’Connor, P., Green, D., Tonkin, Z., and Mahoney, J.: Adaptive management of an environmental water-ing event to enhance native fish spawnwater-ing and recruitment, Fresh-water Biol., 55, 17–31, 2010.
Koehn, J. D., Hobday, A. J., Pratchett, M. S., and Gillanders, B. M.: Climate change and Australian marine and freshwater environ-ments, fishes and fisheries: synthesis and options for adaptation, Mar. Freshwater Res., 62, 1148–1164, 2011.
Lu, N., Liu, C. Y., and Guo, P.: Effect of salinity on larva of edible medusae (Rhopfilema esculenta kishinouye) at different devel-opment phases and a review on the cause of jellyfish resources falling greatly in Liaodong bay, Acta Ecologica Sinica, 9, 304– 309, 1989 (in Chinese).
McCartney, M. P., Shiferaw, A., and Seleshi, Y.: Estimating environ-mental flow requirements downstream of the Chara Chara weir on the Blue Nile River, Hydrol. Process., 23, 3751–3758, 2009. Pasztalenieca, A. and Poniewozik, M.: Phytoplankton based
as-sessment of the ecological status of four shallow lakes (Eastern Poland) according to Water Framework Directive – a comparison of approaches, Limnologica, 40, 251–259, 2010.
Petts, G. E.: Instream flow science for sustainable river manage-ment, J. Am. Water Resour. A., 45, 1071–1086, 2009.
Poff, L. N., Allan, J. D., Palmer, M. A., Hart, D. A., Richter, B. D., Arthington, A. H., Rogers, K. H., Meyer, J. L., and Stanford, J. A.: River flows and water wars: emerging science for envi-ronmental decision making, Front. Ecol. Environ., 1, 298–306, 2003.
R. E., and Warner, A.: The ecological limits of hydrologic alter-ation (ELOHA): a new framework for developing regional envi-ronmental flow standards, Freshwater Biol., 55, 147–170, 2009. Powell, G. L., Matsumoto, J., and Brock, D. A.: Methods for
de-termining minimum freshwater inflow needs of Texas Bays and estuaries, Estuaries, 25, 1262–1274, 2002.
Pyron, M. and Neumann, K.: Hydrologic alterations in the Wabash River watershed, USA, River Res. Appl., 24, 1175–1184, 2008. Richter, B. D., Baumgartner, J. V., Wigington, R., and Braun, D. P.:
How much water does a river need?, Freshwater Biol., 37, 231– 249, 1997.
Richter, B. D., Warner, A. T., Meyer, J. L., and Lutz, K.: A collab-orative and adaptive process for developing environmental flow recommendations, River Res. Appl., 22, 297–318, 2006. Schreiber, E. S. G., Bearlin, A. R., Nicol, A. R., and Todd, C. R.:
Adaptive management: a synthesis of current understanding and effective application, Ecol. Manage. Rest., 5, 177–182, 2004. Shafroth, P. B., Wilcox, A. C., Lytle, D. A., Hickey, J. T., Andersen,
D. C., Beauchamp, V. B., Hautzinger, A., MCMullen, L. E., and Warner, A.: Ecosystem effects of environmental flows: modeling and experimental floods in a dryland river, Freshwater Biol., 55, 68–85, 2010.
Song, J., Wu, Y., Li, X. D., and Liu, X.: Influence factors on growth and survival of Rhopilema esculenta, Hebei Fisheries 6, 45–49, 2009 (in Chinese).
Sun, T., Yang, Z. F., and Cui, B. S.: Critical environmental flows to support integrated ecological objectives for the Yellow River Estuary, China. Water Resour. Manage., 22, 973–989, 2008. Sun, T., Yang, Z. F., Shen, Z. Y., and Zhao R.: Environmental flows
for the Yangtze Estuary based on salinity objectives, Commun. Nonlinear Sci., 14, 959–971, 2009.
Sun, T., Xu, J., and Yang, Z.F.: Objective-based Method for Envi-ronmental Flow Assessment in Estuaries and Its Application to the Yellow River Estuary, China, Estuar. Coast., 35, 892–903, 2012.
The Brisbane Declaration: Environmental Flows are Essential for Freshwater Ecosystem Health and Human Well-Being. Decla-ration of the 10th International River Symposium and Interna-tional Environmental Flows Conference, Brisbane, Australia, 3– 6 September, 2007.
Townsend, S. A. and Padovan, A. V.: A model to predict the re-sponse of the benthic macroalga spirogyra to reduced base flow in the tropical Australia, River Res. Appl., 25, 1193–1203, 2009. van de Pol, M., Ens, B. J., Heg, D., Brouwer, L., Krol, J., Maier, M., Exo, K. M., Oosterbeek, K., Lok, T., Eising, C. M., and Kof-fijberg, K.: Do changes in the frequency, magnitude and timing of extreme climatic events threaten the population viability of coastal birds?, J. Appl. Ecol., 47, 720–730, 2010.
Vogel, R. M., Sieber, J., Archfield, S. A., Smith, M. P., Apse, C. D., and Huber-Lee, A.: Relations among storage, yield, and instream flow, Water Resour. Res., 43, W05403, doi:10.1029/2006WR005226, 2007.
Wang, X. Q. and Cao, M.: Effects of low salinity and low tem-perature on growth and energy budget of juvenile Exopalaemon carinicauda, J. Hydroecol., 3, 66–71, 2010 (in Chinese). Xue, J. Z., Du, N. S., Lai, W., and Wu, H. X.: A review of studies on
Portunus trituberculatus in China, Donghai Mar. Sci., 15, 60–65, 1997 (in Chinese).
Yang, W.: A multi-objective optimization approach to allocate en-vironmental flows to the artificially restored wetlands of China’s Yellow River Delta, Ecol. Modell., 222, 261–267, 2011. Zhang, S., Dong, S. L., and Wang, F.: Studies on the bioenergetics
of Penaeus Chinensis ?. Oxygen consumption and ammonia-N excretion rates under different conditions, Journal of Ocean Uni-versity of Qingdao, 8, 223–227, 1998 (in Chinese).
Zhao, B., Zhang, X. M. Chen, S. Q. Cheng, Y. X., and Zhang, Y.: Effect of different environmental factors on early development of jellyfish, Rhopilema esculenta, Marine Fisheries Research, 27, 87–92, 2006 (in Chinese).
Zhu, X. and Tang, Q.: Structuring dominant components within fish community in Bohai Sea system, Studia Marina Sinica, 44, 159– 168, 2002 (in Chinese).