www.hydrol-earth-syst-sci.net/18/3225/2014/ doi:10.5194/hess-18-3225-2014
© Author(s) 2014. CC Attribution 3.0 License.
Analysis of landslide triggering conditions in the Sarno area
using a physically based model
G. Capparelli and P. Versace
Dipartimento di Elettronica, Informatica e Sistemistica, Università della Calabria, Via P. Bucci, 41C, Arcavacata di Rende, CS, Italy
Correspondence to: G. Capparelli ([email protected])
Received: 3 July 2013 – Published in Hydrol. Earth Syst. Sci. Discuss.: 21 October 2013 Revised: 14 June 2014 – Accepted: 29 June 2014 – Published: 27 August 2014
Abstract. Rainfall is recognized as a major precursor of many types of slope movements. The technical literature reports both study cases and models of landslides induced by rainfall. Subsurface hydrology has a dominant role since changes in the soil water content significantly affect the soil shear strength. The analytical approaches used are very dif-ferent, ranging from statistical models to distributed and complete models. The latter take several components into account, including specific site conditions, mechanical, hy-draulic and physical soil properties, local seepage conditions, and the contribution of these to soil strength.
This paper reports a study using a complete model, named SUSHI (Saturated Unsaturated Simulation for Hillslope In-stability), to simulate the role of subsurface hydrology in rain-induced landslides, on a case of great interest both in terms of its complexity and its severity.
The landslide-prone area in question is located in Cam-pania (southern Italy), where disastrous mudflows occurred in May 1998. The region has long been affected by rainfall-induced slope instabilities, which often involve large ar-eas and affect many people. The application allows a bet-ter understanding of the role of rainfall infiltration and suc-tion changes in the triggering mechanism of the phenomena. These changes must be carefully considered when assessing hazard levels and planning mitigation interventions regard-ing slope stability.
1 Introduction
The problems and the damage caused by landslides have be-come increasingly complex, accounting each year for huge property damage in terms of both direct and indirect costs. Social and economic losses due to landslides can be reduced by effective planning and management. This includes limit-ing of development in landslide-prone areas, followlimit-ing ap-propriate construction regulations, using physical measures to prevent or control landslides, and setting up early warn-ing systems. To tackle landslide problems, it is necessary to develop a better understanding of trigger mechanisms, prop-agation and impact.
As a result of rainfall events and subsequent infiltration, the soil moisture can be significantly changed with a de-crease in suction in unsaturated soil layers and/or an inde-crease in pore-water pressure in saturated layers. As a consequence, in these cases, the shear strength can be reduced enough to trigger a failure.
The severity of events is also influenced by the hetero-geneity of hydraulic and geotechnical properties. The com-plex hydrological responses of natural slopes are strongly in-fluenced by infiltration into unsaturated soil, surface runoff, slope-parallel flow through perched aquifers, subsurface flows from upstream areas, the effect of vegetation and flows through fractured bedrock. All these issues affect the pre-dictive ability of the models and sometimes impact on the difficulty of interpreting the results.
be ignored in situations characterized by a deep groundwater table and shallow failure surface (Lu and Godt, 2013).
Analytical approaches differ in terms of the spatial scale range adopted, the available data and the description of the processes occurring in the slope.
Empirical models that directly analyze the rainfall by iden-tifying threshold values are very popular. These values are assumed on the basis of historical data and are shown in an intensity–duration plot as proposed by Caine (1980); they provide a lower limit of rainfall associated with the oc-currence of landslides, shallow landslides and debris flows (Guzzetti, 2008).
Other types of rainfall thresholds (Glade, 2000) consider the effect of previous rainfall events as more important than the rainfall recorded on the day the landslide occurred. Usu-ally this type of approach is related to the study of deep-seated landslides.
Combined with rainfall forecasting models, both stochas-tic and meteorological, empirical models are an essential tool to support the prediction of landslides in early warning sys-tems (Sirangelo et al., 2003; Versace et al., 2003; Capparelli and Tiranti, 2010).
However, these models do not provide any information on the hydrological processes involved in a landslide area and do not improve our understanding of landslide dynamics.
Complete models can help in understanding triggering mechanisms since they attempt to reproduce the physical behavior of the processes involved at hillslope scale, using detailed hydrological, hydraulic and geotechnical informa-tion (Montgomery and Dietrich, 1994; Wu and Sidle, 1995; Iverson, 2000; Baum et al., 2002; Rigon et al., 2006; Arnone et al., 2011). They develop an analysis over wide areas and usually produce a susceptibility map characterizing the landslide-prone zones according to a stability index. They are generally composed of a hydrological and a geotechni-cal module.
Hydrological modules differ considerably from each other. The geotechnical module in most cases makes use of the limit equilibrium method under the assumption of an infinite slope. Only in a few cases is more detailed analysis carried out, as in Lu and Godt (2013), where the authors provide a quantitative treatment of rainfall infiltration, effective stress and their coupling and roles in hillslope stability by intro-ducing a unified effective stress modeling framework, linking soil suction to effective stress.
The hydrological approach proposed in SHALSTAB (SHALlow Landslides STABility) (Montgomery and Diet-rich, 1994) assumes a constant infiltration rate, neglects soil moisture above the water table, does not take into account the transient response to rainfall and considers the ground-water flow parallel to the slope. These assumptions are too restrictive, for example, when pore-water pressure responds very quickly to transient rainfall and its redistribution has a large component that is normal to the slope.
Wu and Sidle (1995) also combined the infinite slope limit equilibrium equation with a subsurface flow model based on the kinematic wave approximation, also taking into ac-count the vegetation root strength. An enhanced version of this model is proposed by Dhakal and Sidle (2004), who in-vestigate the influence of different rainfall characteristics on slope stability.
Iverson (2000) developed a flexible framework by model-ing a one-dimensional linear diffusion process in saturated soil, using an analytical solution of Richards equation. The model is valid for hydrological modeling in nearly saturated soil. According to this hypothesis, which is used to find an analytical solution to pressure heads, the infiltration capac-ity is assumed to be equivalent to the saturated hydraulic conductivity, instead of considering it as variable with time during the rainfall event. In addition, Iverson considers the ground surface of the hillslope subject to uniform rainfall.
In order to take into account the variability of rainfall in-tensity and duration, dynamic or quasi-dynamic models have been introduced. These include TRIGRS (Transient Rainfall Infiltration and Grid-based Regional Slope-stability model) (Baum et al., 2002), which gives a more precise description of slope hydrology but requires a large number of parame-ters. The model performs transient seepage analysis, using the linearized solution to the Richards equation proposed by Iverson (2000) and extended to the case of impermeable bedrock located at a finite depth.
A more recent version – TRIGRS-unsaturated (Baum et al., 2008) – predicts the pore-water pressure regime in unsaturated/saturated conditions, coupling the simple ana-lytic solution for transient unsaturated infiltration proposed by Srivastava and Yeh (1991) with the original TRIGRS equation.
Most of the aforementioned approaches rely on the restric-tive assumption of a steady-state subsurface flow, which can affect the predictive capability of the models both in terms of accuracy and timing of the prediction. All models must al-ways be validated by checking, for example, the accuracy of the simulation with the experimental data available from real cases. The results, in fact, can sometimes be very different when different models are applied to the same event. This is described in Sorbino et al. (2010), who illustrate how, by ap-plying three different physically based models (SHALSTAB, TRIGRS and TRIGRS-unsaturated) to the same set of geo-environmental cases, different results were obtained. The re-sults reveal the advantages and limitations of each model in landslide forecasting.
These types of spatial, distributed modeling are clearly well-suited for shallow landslides but in deeper landslides their effectiveness is hindered by the higher complexity of the phenomena (van Westen et al., 2003).
to improve the understanding of the slope failure mechanism during rainfall infiltration.
SUSHI takes into account several components, such as specific site conditions, mechanical, hydraulic and physical soil properties, local seepage conditions and their contribu-tion to soil strength.
It is composed of a hydraulic module to analyze the subsoil water circulation due to the rainfall infiltration under tran-sient conditions and a geotechnical module, which provides the slope stability using the limit equilibrium equation.
The hydraulic process is highlighted by the implementa-tion of a finite difference scheme, which solves the Richards equation used to represent saturated/unsaturated flows within a hillslope. The temporal and spatial distributions of moisture content in the subsurface are calculated, in order to evaluate the different contributions such as the downslope and verti-cal components of flow in the hillslope caused by unsteady rainfall.
The model was also developed for cases with strongly het-erogeneous soils, irregular domains and variable boundary conditions in space and time. After a brief introduction of the model, the paper describes the analysis and results ob-tained for the volcaniclastic covers of Sarno, where catas-trophic mudslides occurred in May 1998.
Mudslides have been analyzed in several papers focusing on the most significant, hydrological and geotechnical fea-tures and on the models for triggering mechanisms and land-slide propagation.
There is still no commonly accepted interpretation of the triggering mechanism of landslides such as ones occurring in similar geomorphological contexts in Campania.
To summarize, the objectives of the presented application are:
– to formulate a likely interpretation of the mudslide trig-gering mechanism, highlighting the main factors affect-ing slope stability;
– study the rainfall infiltration dynamics, checking whether pore-water pressure, just before the landslide events, reached levels never attained before;
– verify the model’s ability to analyze a real case, charac-terized by very marked spatial heterogeneity.
[image:3.612.317.535.94.258.2]Using a physically based model designed and created ad hoc is mandatory for such purposes, as unlike many commercial models, it allows interaction with the source code in such a way as to adapt it to the specific case by modifying the spa-tial and temporal resolution as well as the parametrization of the various processes and variables analyzed. It is thus pos-sible to make replacements, to verify the accuracy of the re-sults and to improve its performance by adapting it to specific cases.
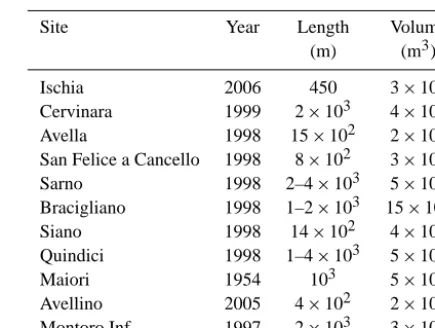
Table 1. Features of some recent flowslides in the Campania Region (Versace et al., 2009).
Site Year Length Volume
(m) (m3)
Ischia 2006 450 3×10⁴
Cervinara 1999 2×10³ 4×10⁴
Avella 1998 15×102 2×10⁴
San Felice a Cancello 1998 8×10² 3×10⁴
Sarno 1998 2–4×10³ 5×10⁵
Bracigliano 1998 1–2×10³ 15×104
Siano 1998 14×102 4×10⁴
Quindici 1998 1–4×10³ 5×10⁵
Maiori 1954 103 5×10⁴
Avellino 2005 4×10² 2×10⁴
Montoro Inf. 1997 2×10³ 3×10⁴
2 Study area
2.1 Description of the study site
The case study proposed in the paper is located in Campania (Italy), where catastrophic flowslides and debris flows in py-roclastic soils are frequent. A brief list of some recent events is reported in Table 1, which also includes information on the size of the landslide. Pizzo d’Alvano is a NW–SE oriented morphological structure, consisting of a sequence of stone, dolomitic limestone and, subordinately, marly lime-stone dating from the Lower to Upper Cretaceous age. The slopes are mantled by very loose pyroclastic soils which are the result of the explosive activity of the Somma–Vesuvius volcanic complex, both as primary airfall deposits and vol-caniclastic deposits, according to the mode of transport and deposition (Rolandi, 1997). Airfall deposits were dispersed along directions ranging from N–NE to S–SE, according to the prevailing wind direction, and covered a wide area reach-ing distances of up to 50 km.
Figure 1. Overview of the Pizzo d’Alvano Massif and the area af-fected by the May 1998 mudflows. The red square delimits the area where the SUSHI model has been applied.
2.2 Description of the landslide events
On 5 May 1998, a huge number of mudflows were trig-gered on the slopes of the Pizzo d’Alvano Massif (Fig. 1), involving an extension area of around 60 km2, a volume of 2 000 000 m3(40 % derived from the eroded materials along the channels) and leading to 159 victims and huge damage to the towns of Sarno, Quindici, Siano and Bracigliano.
These landslides were classified as very rapid to extremely rapid soil slip/debris flows (Ellen and Fleming, 1987), which traveled downslope and then propagated in highly urbanized areas.
A characteristic element is represented by the run-out distances, which ranged from a few hundred meters up to distances of over 2 km (Revellino et al., 2004) and speeds which, at the toe of channels, were estimated to be in the range of about 5–20 m s−1.
Many similar phenomena have afflicted various other parts of the world, (Japan in 1985, California in 1973 and 2005, Brazil in 1967, Venezuela in 1999), in some cases involving similar pyroclastic soils.
Although the triggering mechanisms are different and sometimes the soils involved are not always similar, the com-mon feature seems to be the presence of particles with a high porosity and a very low degree of cementation; these change suddenly due to the action of an external agent (such as an earthquake or more often a rainfall event), which produces a rapid increase in pore-water pressure. What made the May 1998 landslides unique and what made the events even more tragic, was that they all occurred at the same time over a large area, and an extremely high amount of material was involved. The flowslides of Campania have been analyzed in sev-eral papers which indicate the most significant geomorpho-logical, hydrological and geotechnical features of the slopes
involved, and propose models for the triggering mechanisms and propagation of landslides.
Cascini et al. (2008) argue that the instabilities in Sarno were caused by a combined effect of water infiltrated into the surface layers plus water from a temporary spring in the bedrock. Calcaterra et al. (2000) discuss the role played by groundwater circulation inside both the pyroclastic deposits and the karst cavities of the underlying limestone bedrock.
Soil water circulation is important due to the typical strati-fication of the pyroclastic covers involved, where one or more layers of pumice, with high permeability at saturation, and layers of paleosoils, with lower saturated permeability, are present.
When persistent rainfall events occur, it encourages sub-surface runoff, which may predispose the slope to instability in limited areas.
The role played by the possible interaction of the unsatu-rated cover with the underlying groundwater, through an im-pervious soil–bedrock interface, has also been analyzed, by Greco et al. (2013), for a slope similar to those in Sarno.
Vegetation and plant roots and their possible relations to slope instability have also been analyzed. Some authors em-phasize the highly dynamic nature of the soil-vegetation as a whole, where the hydrological processes can be greatly af-fected by the dynamics of the vegetation. Changes in vegeta-tion cover can produce equally rapid effects on the soil and water regime (Mazzoleni et al., 1998).
2.3 Description of field surveys and rainfall events
In the years following the landslide events, many field sur-veys have been carried out in order to assess hydraulic and geotechnical soil characteristics of the site.
In order to assess the influence of soil suction on the trig-gering mechanism, suction measurements were performed along the Tuostolo Basin (Sarno area), very close to areas that collapsed in May 1998 (Cascini and Sorbino, 2004), us-ing quick-draw portable tensiometers and jet fill tensiome-ters. These measurements were taken at three sites (Fig. 2), at different depths from the ground surface. Site 1 was lo-cated in an area not affected by the landslides in 1998; sites 2 and 3 were located in landslide source areas.
A significant spatial and temporal variability of soil suc-tion can be noted (Fig. 3), essentially related to the differ-ences between the sites, the depths at which the measure-ments were carried out and also to local factors which induce changes at the end of the dry season when the acquired data show very high suction levels (up to 65 kPa).
Figure 2. Topographic map and sites where suction measurements were performed.
greater than 40◦, much larger than their friction angle. In
such geomorphological conditions, soil suction, which in-creases soil shear strength, is a major contributor to slope stability.
These considerations support the interest in the suction as-sessment in these pyroclastic soils as possibly the main pre-disposing cause. The availability of models able to simulate the circulation of water in these complex terrains can provide useful tools to better understand these phenomena.
The rainfall data were collected by the rain gauge of Santa Maria La Foce, around 2 km from the triggering landslide area, which in 1998 recorded a total rainfall value of 900 mm (Fig. 4).
This station is located at 192 m a.s.l., lower than the land-slide source areas (700 m a.s.l.). It is therefore likely that the rainfall along the landslide source areas could be greater than that measured by the rain gauge located at a lower altitude. Available data reveal that, the rainfall occurring in May 1998 was not extreme, in fact it was characterized by a return pe-riod lower than five years, but the pepe-riod when it occurred was unusual. In fact, the monthly and maximum daily values of rainfall height observed in April and May 1998 are signif-icantly higher than the mean rainfall and than the maximum daily rainfall values over the period 1967–1997 (Table 2).
3 SUSHI model framework
[image:5.612.312.544.66.454.2]The model combines two modules: HydroSUSHI, which studies subsoil water circulation, and GeoSUSHI, which as-sesses slope stability.
Figure 3. Suction trends recorded and daily rainfall measured by Santa Maria la Foce rain gauge at 0.20, 1.00 and 1.60 m from topsoil.
[image:5.612.312.547.515.655.2]HydroSUSHI analyzes subsoil water circulation in a spa-tial two-dimensional domain which can be characterized by irregular soil stratigraphy.
Concerning the GeoSUSHI module, a stability analysis is performed to better understand how negative pore-water pressures (or matric suction) increase the shear strength of the soil.
The infiltration analysis is carried out using the Richards equation (1931), expressed in terms of water potential to facilitate applications on layered soils and transient flow regimes for both saturated and unsaturated conditions.
By adopting a Cartesian orthogonal reference system Oxz, with zaxis positive downwards, the governing differential equation is
∇·[K (ψ )∇(ψ−z)]=[C (ψ )+Se(ψ ) Ss]
∂ψ
∂t , (1)
whereK (ψ )[L/T] is the hydraulic conductivity which de-pends on pressure headψ[L] for unsaturated soils (neglect-ing soil anisotropy). The right-hand side of Eq. (1) is writ-ten to simulate water flows in both unsaturated and satu-rated zones, thus avoiding the use of different algorithms for the resolution of parabolic and elliptic equations. C (ψ )= dϑ/dψ [L−1] is the specific soil water capacity in the un-saturated zone, which represents the rate at which soil ab-sorbs or releases water when there is a change in pressure head;SS[L−1] is the specific volumetric storage, accounting
for soil deformation, which is a feature that not many mod-els have; effective saturation Se[ψ]=(ϑ−ϑr) / (ϑs−ϑr),
whereθ is the water content,θs is the porosity andθris the
residual water content, which can be computed using the soil water retention curve. The saturated flow equation is simply a special case of the Richards equation, in which the conduc-tivity and storage terms are not functions of pressure head.
This module was upgraded by incorporating a method to describe the evapotranspiration process although this com-ponent usually produces only secondary effects when slope mobilizations occur during very rainy periods (Capparelli and Versace, 2011). Since the case study here proposed took place during a very rainy spring, the effects related to evapo-transpiration were neglected.
3.1 Model structure
In the HydroSUSHI module the finite differences method (FDM) with a fully implicit method is adopted. It is well known that the Richards equation only allows analyti-cal solutions where simplifying hypotheses and/or partic-ular boundary conditions are introduced (Iverson, 2000; Srivastava and Yeh, 1991).
Finite difference algorithms which deal with either vari-ably saturated or fully unsaturated conditions have been pro-posed by Freeze (1978) and Vauclin et al. (1979). In this approach, the continuous problem domain is discretized so
that the dependent variables are considered to exist only at discrete points.
Figure 5 shows an example of the spatial discretization created by a regular mesh(1x;1z). The size to be assigned to1x and1zshould be selected on the basis on the com-plexity of the stratigraphy. The layers need to be faithfully reproduced, so as to guarantee a realistic representation of water flow exchanges.
With reference to the generic node with coordinatesx=
x0+i1x, z=z0+j 1z according to the finite difference
method, Eq. (1) can be written as 1
1x
K
ψi(k+1)+1/2,j
ψi+1,j(k+1)−ψi,j(k+1) 1x
−Kψi−1/2,j(k+1)
ψi,j(k+1)−ψi(k+1)−1,j 1x + 1 1z K
ψi,j+1/2(k+1)
ψi,j+1(k+1)−ψi,j(k+1) 1z −1
−K
ψi,j−1/2(k+1)
ψi,j(k+1)−ψi,j−1(k+1) 1x −1
=CSU
ψi,j(k+1) ψ
(k+1) i,j −ψ
(k) i,j
1t
!
, (2)
whereCSU=[C (ψ )+Se(ψ ) Ss], the subscripts i±1/2, j
and i, j±1/2 indicate quantities evaluated at the spa-tial coordinates (x0+(i±1/2) 1x, z0+j 1z) and
(x0+i1x, z0+(j±1/2) 1z), 1t is the time step, and
the superscripts(k)and(k+1)indicate quantities referring to time instantst=t0+k1tandt=t0+(k+1) 1t.
To solve Eq. (1), boundary conditions along the edges of the integration domain must be specified. A general form of the boundary conditions for the considered PDE (partial dif-ferential equation) can be written as (McCord, 1991)
α (ζ ) ψ+β (ζ )∂ψ ∂n ∂G
=B (ζ, t ) , (3)
where α (ζ ), β (ζ ) and B (ζ, t ) are given functions evalu-ated on the boundary∂G, the expression∂/∂nis the normal derivative operator andζis the spatial local vector.
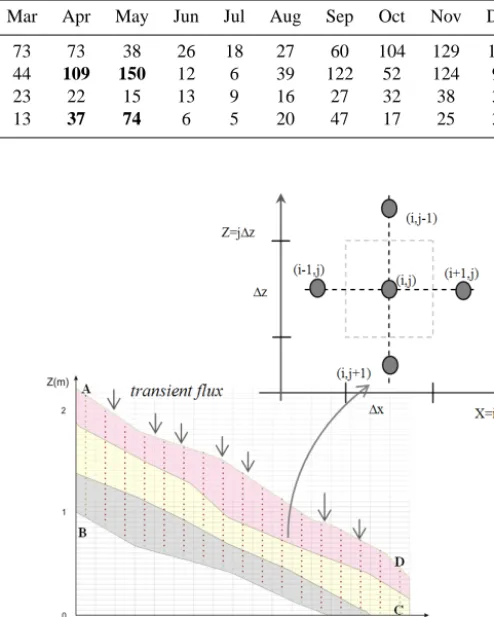
Table 2. Comparison between mean monthly rainfall computed for the period 1964–1997 and the year 1998 (rows a–b); and between maximum daily rainfall for the period 1964–1997 and the year 1998 (rows c–d). Some values are in bold because they reflect the situation of the specific period analyzed. This allows to differentiate the values from other reported data.
Jan Feb Mar Apr May Jun Jul Aug Sep Oct Nov Dec
(a) Monthly expected value (mm) 1964–1997 87 85 73 73 38 26 18 27 60 104 129 111
(b) 1998 77 46 44 109 150 12 6 39 122 52 124 94
(c) Daily maximum (mm) 29 24 23 22 15 13 9 16 27 32 38 34
(d) 1998 42 21 13 37 74 6 5 20 47 17 25 37
∂h ∂z
BC
=0, (4)
∂h ∂x
AB
=0. (5)
For the vertical downslope side DC we take into account the influence of the increasing subsurface flow, by considering both unsaturated and saturated layers. This is computed by adopting boundary conditions moving from the Neumann to Dirichlet conditions, with specified flux or pressure head, re-spectively,α (ζ )=1,β (ζ )=0 andB (ζ, t )=h (ζ, t ). Then
∂h ∂x
DC
=q (x, t )=0 (6) or
ψ|DC=0. (7)
Along the upper boundary AD a time-dependent rainfall in-tensity r [L/T] is applied. The boundary condition can be stated by considering the infiltration rateI (x, t )as
K (x, t ) ∂h (x, t ) ∂z
AD
=B (ζ, t )=I (x, t ) . (8) In particular
(
B (ζ, t )=I (x, t )=r (x, t ) if r (x, t )≤K (x, t )∂h(x,t )∂z B (ζ, t )=I (x, t )=K (x, t )∂h(x,t )∂z if r (x, t ) > K (x, t )∂h(x,t )∂z .(9) The valueK (x, t )will depend on the values ofψ (x, t )at the pointxat timetand on the nature of theK (ψ )curve for the surface soil atx.
As previously mentioned, in the GeoSUSHI module the stability analysis is carried out by evaluating the influence of negative pore-water pressures as well.
It may be a reasonable assumption to ignore negative pore-water pressures for many situations where most of the slip surface is below the groundwater table. However, for situa-tions where the groundwater table is deep or where there is concern over the possibility of shallow failure surface, nega-tive pore-water pressures cannot be ignored.
The procedure adopted here is an extension of conven-tional limit equilibrium methods adapted to unsaturated soils as suggested by Fredlund and Rahardjo (1993).
Figure 5. Nodal network implemented for development of FDM equation.
The shear strength of an unsaturated soil can be formulated in terms of independent stress state variables(σ−ua) and
(ua−uw)as follows:
τff=c0+(σn−ua)ftanϕ0+(ua−uw)ftanϕb, (10)
where the subscriptsf indicate quantities evaluated on the failure plane at failure, andτff is shear stress,c0is effective
cohesion,(σn−ua)fnet normal stress state,uapore-air
pres-sure,ϕ0effective friction angle,(ua−uw)matric suction and
ϕbangle indicating rate of increase in shear strength relative to the matric suction. This last term is evaluated using the expression proposed by Vanapalli et al. (1996).
Equation (10) is an extension of the shear strength equa-tion for a saturated soil. As the soil approaches saturaequa-tion, the pore-water pressure, uw, approaches the pore-air
pres-sureuaand matric suction(ua−uw)goes to zero. The
[image:7.612.296.543.111.419.2]Figure 6. Picture of the case study area with some topographic details.
(Fredlund and Rahardjo, 1993). FS is defined as the factor by which the shear strength parameters must be reduced in or-der to bring the soil mass into a state of limiting equilibrium along the assumed slip surface.
Here the calculations for evaluating the stability of a slope are performed by dividing the soil mass above the slip surface into vertical slices. The mobilized shear force at the base of a slice can be written using the shear strength for an unsatu-rated soil:
Sm=
βτff
FS, (11)
whereSmis the shear force mobilized at the base of the slice;
andβis the sloping distance across the base of a slice. 3.2 Input data and slope scheme
The SUSHI model was applied to the mudflow occurring in the Tuostolo Basin, highlighted by the red square in Fig. 1, which destroyed the village of Sarno.
The actual geometry of the mudflow is the result of the coalescence of further landslides that took place over a period of 6–8 h.
The landslide mobilized a volume of about 92 000 m3of volcaniclastic materials resting over carbonate bedrock, in-cluding the eroded material within the channel. It developed from an altitude of about 725 m to a subvertical limestone wall (a morphological frame) situated at an altitude of about 500 m (Fig. 6).
Most of the landslide occurred in May 1998. It started from the point where morphological discontinuities are lo-cated, also represented by topographic variations or anthro-pogenic discontinuities such as tracks.
To define the dynamics of the water circulation in the sub-soil, the solution requires a description of the investigated domain, the soil water characteristic curves, the permeability functions, the mechanical properties of the involved soils, as well as the boundary and initial conditions.
Figure 7. Geometric and stratigraphic characterization of the inves-tigated slope.
Surveys and studies carried out by also using information available in the literature indicated the presence of alternat-ing layers of pumice with a composition and thickness re-lated to the characteristics of the eruptions and to the distance from the eruptive centers.
This sequence comprises both primary airfall and volcani-clastic deposits. The primary deposits are composed of al-ternating layers of pumice, with interbedded paleosoils. At the base of this sequence, above the bedrock, there is a layer of dark-red clayey ashy soil (regolith) with rare limestone fragments.
By using the available topographic maps showing the top surface of the ground before the events, the soil cover thick-ness and their distributions were obtained.
At the main scarp, the average thickness of the pyroclas-tic cover was about 4 m. From top to bottom under a top-soil formed by humified ashes including roots and organic matter (about 90 cm thick), the following layers were identi-fied: (A) an upper layer (60 cm) of coarse pumice; (B) a layer (70 cm) of paleosoil; (C) a horizon (60 cm) of finer pumices; (D) a layer (80 cm) of paleosoil; (E) a bottom layer (40 cm) of weathered dark-red clayey ash in contact with the fractured limestone bedrock (Fig. 7).
To determine the mechanical and hydraulic properties of the cover involved, undisturbed specimens were collected, both from the investigated area and from other triggering ar-eas on the Pizzo d’Alvano slopes. Table 3 reports the mean values of the physical properties of the various materials.
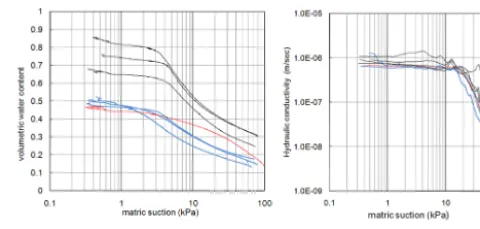
The hydraulic properties of the ashy soils in saturated con-ditions were investigated by conventional permeameter tests. In the unsaturated conditions, suction-controlled oedometer was used.
[image:8.612.313.543.69.220.2]As shown in Fig. 8, the SWRC (soil water retention curve) are extremely variable, butt in all cases they are typical of coarse soils with low air-entry pressure, low residual water content and steep slope within the transition zone.
Due to a lack of direct measurements, representative val-ues have been considered as the specific storageSS, ranging
from 3×10⁻³(m−1) for plastic clay to 1.3×10⁻⁴(m−1) for dense sand (Freeze and Cherry, 1979).
The variable boundary conditions were provided using both Dirichlet and Neumann conditions. At the top (i.e., on the ground surface) a flux boundary condition equal to the rainfall infiltration capacity was applied; the runs enabled the infiltration rate to be defined step by step for each node of the domain. At the bottom (i.e., at the contact between the pyro-clastic cover and the bedrock) no flux was imposed, since the bedrock was assumed to be impervious.
Similarly, for the upslope, left side, a Neumann condition of no water flow was fixed, since the morphology of the ana-lyzed area reasonably leads to the hypothesis of coincidence between the surface and underground watershed. These con-tributions of fluxes from upstream may be assumed to be equal to zero. For the right-hand side of the downslope, along the morphological frames, two different boundary conditions were imposed using a Neumann or a Dirichlet condition de-pending on whether or not saturation occurred.
For the slope section shown in Fig. 7 the mesh was made up of 130 000 nodes, using regular quadrilaterals with lengths and heights, respectively, equal to 1x=0.20 m and 1z= 0.05 m.
The initial conditions were defined in a non-arbitrary way, thanks to the data provided by the tensiometers, which were located, as previously mentioned, very close to the selected study area. Such information was very useful for setting the initial conditions. Constant distribution suction throughout the domain was initially hypothesized by selecting the fol-lowing values:
ψ (x, z;t=0)=3;4;5;8;10;14 [kPa]. (12) By starting a simulation with no rain, a warm-up was per-formed for each of these values, in order to redistribute the water content all over the domain. The warm-up was stopped when the standard deviation values for each spa-tial node were less than 10−5[m]. The distribution thus ob-tained was considered as being representative of an equilib-rium condition.
[image:9.612.308.548.65.179.2]The profiles obtained were compared with the available in situ evidence recorded by tensiometers at the end of sum-mer, which were in considerable agreement with the warm-up results. By comparing these profiles, a strong similarity was evident with the distribution performed with9(x, z;t= 0)=6 kPA. This pore-water pressure distribution was set as the initial condition for simulating the evolution between 1 October 1997 and 5 May 1998.
Figure 8. Soil water characteristic curves.
4 Results and discussion
The period analyzed (from 1 October 1997 to 5 May 1998) was characterized by a total rainfall of 891 mm, with greater values of rainfall intensity having occurred between the end of October and December 1997.
Given the large extension of the domain investigated, the results presented refer to the conditions reached in two zones considered as representative of the domain: one in the ups-lope part, atZ=720 m a.s.l. (hereafter referred to as “sec-tion A”), the other at the toe of the slope, atZ=520 m a.s.l., (“section B”).
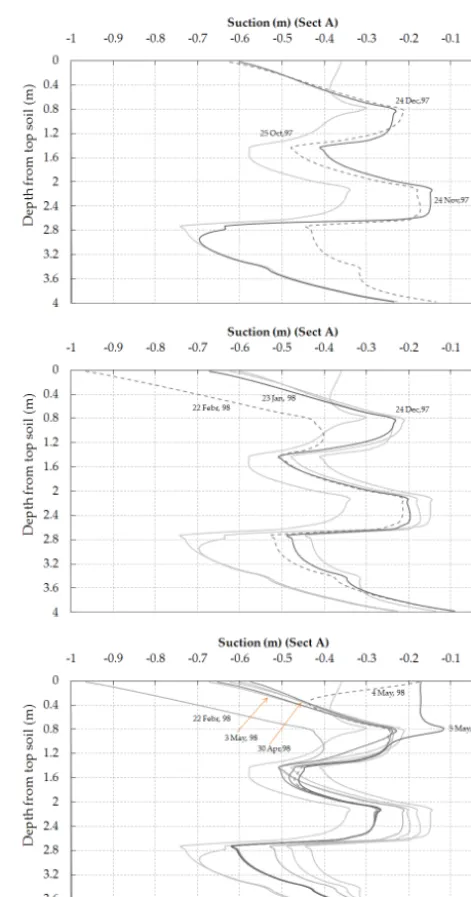
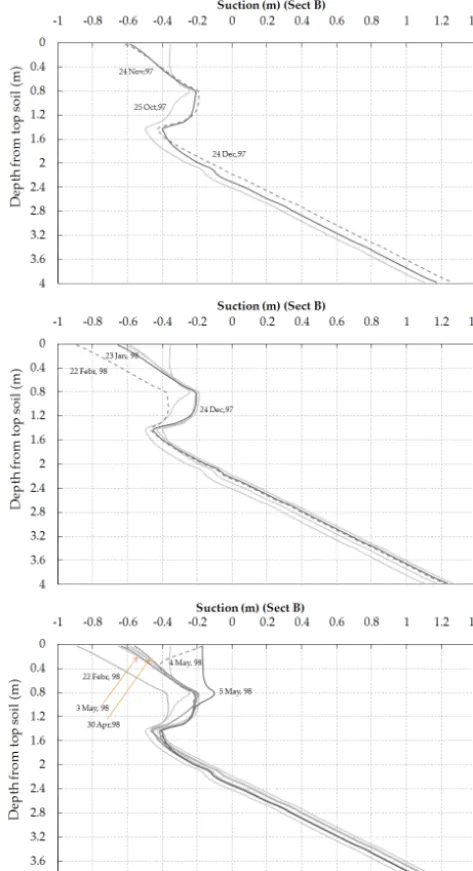
The temporal variations in suction profiles are given in Figs. 9 and 10 for sections A and B, respectively.
For the sake of clarity, in the two figures, the various com-puted suction profiles are not all plotted on the same graph. The upper panel shows the first three computed soil profiles, for around the end of October, November and December 1997. The middle panel shows another two profiles, evalu-ated around the end of January and February 1998. To let the reader compare the new profiles with the old ones, the latter are also plotted in the same panel in light gray. Finally, the bottom panel shows the suction profile computed on 3, 4 and 5 May 1998, during the rainfall event which led to a catas-trophic flowslide at the investigated slope. Also in this case, the previous suction profiles are plotted in light gray to help the reader follow the evolution of soil suction with time.
Figure 9 shows that no water table is ever computed along the upslope area (section A), since the values of the pressure head are always negative. This situation is consistent with the morphological characteristics of the investigated site, where the steepness of the slope prevents water from accumulating and lets it move through the layers towards the foot of the slope.
The situation is very different at the toe of the slope (sec-tion B, Fig. 10), where the lower layers soon reached sat-urated conditions, already in November 1997, much before May 1998. From the former date onwards, the lower layers remained saturated for the entire simulation period.
Table 3. Average values of pyroclastic soil properties.
Soil properties Topsoil Pumice (A) Paleosoil (B) Pumice (C) Paleosoil (D) Regolite (E)
Dry unit weight [kN m−3] 10.99 6 7 6 9 10.75
Saturated unit weight [kN m−3] 17.2 13 13 13 15 15.3
Saturated soil water contentθs 0.55 0.82 0.61 0.68 0.61 0.60
Residual soil water contentθr 0.14 0.23 0.18 0.05 0.18 0.10
Saturated hydraulic conductivityKs[m s−1] 3.2×10⁻⁵ 1.0×10⁻³ 1.0×10⁻⁶ 1.0×10⁻² 4.0×10⁻⁶ 7.6×10⁻⁷
Effective cohesionc0[kPa] 2 0 4.5 0 4.7 15
[image:10.612.310.546.208.657.2]Friction angleϕ0[◦] 15 30 24 32 28 21
Table 4. Parameters of van Genuchten and Nielsen model. The val-ues of the bubbling pressure, or air-entry tension, ψb, were de-termined through the graphic method proposed by Fredlund and Xing (1994).
Topsoil n=1.6;m=0.38 ψb=1.65 (kPa Layer A n=1.71;m=0.42 ψb=0.2 (kPa) Layer B n=1.66;m=0.40 ψb=2.5 (kPa) Layer C n=1.8;m=0.44 ψb=0.3 (kPa) Layer D n=1.9;m=0.47 ψb=2.5 (kPa) Layer E n=2;m=0.50 ψb=2.7 (kPa)
saturation of the underlying layers at the toe of the slope was clearly not the cause of the instability of the slope, although it contributed to it.
The suction values achieved on 5 May 1998 in the lower layers of the soil profile had been already predicted by the model for previous periods.
However, a big difference lies in the fact that, on 5 May 1998, the calculated vertical suction profiles of water content show high values, not far from saturation, in the upper layers as well.
The wetting front generated in early May by the rainfall in-filtration did not reach the lower layers and did not contribute to a further increase in pore-water pressure at these depths but led to the shallowest layers becoming close to saturation. This result is even clearer when analyzing the evolution of the pore pressure distribution along the slope throughout the considered period. Figure 11 shows the pore-water pressures evaluated at 3 and 0.7 m below the ground surface. The first depth is representative of the behavior of a relatively deep layer, which reaches saturation during the first months of the rainy season, while the second represents the conditions of the upper layers well.
In the lower layers (Fig. 11a), the pressure levels remain approximately the same with the rainfall in late April and early May, while it increases sharply in the upper layers (Fig. 11b) from 4 to 5 May.
Regarding the computed pore pressure, a slope stability analysis was carried out to simulate failure conditions and their relation to increasing soil water content.
[image:10.612.71.262.261.331.2]Figure 10. Computed suction profile for downslope section (Section B).
For several depths below the ground surface (0.3, 0.7, 1.8, 2.1, 2.9, 3.1 and 3.8 m), the average pore pressure was cal-culated, and the corresponding FS was estimated under the hypothesis of an infinite slope. This approach is the simplest limit equilibrium method and gives reliable results for slides where the longitudinal dimension prevails over the depth of the landslide, as with the landslide analyzed here.
The plots in Fig. 12 provide the time history of the sim-ulated FS values, which help in understanding the evolution of the slope stability conditions.
[image:11.612.48.285.71.507.2]The values in the lower layers are always indicative of sta-bility; lower values, but nevertheless above 1, are due to the greater thickness of the soil cover and to higher values of
Figure 11. Pore-water pressures performed at (a) 3 m and (b) 0.7 m below the ground surface.
Figure 12. Slope safety factor depending on pore-water pressures and soil mechanism properties at different depths from the ground surface.
pore-water pressure. By contrast, in the more superficial lay-ers the trends are more variable and show, at a depth of 0.7 m, a decrease in FS to 0.98, corresponding to instability condi-tions on 5 May, 1998.
5 Conclusions
[image:11.612.312.546.390.528.2]closely related to the ability to understand the dynamics of the underlying processes affecting the event.
The application reported here confirms how it is possible to approach the interpretation of a natural but complex and difficult event such as the triggering of a landslide, via simu-lation with physically based mathematical models.
The analysis outlined a possible interpretation of the Sarno landslides that could explain the triggering mechanisms oc-curring in May 1998. The model’s output suggests that the saturation of deep layers was not the only reason for slope instability, and that the reduction in suction across the shal-lowest layers may have been the actual cause of the triggering mechanism.
Monthly rainfalls occurring in April and May 1998, though not exceptional, were quite unusual for that period of the year. The rain occurring at the end of April caused the superficial layers to reach a high water content and, con-sequently, an increase in hydraulic conductivity. Thus, the heavy rainfall in the early days of May produced a steep wet-ting front which did not reach the deeper layers and consid-erably reduced the shear strength of the upper soil layers.
This interpretation is partly confirmed by the slope stabil-ity analysis, which reveals high values of the safety factor in the lower layers and values close to one in the upper layers with regard to the landslide date.
New applications to other cases occurring after May 1998 would certainly better define the critical conditions and could provide useful information for a possible early warning system.
Further analyses should be carried out in order to better evaluate the influence of the bedrock, of the road cuts located in the upper zone of the triggering areas and other factors that could have helped trigger the landslide.
By pursuing the overall objectives, the SUSHI model con-firmed its capacity to (i) simulate, with sufficient detail, the phenomena induced by rainfall in soils characterized by com-plex stratigraphy and hydraulic properties; (ii) achieve reli-able numerical solutions even when running very long sim-ulations, thus enabling antecedent rainfall to be taken into account, and (iii) provide a convincing interpretation of the phenomenon, without the need to introduce other hydrologi-cal forcing.
Edited by: R. Greco
References
Arnone, E., Noto, L. V., Lepore, C., and Bras, R. L.: Physically-based and distributed approach to analyze rainfall-triggered landslides at watershed scale, Geomorphology, 133, 121–131, doi:10.1016/j.geomorph.2011.03.019, 2011.
Baum, R. L., Savage, W. Z., and Godt, J. W.: TRIGRS – a FOR-TRAN program for transient rainfall infiltration and grid-based regional slope stability analysis, US Geological Survey Open-File Report, 02-0424, 2002.
Baum, R. L., Savage, W. Z., and Godt, J. W: TRIGRS-A For-tran program for For-transient rainfall infiltration and grid-based re-gional slope-stability analysis, version 2.0, US Geological Sur-vey Open-File Report 2008–1159, available at: http://pubs.usgs. gov/of/2008/1159/, 2008.
Caine, N.: The rainfall intensity-duration control of shallow land-slides and debris flows, Geogr. Ann. A, 62, 23–27, 1980. Calcaterra, D., Parise, M., Palma, B., and Pelella, L.: Multiple
de-bris flows in volcanoclastic materials mantling carbonate slopes, in: Proceedings of the 2nd International Conference on Debris-FIow Hazard Mitigation, Taipei, Taiwan, 16–18 July 2000, 99– 107, 2000.
Capparelli, G. and Tiranti, D.: Application of the MoniFLaIR early warning system for rainfall-induced landslides in the Piedmont region (Italy), Landslides, 7, 401–410, doi:10.1007/s10346-009-0189-9, 2010.
Capparelli, G. and Versace, P.: FLaIR and SUSHI: Two mathemati-cal models for Early Warning Systems for rainfall induced land-slides, Landland-slides, 8, 67–79, 2011.
Cascini, L. and Sorbino, G.: The contribution of soil suction mea-surements to the analysis of flowslide triggering, Invited Lecture, Proc. of the Int. Workshop “Flows 2003 – Occurrence and Mech-anisms of Flows in Natural Slopes and Earthfill”, Patron Editore, Sorrento, 77–86, 2004.
Cascini, L., Cuomo, S., and Guida, D.:Typical source areas of May 1998 flow-like mass movements in the Campania region, South-ern Italy, Eng. Geol., 96, 107–125, 2008.
Dhakal, A. S. and Sidle, R. C.: Pore water pressure assessment in a forest watershed: Simulations and distributed field measurements related to forest practices, Water Resour. Res., 40, W02405, doi:10.1029/2003WR002017, 2004.
Ellen, S. D. and Fleming, R. W.: Mobilization of debris flow from soil slips, San Francisco Bay region, California, Eng. Geol., 7, 31–40, 1987.
Fredlund, D. G. and Rahardjo, H.: Soil Mechanics for Unsaturated Soils, John Wiley & Sons, 1993.
Fredlund, D. G. and Xing, A.: Equations for the soil-water charac-teristic curve, Can. Geotech. J., 31, 521–532, 1994.
Freeze, R. A.: Mathematical models of hillslope hydrology, in: Hill-slope Hydrology, edited by: Kirkby, M. J., John Wiley & Son, 177–226, 1978.
Freeze, R. A. and Cherry, J. A.: Groundwater, Prentice Hall, Engle-wood Cliffs, New Jersey, 604 pp., 1979.
Glade, T.: Modelling landslide-triggering rainfalls in different re-gions in New Zealand – the soil water status model, Z. Geomor-phol., 122, 63–84, 2000.
Greco, R., Comegna, L., Damiano, E., Guida, A., Olivares, L., and Picarelli, L.: Hydrological modelling of a slope covered with shallow pyroclastic deposits from field monitoring data, Hy-drol. Earth Syst. Sci., 17, 4001–4013, doi:10.5194/hess-17-4001-2013, 2013.
Guzzetti, F.: Book Review of “Measuring Vulnerability to Natural Hazards”, Nat. Hazards Earth Syst. Sci., 8, p. 521, 2008. Iverson, R. M.: Landslide triggering by rain infiltration, Water
Re-sour. Res., 36, 1897–1910, 2000.
Mazzoleni, S., Strumia, S., Di Pasquale, G., Migliozzi, A., Amato, M., and Di Martino, P.: Il ruolo della vegetazione nelle frane di Quindici, in: L’instabilità delle coltri piroclastiche delle dorsali carbonatiche in Campania: primi risultati di uno studio interdis-ciplinare, 20 Rapporto informativo dell’Unità Operativa 4/21N del CNR/GNDCI, 1998 (in Italian).
McCord, J. T.: Application of second-type boundaries in unsatu-rated flow modeling, Water Resour. Res., 27, 3257–3260, 1991. Montgomery, D. R. and Dietrich, W. E.: A physically based model
topographic control on shallow landsliding, Water Resour. Res., 30, 1153–1171, 1994.
Revellino, P., Hungr, O., Guadagno, F. M., and Evans, S. G.: Veloc-ity and runout simulation of destructive debris flows and debris avalanches in pyroclastic deposits, Campania region, Italy, Envi-ron. Geol., 45, 295–311, 2004.
Rigon, R., Bertoldi, G., and Over, T. M.: GEOtop: A Distributed Hydrological Model with Coupled Water and Energy Budgets, J. Hydrometeorol., 7, 371–388, 2006.
Rolandi, G.: The eruptive history of Somma-Vesuvius, in: Volcan-ism and archeology in Mediterranean area, edited by: Cortini, M. and De Vivo, B., Research Signpost (Trivandrum), 77–88, 1997. Sirangelo, B. , Versace, P., and Capparelli, G.: Forwarning Model for Landslides Triggered by Rainfall Based on the Analysis of Historical Data File, IAHS Red Book, 278, 298–304, 2003.
Sorbino, G., Sica, C., and Cascini, L.: Susceptibility analysis of shallow landslides source areas using physically based models, Nat. Hazards, 53, 313–332, 2010.
Srivastava, R. and Yeh, T.-C. J.: Analytical Solution for One-Dimensional, Transient Infiltration towards the water table in ho-mogeneous and layered soils, Water Resour. Res., 27, 753–762, 1991.
Vanapalli, S. K., Fredlund, D. G., Pufahl, D. E., and Clifton, A. W.: Model for the prediction of shear strength with respect to soil suction, Can. Geotech. J., 33, 379–392, 1996.
van Genuchten, M. T. and Nielsen, D. R.: On describing and pre-dicting the hydraulic properties of unsaturated soils, Ann. Geo-phys., 3, 615–628, 1985,
http://www.ann-geophys.net/3/615/1985/.
van Westen, C. J., Rengers, N., and Soeters, R.: Use of geomor-phological information in indirect landslide susceptibility assess-ment, Nat. Hazards, 30, 399–419, 2003.
Vauclin, M., Khanji, D., and Vachaud, G.: Experimental and numer-ical study of a transient, two-dimensional unsaturated-saturated water table recharge problem, Water Resour. Res., 15, 1089– 1101, 1979.
Versace, P., Sirangelo, B., and Capparelli, G.: Forewarning model of landslides triggered by rainfall, in: Proceedings of Debris-flow Hazards mitigation: Mechanics, Prediction, and Assess-ment, Davos, Switzerland, 2, 1233–1244, 2003.