BEST ELECTRONIC SHOPPING TECHNIQUE (BEST) - AN ADHOC
COMPONENT USING BAT MODEL
K. R. Sekar, K. S. Ravichandran, SaiKishor Jangiti and J. Sethuraman School of Computing, SASTRA University, India
E-Mail:[email protected]
ABSTRACT
The rapid development of internet and technology made internet based virtual electronic shops come true. The moral stuff of online shopping is “Avail anything from anywhere at any time”. Online shopping paves a sophisticated way for customers to buy the commodity in less time. It helps the customers to know the feedback about the commodity that makes them to take corrective decisions. In addition to that, it serves the privacy to the customers as the traditional way does not suit this. Comparison shopping have emerged a new path to the online shopping. It assists the customers to compare the ‘N’ commodity simultaneously. However, umpteen number of online shops exists that makes a gap, since no website contribute adequate solution to meet the request of the customers about other aspects of commodity such as warranty, delivery days, review rating, quantity, EMI, COD, shipping cost, compare option etc. In this paper we are proposing BEST - Best Electronic Shopping Technique with a new model called TIM (Training Set - Interface - Model) which is imbibed, considering important attributes from top 20 popular sites to perform evaluation based on Crisp and Fuzzy methodologies. At the same time, details will be hunted and filtered by their demands and sorted them accordingly. Arrived results were obtained using variance, chi square, ANOVA and Theil indexing. As a consequence the customers will be able to yield commodity without spending more time and effort in visiting numerous number of sites.
Keywords: K-Medoid, fuzzy K-Means, Chi squared distribution, ANOVA classification, variance and theilindex. INTRODUCTION
A new way of shopping is emerging through e-commerce sites, which provides a new way of relationship between consumer and producer [1]. The entry of Electronic, Online and Virtual Shops in to world-wide-web, made us to visit more shops as well as compare same product in multiple shops in less time. Each online shop (website) has its own significance. The users can avail various services like educational, entertainment, marketing, banking, online shopping etc. Among them online shopping is inevitable and also more convenient to shopping with electronic money. Compared with normal shopping, online shopping attempts in collecting Product Review (Feedback) from customer during every purchase. These reviews were being published in online shops nearby each product to attract new customers for buying the products [2]. Review plays a vital role to impress the consumer towards online shopping [3]. In [4] they have highlighted that online shopping allows customer receive the product at their doorsteps, based on the association rule calculation is done. For example now, we will compare and purchase a Samsung Galaxy S3 mobile phone which is available in say, ‘N’ number of online shopping sites.
Our application recommends real worth purchase through online shopping. Thetraining set consists following attributes Product Price, warranty, replacement guarantee, delivery days, quantity, compare option, reviews, shipping charges, Equated Monthly Instalment (EMI) and Cash on Delivery are collected for probing the quality level of purchase. This data-set is modelled by inspiration of [5], where authors extracted Website Key Objects, using Semantic Web mining approach.
LITERATURE SURVEY
Legend-1
FM-Fuzzy Medoid, SWMA-Semantic Web Mining Approach, WI-Web Intelligence, DEA-Data Envelopment Analysis, RM- Regression Model, KNN- K-Nearest Neighbour, IOA- Iterative Optimization Algorithm, RMUL-Rule Mark Up Language, SOM-Shopping Optimization Model, MCDA- Multi Criteria Decision Analysis, FMDD- Fuzzy Clustering With Multi Medoid, FGM- Fuzzy Grey Method, FRECCA- Fuzzy Relational Eigen Vector Centrality based Clustering Algorithms, ARCA- Association Rule based Concept Lattice, SC-Spectral Clustering, KM-K-Medoid, ICO-Iterative Co-Clustering Algorithm, TSCM-Three Stage Clustering Method, MLFA-Multi Level Fuzzy Approach and ACO-Ant Colony Optimization.
Out of twenty reference papers, one paper deals with Data Envelopment Analysis where the data that were to be analyzed is summarized- Stortoet al. (2013). Two
papers deal with Regression Models which was used for evaluating Business strategies and also used for clustering purposes- Ganuet al.(2013) and Chen et al. (2013). One
paper deals with Shopping Optimization Model where the prices can be compared to find an optimum one- Chand et al. (2010). Decision making is a vital role and one paper deals with Multi Criteria Decision Analysis in evaluating the websites-Liu et al. (2011). For precise clustering Fuzzy
al. (2011). In order to make a successful comparison in
e-commerce websites Ant Colony Optimization was applied and better results were founded- Shao et al. (2010). Fuzzy
Grey Method was applied in one paper to analyze the websites and the results were Reliable- Zhazet al. (2012).
In the category of Other Methods, there were twelve papers. Intelligent Shopping Support, Association Rule, Multi-Level Fuzzy Approach, Testing the Design Quality, Semantic Web Mining Approach and Rule Mark-up
Language- Lim et al. (2011). All deal with testing and
evaluating the websites-Chiouet al. (2010), Lin et al.[2010], Velasquez et al.(2011), Liao et al. (2011) and
Zhaoet al. (2011).
Table-1.Literature comparison.
Authors DEA RM SOM MCDA FM FMDD ACO FGM Other method
Chiouet al. [2010] Hybrid approach
Lin et al. [2010] Intelligent shopping
support
Chandet al. [2010]
Wu et al. [2010] ICO, TSCM, K-Means Shaoet al. [2010]
Meiet al. [2011]
Liu et al. [2011]
Liao et al. [2011] Association rule
Zhao et al. [2011] MLFA
Lee et al. [2011] Social influence theory
Velasquez et al.
[2011] SWMA, WI
Lim et al. [2011] RMUL
Zhazet al. [2012]
Stortoet al. [2013]
Ganuet al. [2013] RM,KNN,IOA
Chen et al. [2013]
Bafnaet al. [2013] Mining
Cebiet al. [2013] Testing the design quality
Skabaret al. [2013] FRECCA, ARCA, SC, KM
Labrocheet al.
[2014]
Table-2.Technical comparison.
Authors DEA RM SOM MCDA FM FMDD ACO FGM Hybrid QoS Chiou
et al. Strategic Evaluation
[2010] Framework
Lin et al. Recommends Accuracy
[2010] Information
Chand
et al. Comparison CE
[2010]
Wu et al. UA PA
[2010]
Shao et
al. Ecommerce OS
[2010]
Comparison
Mei et al. Effective Efficiency
[2011]
Clustering
Liu et al. Website Scaling
[2011]
Evaluation
Liao
et al. Mining PA
Customers
[2011]
Knowledge
Zhao et
al. Evaluating Reliability
[2011]
Customers
Value
Lee et al. Analyzing DA [2011]
Social
Influence
Velasquez Handles key PA
et
al.[2011] Objects in
Websites
Lim et al. Rule based Reliability
[2011]
Comparison
Zhazet al. Website Reliability
[2012] Analysis
Stortoet
al. Evaluating Efficiency
Ecommerce [2013] Ecommerce
Ganuet al. Improves Scaling
[2013]
Prediction
Quality
Chen et
al. Preference Priority
based
[2013]
Clustering
Bafnaet
al. Mining 92% EA
[2013]
Review of 80% DA
Customers
Cebiet al. Quality Accuracy [2013]
Skabaret
al. Text IO
[2013]
Clustering
Labroche Precise Evaluation
et al.
[2014] Clustering
Legend-2
OS-Optimal Solution, IO-Interoperability, CE-Cost Effective, UA-User Analysis, EA-Effective Accuracy, DA-Detection Accuracy and PA-Predictive Accuracy.
Out of the twenty papers, most of the papers deal with analyzing- Zhazet al. [2012] and evaluating the
websites-Liu et al. [2011], extracting key objects from the
websites- Velasquez et al. [2011]. Many methodologies were applied to analyze the difference between various websites. E-commerce websites were also analyzed- Stortoet al. [2013]. In some cases review of the customers
were taken into account, Zhao et al. [2011], and preference based clustering were applied to obtain optimum results. Mining techniques were also applied to summarize the data that has been obtained as a review by the customers- Bafnaet al. [2013]. Social influence on these websites was
also analyzed in one paper- Lee et al. [2011] and accuracy
was good. Rule based comparison was done using Rule Mark-up Language and the results were Reliable- Lim et
al.[2011]. In one paper User Analysis- Wu et al. [2012],
about websites was presented and their Predictive Accuracy was high.
Section 2 explores Proposed Methodologies. Section 3 exhibits Results and Discussions, Section 4 describes Conclusion, Section 5 includes Acknowledgment and Section 6 presents Reference.
PROPOSED METHODOLOGY
We have chosen a BAT (Budget - Actuals -Theil Indexing) model for BEST (Best Electronic Shopping Technique), which recommends customer an online shop to purchase the product. When a customer is confused to choose an online shop among the multiple alternatives i.e., when several shops offering same product with some significant offers and hence it is possible to confuse the customer. Our technique helps and resolves the problem of purchasing the product from the best online shop. Our BAT model architecture is depicted below in Figure-1.
Figure-1.Architectural framework BAT Model - (Budget - Actual -Theil Indexing).
Dataset collection
Here we have taken a case of a customer in India, who is specific to purchase a mobile phone of make
“Samsung Galaxy S5”. In the process of developing a good data-set, we have applied Theil indexing on the available attributes for finding the attribute-purity-level.
Table-3. Distributed measures strategy.
Attribute Percentile value calculation Warranty Percentile relative to maximum value
Price Percentile relative to minimum value Replacement guarantee Percentile relative to maximum value Delivery in days Percentile relative to minimum value Quantity Percentile relative to maximum value Compare Binary (1-Yes, 0-No ) Shipping Binary (1-Yes, 0-No ) EMI Binary (1-Yes, 0-No ) Cash on delivery Binary (1-Yes, 0-No )
Review Percentage of customers reviewed
Theil Indexing
Preprocessing
Dataset Distributed
Measures Normalization
Budget
K‐Medoid Actuals
Fuzzy K‐Means Actuals
Variance Chi Square
Table-4. Distributed measures.
Sites
Warr
anty in %
Pri
ce
Rs. In
% Rep lace Gu aran tee in % Del iv ery d a ys in % Quan tity in % Co mp a re Sh ippin g EM I CO D Rev iew i n % To ta l T o tal in % Cl a ss
Flipkart 100 84 100 33 25 1 0 1 1 32.3 377.9 72.4 Excellent Ebay 100 100 100 100 100 0 1 1 0 20 522 100 Excellent Infibeam 100 88 100 33 9.3 0 1 1 1 30 330.9 63.4 Good
Amazon 100 86 33 25 25 0 1 0 1 46.6 317.6 60.9 Good IndiaTimes 100 84 10 17 8.3 0 1 1 1 40 262.2 50.2 Satisfactory
Snapdeal 100 89 23 33 8.3 1 1 1 1 31.6 289.2 55.4 Satisfactory
Tradus 100 85 23 50 8.3 0 1 1 1 20 290 55.6 Good
Gadgets 100 75 6.7 20 100 1 0 1 0 20 323.9 62 Good ITstore 100 92 50 6.7 100 1 0 0 0 34.3 383.5 73.5 Excellent GadgetsGuru 100 84 3.3 14 25 1 1 0 1 20 249.8 47.9 Fair
Ezoneonline 100 84 10 13 33 1 1 0 1 0 243.1 46.6 Fair Gobol 50 99 23 14 100 0 1 1 1 0 289.1 55.4 Satisfactory Samsung India 100 83 33 33 8.3 0 1 1 1 0 260.5 49.9 Fair
Univercell - 84 6.7 14 100 1 1 0 0 0 207.2 39.7 Fair Cromaretail - 84 50 14 100 1 1 1 1 20 272.5 52.2 Satisfactory Maniac Store 100 75 3.3 33 100 0 1 1 1 0 314.6 60.3 Good
Shopclues 100 81 33 14 100 0 1 1 1 41.7 372.9 71.4 Excellent Homeshop18 100 86 6.7 33 8.3 0 1 1 1 30.7 267.7 51.3 Satisfactory
Greendust 100 85 50 8.3 33 0 1 0 1 0 278.2 53.3 Satisfactory Themobilestore 100 84 23 33 9.3 0 1 1 1 25 278.2 53.3 Satisfactory
Table-4 represents a training data set in distributed measure pattern. The measures are enforced to make all the awkward data to a form which is very much appreciative and fruitful for evaluation purposes. Before applying clustering algorithms, the initial step need to be performed is distributed measure.
Normalization
Among the 10 pure attributes, there is a multi-valued attribute “Review - Rating Star” varying from 1 to 5 which is normalized by percentage. Consider the service of flipkat which is rated as follows {{5, 1223}, {4, 286}, {3, 102}, {2, 54}, {1, 313}}, where {5,1223} represents that the rating 5 is given by 1223 people.
Review - Rating in % = (100*1223 + 80*286 + 60*102+40*54+20*313)/(1223 + 286 + 102+54+313).
Table-5. Normalization of a multi-valued attribute.
Online shops Warran ty in % Rs. In % Re p la ce Gu aran tee i n % D elive ry da y
s in
%
Quan
tity in %
Co m p a re Sh ip pi n g EMI COD Rev iew i n % Budget
IndiaTimes 0.4 0.3 0 0.1 0 0 0 0 0 0.15 Satisfactory Snapdeal 0.3 0.3 0.1 0.1 0 0 0 0 0 0.1 Satisfactory
Tradus 0.3 0.3 0.1 0.3 0 0 0 0 0 0.05 Good Gadgets 0.3 0.2 0 0.1 0.3 0 0 0 0 0.06 Good
ITstore 0.3 0.2 0.1 0 0.3 0 0 0 0 0.08 Excellent GadgetsGuru 0.4 0.3 0 0.1 0.1 0 0 0 0 0.08 Fair
Ezoneonline 0.4 0.3 0 0.1 0.1 0 0 0 0 0 Fair Gobol 0.2 0.3 0.1 0 0.3 0 0 0 0 0 Satisfactory Samsung India 0.4 0.3 0.1 0.1 0 0 0 0 0 0 Fair
Univercell - 0.4 0 0.1 0.5 0 0 0 0 0 Fair Cromaretail - 0.3 0.2 0.1 0.4 0 0 0 0 0.07 Satisfactory Maniac Store 0.3 0.2 0 0.1 0.3 0 0 0 0 0 Good
Shopclues 0.3 0.2 0.1 0 0.3 0 0 0 0 0.09 Excellent Homeshop18 0.4 0.3 0 0.1 0 0 0 0 0 0.11 Satisfactory
Greendust 0.4 0.3 0.2 0 0.1 0 0 0 0 0 Satisfactory Themobilestore 0.4 0.3 0.1 0.1 0 0 0 0 0 0.44 Satisfactory
Theil indexing
The purity of the attributes is calculated using theil index method, to test whether the attributes considered for evaluation of best online shop are appropriate or not.
The mean value for each attribute column in the data set is calculated, referred as mean(Ai), where Ai is the
attribute in ith column
Now Theil(Ai)Ti = 1/ n ∑ (Ai)/mean(Ai) Logn (Ai)/
mean (Ai) where ∑ i= 1 to n, n= total items,
For example the entropy value is Te= 1.3010.
Find the Entropy difference for each attribute Ei= Te
-Ti , Te = Entropy,
Here, the Entropy difference of each attribute helps us to find out the purity level of that attribute. If the Entropy Difference is approximately zero, then purity level of that attribute is high, by using this we have considered only 10 pure attributes for determining an online shop to purchase a mobile phone. We have collected 10 attributes from 20 online shops one example row is shown in Table-6.
Table-6. Sample row of theil indexing.
Site name Warranty Price
Replacement guarantee
(in days)
Delivery
(in days) Quantity Compare
Shipping charge (in Rs.) Flipkart.com 12 24899 1 to 30 2 to 3 1 to 999 Yes 0
K-Medoid
K-Medoid algorithm forecasts cluster data points according to their pair wise similarity [], It uses the centroid concept to form the clusters. Here we considered eight centroids to cluster, namely ELOW- Excellent LOW, EHIGH- Excellent HIGH, GLOW- Good LOW, GHIGH- Good HIGH, SLOW- Satisfactory LOW, SHIGH- Satisfactory HIGH, FLOW- Fair LOW and FHIGH- Fair HIGH. The centroid is the data point from where the clusters are formed. It exploits Manhattan distance to find the cost between data points and centroid. Among the cost values, minimum cost is identified to construct clusters. The Manhattan distance formula to calculate the cost is Cost(x,c) = ∑ | xi – ci |, x= Data points, c = Centroid.
The clustering algorithm of K-Medoid is as follows:
a) Identify data points (n) and centroid (k) where n>k. b) Compute the cost or distance between centroid and
data point using the Manhattan distance.
c) Compare and find the minimum distance among all distance for each data point.
d) Cluster the data point to the centroid where the distance is less.
e) Repeat the steps 2 to 4 until there are no data points.
values for all data points and the centroids which is shown
in Table-5.The outcome of this step helps us to measure ‘Actuals’ verses ‘Budget’.
Table-7. K-Medoid cost comparison.
S. No. Online shops ELOW GLOW SLOW FLOW EHIGH GHIGH SHIGH FHIGH MINIMUM
1 Flipkart 0 0.01 0.01 0.003 0.034 0.194 0.353 0.516 0.003 2 Ebay 0.034 0.134 0.044 0.004 0 0.16 0.319 0.018 0 3 Infibeam 0.194 0.204 0.204 0.191 0.16 0 0.159 0.223 0 4 Amazon 0.01 0 0.01 0.013 0.044 0.204 0.363 0.026 0 5 IndiaTimes 0.013 0.013 0.023 0.01 0.021 0.181 0.34 0.003 0.003 6 Snapdeal 0.004 0.096 0.006 0.007 0.038 0.198 0.357 0.02 0.004 7 Tradus 0.003 0.013 0.013 0 0.131 0.191 0.35 0.013 0 8 Gadgets 0.01 0.02 0.02 0.034 0.024 0.157 0.343 0.006 0.006 9 ITstore 0.006 0.016 0.016 0.003 0.028 0.188 0.347 0.01 0.003 10 GadgetsGuru 0.016 0.026 0.026 0.013 0.018 0.118 0.337 0 0 11 Ezoneonline 0.456 0.026 0.026 0.013 0.018 0.178 0.337 0 0 12 Gobol 0.013 0.023 0.023 0.01 0.021 0.181 0.06 0.003 0.003 13 Samsung India 0.003 0.003 0.013 0 0.031 0.191 0.35 0.013 0 14 Univercell 0.348 0.022 0.022 0.009 0.022 0.182 0.341 0.0039 0.0039 15 Cromaretail 0.006 0.016 0.316 0.003 0.028 0.188 0.347 0.01 0.003 16 Maniac Store 0.009 0.001 0.001 0.012 0.043 0.203 0.362 0.065 0.001 17 Shopclues 0.003 0.076 0.013 0 0.031 0.191 0.35 0.013 0 18 Homeshop18 0.003 0.003 0.013 0 0.031 0.191 0.26 0.013 0 19 Greendust 0.28 0.01 0 0.013 0.044 0.204 0.363 0.026 0 20 Themobilestore 0.353 0.363 0.363 0.35 0.319 0.541 0 0.337 0
Figure-2.K-Medoid chart.
Fuzzy K-Means
Fuzzy K-Means is a soft computing technique and here it is used as another methodology to compare the budget results. In [15], the authors applied fuzzy K-Means to develop a Credibility Model for websites; here we have used the same technique for finding the best online shop. Customer understanding capability about commodity and business can be efficiently evaluated by using fuzzy Logic [19]. Fuzzy K-Means can be applied even if data points
belong to more than one cluster and each point has a set of membership levels. The membership level indicates the weightage given to the data elements by the centroid. The data element moves to the cluster where the membership degree is high rather than using the distance to form clusters. The Euclidean distance formula to calculate the cost is, Distance(x,c) = (∑ (x – c)2)1/2,The membership is
given by X (C1) = ( 1/dij )1/m-1 / (1/(∑ (dij)),
The clustering algorithm of Fuzzy K-Means is as follows:
a) Generate k clusters and determine the cluster center.
b) Calculate the Euclidean distance between the centroid and data points.
c) Find the membership degree for each data point and the cluster.
e) Repeat the steps 2 and 4 until there are no data points.
For example, the value of cost between fair low centroid and the flipkart data point is.
i.e., cost (flipkart, fair low) = [(0.26-0.38)2 + (0.22-0.31)2
+ (0.26-0.12) 2 + (0.08-0.12) 2 + (0.06-0.03) 2 + (0.002-0) 2
+ (0-0.003) 2 + (0.002-0.003) 2 + (0.002-0.003) 2 + (0.08-0) 2] = 0.225,
The value of membership is calculated as x(c1) = [(1/ 0.225)1/2-1 / (1/ 5.263)] = 23.305, In a similar way,
calculate the cost values for all data points and the centroids. Table-7 shows the classes anticipated by using this clustering.
Figure-3. Fuzzy K-Means result.
Variance
Variance helps in determining whether our ‘Budget’ and ‘Actuals’ are identical or not, a zero variance indicates that they are identical and a zero variance is a rare occurrence in eventual practice. To analyze the fluctuations from the outcomes of medoid and Fuzzy K-means techniques, the variance approach is used. The formula for acquiring variance is ∑ (xi- )2/ N. The
variance accomplished for K-Medoid is 3.83% and for Fuzzy K-Means is 13.83%.
Table-8. Comparisonof values.
Site name K-Medoid
classes
Fuzzy K-Means
classes Site name K-Medoid classes
Fuzzy K-Means classes
Flipkart Fair Excellent Ezoneonline Fair Fair
Ebay Excellent Excellent Gobol Fair Excellent
Infibeam Good Good Samsung India Fair Fair
Amazon Good Good Univercell Fair Excellent
Indiatimes Fair Fair Cromaretail Fair Excellent
Snapdeal Excellent Good Maniacstore Good Excellent
Tradus Fair Fair Shopclues Fair Excellent
Gadgets Fair Excellent Homeshop18 Fair Fair
Itstore Fair Excellent Greendust Satisfactory Satisfactory Gadgetsguru Fair Fair Themobilestore Satisfactory Satisfactory
Chi-square
The chi-square distribution is used for goodness of fit of an observed distribution to a theoretical one i.e., to compute the significant difference between ‘Actuals’ with ‘Budget’. It examines the distribution of frequencies by
hypothesis testing. The hypothesis is H0: Equally
distributed Frequencies. H1: Frequencies which are not
equally distributed. For the hypothesis testing, observed and expected frequencies are essential. The observed frequencies are shown in Table-9.
Table-9. Observed frequencies.
Methodology Excellent Good Satisfactory Fair TOTAL
K-Medoid 2 3 13 2 20
Fuzzy
K-Means 9 3 6 2 20
From the observed frequencies, expected is computed by using the formula. Table-9 shows the expected values. The expected values are calculated by using the formula. Expected (E) = [(Row Total * Column Total) / Grand Total] Then expected value for K-Medoid excellent class the value is k-medoid = [(Excellent total * K-Medoid total) / Grand total] i.e., Expected(E) = (11* 20) /40 = 5.5, similarly compute the expected values for the remaining values depicted in Table-9. Table-9 depicts the frequencies of the methodologies used.
Table-10. Expected frequencies E-Excellent G-Good S-Satisfactory F-Fair.
Methodology E G S F
K-Medoid 5.5 3 9.5 2
Fuzzy k-means 5.5 3 9.5 2
Once the observed and expected values are computed, the hypothesis testing is done by using the formula. X2 = ∑[(Observed-Expected)2] / Expected i.e., for
the first row, the calculations are (2-5.5)2 /5.5 = 2.227,
[image:9.612.75.298.258.307.2]Table-10 shows the calculated chi-square estimates.
Table-11. Chi-square (X2) table O - observed value E -
expected value df = k-1 = 8 - 1 = 7.
O E (O-E) (O-E)2 (O-E)2/E
2 5.5 -3.5 12.25 2.227
3 3 0 0 0
13 9.5 3.5 12.25 1.289
2 2 0 0 0
9 5.5 3.5 12.25 2.227
3 3 0 0 0
6 9.5 -3.5 12.25 1.289
2 2 0 0 0
X2 =7.032
The level of significance claimed is 0.05level. The next phase is to determine chi square table value. The table value is 14.07. Since 7.032<14.07 the hypothesis H0
is accepted.
ANOVA classification
To prove the above stated hypothesis, the next statistical evaluation test adapted is ANOVA (Analysis of Variance). It utilizes two variables called independent and dependent variables. Two types of ANOVA used here are: ANOVA I way classification, ANOVA II way classification.
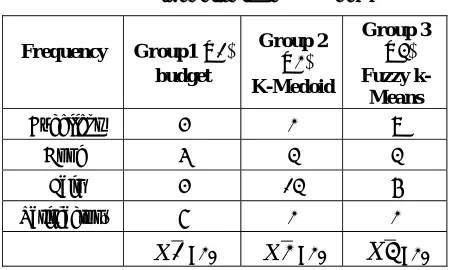
ANOVA I way classification: It uses frequency as an independent variable to gauge the hypothesis. The dependent variable is the outcome obtained from the independent variable. Table-11 shows the three different groups of data. The mean values for each group of frequencies are calculated for further manipulations. The grand mean gives the total mean value for the frequencies used.
Table-12. Three different groups of data.
Frequency Group1(X1) budget
Group 2 (X2) K-Medoid
Group 3 (X3) Fuzzy
k-Means
Excellent 4 2 9
Good 5 3 3 Fair 4 13 6
Satisfactory 7 2 2
1
X
=20X
2
=20X
3
=20SS is subdivided into Within (SSW) and Between (SSB) classes.
SSB = 4(5-5)2 + 4(5-5)2+ 4(5-5)2 = 0
SSW = ∑ (
X
-X
i)2 i.e., SSW for the group1 =(5 - 4)2 + (5 - 5)2 + (5 - 4)2 + (5 - 7)2 = 6
Likewise SSW for group2 is 86 and SSW for group2 is 30. MS is subdivided into Within (MSW) and Between (MSB) classes. MSB is obtained by dividing SSB with total number of groups minus one. The formula is MSB = SSB / k-1, where k= number of groups i.e., MSB = 0, MSW is obtained by dividing SSW with total number of items minus total number of groups. The formula used is MSW = MSB / n-k i.e., MSW = 0
F-Ratio: It is the process of computing SSW, SSB, MSW and MSB to obtain the value of Ratio. F-Ratio gives the ratio of MSB and MSW. F-F-Ratio = MSB / MSW i.e., F-Ratio = 0. The calculated values of ANOVA are shown in Table-13.
Table-13. ANOVA Table, SS - Sum of Square, DF - Degrees of Freedom, MS - Mean Square.
Source SS DF MS F-Ratio
Between 0 2 0 0 Within 122 9 13.5
[image:9.612.73.297.411.571.2]ANOVA II-way classification
In order to understand the dependence between the variables II-way analysis is performed which uses two independent variables i.e., Actuals-Budget and Methodology (K-Medoid, Fuzzy K-Means). Here the dependent variable is the outcome attained from the independent variable.
Table-14. Frequencies of two independent variables.
Methods Actuals Budget Mean
K-Medoid X1=2,3,13,2
1
X
=5X2=4,5,4,7
2
X
=5 5Fuzzy K- means
X3=9,3,6,2
3
X
=5X4=4,5,4,7
4
X
=5 5Mean 5 5 5
Degree of Freedom (df) of ‘Actuals’ - ‘Budget’ = b-1 = 2-1 = 1, where b is the total number of groups of another independent variable.
SS (Methodology): Sum of Squares for methodology is calculated by SS = 4 * 2 * [5)2 + (5-5)2] = 0
SS(Actuals-Budget): Sum of Squares for Actuals-Budget = 4 * 2 * [(5-5)2 + (5 -5)2] = 4 * 2 * 0 * 0
= 0
SS (Interaction): Sum of Squares for interaction of methodologies and Actuals, budget is
SS (Methodologies * Actuals-Budget) = 0 SSW: Sum of Square Within is calculated i.e., SSW = 128
MS: Mean Square values are calculated by
F-Test
Table-15. ANOVA II way test.
Source DF SS MS F-Ratio
Methodologies (A) 1 0 0 0 Actuals-Budget
(B) 1 0 0 0
A * B 1 0 0 0
Within 12 128 10.7
RESULT AND DISCUSSIONS
In the preprocessing stage, we applied Distributed Measures and Normalization technique in order to eliminate the disorder in the Input dataset, which leads to find the Decision Variables and it, is so called ‘Budget’. Purity Level of each attribute is measured through Theil Indexing to filter irrelevant attributes. It is time to validate ‘Budget’ using K-Medoid and fuzzy K-Means data clustering methodologies referred to as ‘Actuals’. Through Variance it is possible to check whether there is a difference between our ‘Budget’ and ‘Actuals’. We observed a variance of 3.83% between ‘Budget’ versus ‘Actual K-Medoid’ and 13.83% from ‘Budget’ to ‘Actual Fuzzy K-Means’. So, K-Medoid has got less variance with respect to Budget supporting the statement K-Medoid is better concerned to variance. Chi-Square distribution for Budget and Actuals resulted a value of 7.03, which is less than the Chi-square table value 14.07, leading to acceptance of distribution. ANOVA I-way and II-way were calculated as ‘0’ which is less than the ANOVA table
value 19.38 and 4.75 respectively. Thus the empirical study shows that the distribution is accepted.
CONCLUSIONS
Our main dedication and focus is on reputed online shopping websites. In this paper, we have introduced a novel approach for enhancing the evaluation of a commodity. This approach pretends to assist prosperity for the customers while procuring the commodity. Thus based on the study, mining technologies and statistical measures are the inevitable and indisposable yard sticks for gauging any application programming interface (API). In the evaluation of website key objects in websites makes it possible to arrive with more or less good accurate answers through the study from variance analysis in terms with Budget vs actual. Different types like crisp and fuzzy has been fortified and measures taken widely and deeply through the meticulous ideology. In addition, chi squared distribution and Anova classification techniques have also been reinforced to attain a good significant outcome in evaluation. Thus, the experimental result shows the efficacy and efficiency in contrast with conventional site evaluation. Therefore, this project eventually had a good measuring ornaments and adornments to acquire a good piece of knowledge for further employment.
ACKNOWLEDGEMENT
REFERENCES
[1] Wen-Shan lin, Nathalie Cassaigne, Tzung - Cheng Huan. 2010. A framework of online shopping support for information recommendations. Expert systems with applications. 37: 6874-6884.
[2] GayatreeGanu, YogeshKakodkar, Amelie Marian. 2013. Improving the quality of predictions using textual information in online user reviews, Information Systems. 38(1): 1- 15.
[3] Matthew K.O. Leea,b, Na Shi a, Christy M.K. Cheungc, Kai H. Limb, Choon Ling Sia b. 2011. Consumer’s decision to shop online: The moderating role of positiveinformational social influence, Elsevier, Information and Management. 48: 185-191.
[4] Shu-hsien Liao, Yin-ju Chen, Yi-tsun Lin. 2011. Mining customer knowledge to implement online shopping and home delivery for hypermarkets, Elsevier. 38: 3982-3991.
[5] Juan D.Velasquez, Luis E.Dujovne, Gaston L’ Huiller. 2011. Extracting Significant Website Key Objects: A semantic web mining approach, Engineering Applications of Artificial Intelligence. 24(8): 1532-1541.
[6] Sekukcebi. 2013. A quality evaluation model for the design quality of online shopping websites.Electronic Commerce Research and Application. 12(2): 124- 135.
[7] Gyoo Gun Lim, Ju Young Kang, Jae Kyu Lee, Daechul Lee. 2011. Rule based personalized comparison shopping including delivery cost.Electronic Commerce Research and Applications. pp. 637-649.
[8] Yong Sik Chang, Kyoung Jun Lee. 2010. A Comparison shopping optimization model based on supplier’s pricing contexts.Expert systems with Applications. pp. 5736-5744.
[9] Liyang Liu and Simon Fong. 2011. Evaluation of E-Commerce websites by Multi-Criteria Decision Analysis. IADIS International Conference e-society.
[10] Nicolas Labroche. 2013. Online fuzzy medoid based clustering algorithm, Neurocomputing.pp. 141-150.
[11] Jian - Ping Mei, Lihuichen. 2011. Fuzzy relational clustering around medoids: A Unified View.Fuzzy Sets and Systems.pp. 44-56.
[12] Wen-chihChiou, Chin -chaolin, ChyuanPerng. 2010. A Strategic framework for website evaluation based on review of the literature from 1995-2006. Information and Management. 47: 282-290.
[13] Kang Shao and Ye Cheng. 2010. E-Commerce Comparison-Shopping Model of Neural Network Based on Ant Colony Optimization.Advances in Wireless Networks and Information SystemsLecture Notes in Electrical Engineering. 72: 397-404.
[14] Lichen, Feng Wang. 2013. Preference based clustering reviews for augmenting e-commerce recommendation. Knowledge-Based Systems. 50: 44-59.
[15] Ling Wang, Hongshuai Wang,Hongying Zhao. 2012. E-Commerce Website Credible Model based on Fuzzy Grey Method.Computer Science and Automation Engineering (CSAE), IEEE International Conference on.3: 769-772.
[16] Skabar. A, Abdalgader K. 2013. Clustering Sentence-Level Text Using a Novel Fuzzy Relational Clustering Algorithm.IEEE Transactions on knowledge and data engineering. 25(1):62-75.
[17] KushalBafna, DurgaToshniwal. 2013. Feature based summarization of customer’s Reviews of online Products. Procedia Computer Science. 22: 164-171.
[18] Meng-Lun Wu, Chia Hui Chang, RuiZhe Liu, Teng-Kai Fan. 2010.Aggregate two way co-clustering of ads and user analysis for online advertisements, Computer Symposium (ICS),IEEE. pp. 587-593.
[19] Dan Zhao. 2011. Evaluating Customer perceived value of Busineess to Conusumer websites from the aspect of online consumers. Business Intelligence and Financial Engineering (BIFE),IEEE. pp. 235-238.