Nutrition Theses Department of Nutrition
Summer 7-6-2012
Demographic, Dietary, and Lifestyle Determinants of Vitamin D
Demographic, Dietary, and Lifestyle Determinants of Vitamin D
Status in the US Population: National Health and Nutrition
Status in the US Population: National Health and Nutrition
Examination Survey, 2005-2006
Examination Survey, 2005-2006
Shalini PatelGeorgia State University
Follow this and additional works at: https://scholarworks.gsu.edu/nutrition_theses
Recommended Citation Recommended Citation
Patel, Shalini, "Demographic, Dietary, and Lifestyle Determinants of Vitamin D Status in the US Population: National Health and Nutrition Examination Survey, 2005-2006." Thesis, Georgia State University, 2012. https://scholarworks.gsu.edu/nutrition_theses/37
This Thesis is brought to you for free and open access by the Department of Nutrition at ScholarWorks @ Georgia State University. It has been accepted for inclusion in Nutrition Theses by an authorized administrator of
This thesis, DEMOGRAPHIC, DIETARY, AND LIFESTYLE DETERMINANTS OF VITAMIN D STATUS IN THE U.S. POPULATION: NATIONAL HEALTH AND NUTRITION EXAMINATION SURVEY, 2005-2006, by Shalini Patel, was prepared
under the direction of the Master’s Thesis Advisory Committee. It is accepted by the committee members in partial fulfillment of the requirements for the Master of Science in
the Byrdine F. Lewis School of Nursing and Health Professions, Georgia State University. The Master’s Thesis Committee, as representatives of the faculty, certify that
this thesis has met all standards of excellence and scholarship as determined by the faculty.
By
Shalini Patel
_________________________ _________________________ Meera Penumetcha, PhD, RD Elena Kuklina, MD, PhD Committee Chair Committee Member
_________________________ Anita Nucci, PhD, MPH, RD, LD Committee Member
In presenting this thesis as partial fulfillment of the requirements for an advanced degree from Georgia State University, I agree that the library of the university will make it available for inspection and circulation in accordance with its regulations governing materials of this type. I agree that permission to quote from, to copy from, or to publish from this thesis may be granted by the professor under whose direction it was written, by
the Byrdine F. Lewis School of Nursing and Health Professions director of graduate studies and research, or by me. Such quoting, copying, or publishing must be solely for scholarly purposes and will not involve potential financial gain. It is understood that any copying from or publication of this thesis that involves potential financial gain will not be
allowed without my written permission.
All theses deposited in the Georgia State University library must be used in accordance with the stipulations prescribed by the author in the preceding statement. The author of
this thesis is:
Shalini Patel 5013 Chapel Crossing Douglasville, Georgia 30135
The director of this thesis is:
Meera Penumetcha, PhD, RD Assistant Professor Division of Nutrition
Byrdine F. Lewis School of Nursing and Health Professions Georgia State University
SHALINI PATEL
ADDRESS:
5013 Chapel Crossing Douglasville, Georgia 30135
EDUCATION:
Master of Science in Health Sciences Major Nutrition
Georgia State University
Bachelor of Science in Family and Consumer Sciences Major Dietetics
University of Georgia
PROFESSIONAL EXPERIENCE:
Dietetic Internship Division of Nutrition Georgia State University
Graduate Teaching Assistant Division of Nutrition
Georgia State University
Graduate Teaching Assistant Division of Kinesiology and Health Georgia State University
PROFESSIONAL AFFILIATIONS:
DEMOGRAPHIC, DIETARY, AND LIFESTYLE DETERMINANTS OF VITAMIN D STATUS IN THE U.S. POPULATION: NATIONAL HEALTH AND NUTRITION
EXAMINATION SURVEY, 2005-2006
by
SHALINI PATEL
Background: Determinants of vitamin D status are of interest when studying the
epidemiology of disease in population groups because vitamin D is now recognized to
decrease the risk of diseases such as osteoporosis, cancer, and cardiovascular disease.
Understanding modifiable determinants of vitamin D status are important for managing
vitamin D deficiency at the individual level and for addressing this issue at population
level.
Objective: The objective of this study was to evaluate the associations between serum
vitamin D status (deficiency and insufficiency) and distinct demographic, dietary, and
lifestyle characteristics of adults in the United States using a large, nationally
representative sample survey, the National Health and Nutrition Examination Survey
(NHANES) 2005-2006.
Methods: The study sample consisted of 2340 adults aged 20-59 who had serum
25(OH)D measured and who had completed various questionnaires concerning dietary
intake of vitamin D and other lifestyle factors. Multivariate logistic regression was used
Results: The prevalence of vitamin D deficiency was higher in obese adults than in
underweight to normal weight adults (50.9% ± 4.57 vs. 29.3% ± 3.57), higher in adults
who reported no sunburns than in adults who reported ≥ 3 sunburns (49.9% ± 3.82 vs.
18.0% ± 3.07), and higher in adults who use sun protective measures regularly than in
adults who do not (48.4% ± 3.93 vs. 27.0% ± 3.75). The prevalence of vitamin D
deficiency increased as dietary intake of vitamin D decreased. Non-Hispanic black adults
were significantly more likely to be vitamin D deficient (OR = 45.27, 95% CI =
17.27-118.64) and insufficient (OR = 9.37, 95% CI = 3.43-25.61) than non-Hispanic white
adults. Significant positive associations were found between vitamin D deficiency and
several characteristics, namely obesity (OR = 7.43, 95% CI = 4.33-12.77), physical
inactivity (OR = 1.63, 95% CI = 1.03-2.58) poor dietary vitamin D intake (OR = 2.34,
95% CI = 1.44-3.81), non-supplement use or supplement use with a low amount of
vitamin D (OR = 1.75, 95% CI = 1.05-2.89), and activities that decrease exposure to
sunlight (from OR = 2.97, 95% CI = 2.14-4.13 to OR = 5.30, 95% CI = 3.17-8.85).
Conclusion: The results of this nationally representative study demonstrate that obesity,
physical inactivity, poor dietary intake of vitamin D, and low sunlight exposure increases
the risk for vitamin D deficiency in U.S adults. Future studies are needed to investigate
whether vitamin D supplementation, sunlight exposure, and vitamin D-fortified foods are
VITAMIN D STATUS IN THE U.S. POPULATION: NATIONAL
HEALTH AND NUTRITION EXAMINATION SURVEY, 2005-2006
By
SHALINI PATEL
A Thesis Presented in Partial Fulfillment of Requirements for the Degree of
Master of Science in Health Science
Byrdine F. Lewis School of Nursing and Health Professions
Division of Nutrition
ii
I wish to express my sincere gratitude to the chairman of my advisory committee, Dr.
Meera Penumetcha, for her assistance, encouragement, and support during the
development and writing of this thesis. I also wish to extend my sincere appreciation to
Dr. Anita Nucci and Mrs. Catherine McCarroll for their support during my year as a
Coordinated Program student. A special thanks to Dr. Elena Kuklina who has spent
countless hours in assisting me with the statistical analysis without which this project
would not have been possible. Finally, I would like to dedicate this thesis to my future
husband, Dr. Nishant Shah, for his unending support and encouragement throughout my
iii
ACKNOWLEGEMENTS...ii
LIST OF TABLES... vi
LIST OF FIGURES... vii
ABBREVIATIONS... viii
CHAPTER I: INTRODUCTION...1
CHAPTER II: REVIEW OF LITERATURE... 3
VITAMIN D... 3
Vitamin D Biosynthesis and Metabolism... 3
Figure 1: Vitamin D Metabolism...4
Sources of Vitamin D...5
Table 1: Selected Sources of Vitamin D2 and Vitamin D3... 5
Determination of Vitamin D Status... 6
Table 2: Classification of Vitamin D Status by Serum 25-Hydroxyvitamin D... 7
Factors Influencing Vitamin D Status...7
Solar Zenith Angle... 7
Pollution... 8
iv
Age... 9
Adiposity... 10
Medication Use... 11
Malabsorption... 11
Prevalence of Vitamin D Deficiency... 12
Biological Functions of Vitamin D... 13
Definition of Optimal Vitamin D Status for Skeletal Health...14
SELECTED METHODS OF DIETARY ASSESSMENT... 14
Food Frequency Questionnaire... 14
24-Hour Recall... 16
Conclusions... 17
CHAPTER III: METHODOLOGY... 18
NHANES Survey Design...18
NHANES 2005-2006 Study Sample...19
Description of Demographic Study Variables... 19
Description of Dietary Study Variables... 20
Description of Lifestyle Study Variables...21
v
Statistical Analysis... 25
CHAPTER IV: RESULTS...26
Sample Characteristics... 26
Table 3: Characteristics of the Study Sample... 27
Distribution of Vitamin D Deficiency in the Study Sample... 30
Table 4: Prevalence of Vitamin D Deficiency in the Study Sample...32
Likelihood of Vitamin D Deficiency... 37
Table 5: Multivariate Odds Ratio and 95% Confidence Interval for Vitamin D Deficiency According to Characteristics of the Study Sample...39
CHAPTER V: DISCUSSION AND CONCLUSIONS... 44
Strengths and Limitations... 49
Conclusions... 50
REFERENCES... 52
vi
Table 1: Selected Sources of Vitamin D2 and Vitamin D3.………..5
Table 2: Classification of Vitamin D Status by Serum 25-Hydroxyvitamin D…………...7
Table 3: Characteristics of the Study Sample.………...27
Table 4: Serum Vitamin D Status According to Characteristics of the Study Sample.….32
Table 5: Multivariate Odds Ratio and 95% Confidence Intervals for Vitamin D
vii
Figure 1: Vitamin D Metabolism……….4
viii
1,25(OH)2D 1,25-dihydroxyvitamin D (calcitriol)
24-HR 24-hour recall
25(OH)D 25-hydroxyvitamin D (calcidiol)
ACE angiotensin-converting enzyme
BMI body mass index
CDC Centers for Disease Control and Prevention
CI confidence interval
DBP vitamin D binding protein
DV Daily Value
FFQ food frequency questionnaire
HDL high-density lipoprotein
IU International Unit
kg kilogram
L liter
m meter
mcg microgram
MEC mobile examination center
mL milliliter
n sample size
ix
NHANES National Health and Nutrition Examination Survey
ng nanogram
nm nanometer
nmol nanomole
OR odds ratio
oz ounce
p probability value
PTH parathyroid hormone
ptrend probability value for trend
RANK receptor activator of nuclear factor-κB
RANKL receptor activator of nuclear factor-κB ligand
RDA Recommended Dietary Allowance
RIA radioimmunoassay
SAS Statistical Analysis Software
SE standard error
SPF sun protection factor
SZA solar zenith angle
tbsp tablespoon
U.S. United States
UVB ultraviolet B
CHAPTERI
INTRODUCTION
Vitamin D deficiency is a common condition, especially among adults (1). New
research has demonstrated that serum vitamin D concentrations previously considered in
the normal range are not sufficient for optimal health, thereby increasing the risk of bone
disease. In their consensus report for dietary reference intakes for calcium and vitamin
D, the Institute of Medicine recognizes concentrations of serum 25-hydroxyvitamin D
[25(OH)D] ≤ 50 nmol/L as “inadequate for bone and overall health in healthy
individuals.” Furthermore, concentrations of serum 25(OH)D < 30 nmol/L are associated
with vitamin D deficiency, rickets in infants and children, and osteomalacia in adults (2).
It is well known that vitamin D plays a role in decreasing the risk of age-related
osteoporosis (1) and therefore, determinants of vitamin D status have been of interest
when studying the epidemiology of bone-related disease. However, the functions of
vitamin D are now recognized to extend beyond skeletal health. Emerging research has
demonstrated vitamin D to play a role in decreasing the risk of some types of cancer, type
1 and type 2 diabetes mellitus, multiple sclerosis, infectious diseases, cardiovascular
disease, myocardial dysfunction, and hypertension in middle to older-aged women (3–5).
Because the risk of disease increases with age, maintaining vitamin D adequacy,
especially during the teenage and early adult years, is recommended by health
prevalence of vitamin D deficiency persists among adults in the United States, especially
in certain subgroups. Data from several large, nationally representative surveys indicate
that serum 25(OH)D concentrations are declining on the population level (6,7). One
possible explanation for this decline is an increase in sun protective behaviors due to
heightened awareness of skin cancer prevention. Because direct exposure of the skin to
sunlight is the main source of vitamin D in this country (3,8,9), behaviors that decrease or
impede sunlight exposure should be considered as possible determinants of vitamin D
status.
Understanding modifiable determinants of vitamin D status are important for
managing vitamin D deficiency at the individual level and for addressing vitamin D
deficiency at the population level. There is a lack of comprehensive population-based
studies that investigate modifiable determinants, such as sun protective measures, in
relation to serum vitamin D status. Therefore, the objective of this study was to evaluate
the associations between serum vitamin D status (deficiency and insufficiency) and
distinct demographic, dietary, and lifestyle characteristics of adults, to see if other
behaviors as compared to dietary data are better able to predict vitamin D status in the
U.S. using a large, nationally representative survey, the National Health and Nutrition
CHAPTER II
REVIEW OF LITERATURE
VITAMIN D
Vitamin D Biosynthesis and Metabolism
Vitamin D, a general term for the fat-soluble vitamin, may refer to vitamin D2
(ergocalciferol), vitamin D3 (cholecalciferol), or its metabolites. Both vitamin D2 and D3
are metabolized in a similar fashion (8). The biosynthesis of cholecalciferol occurs in the
skin upon exposure to ultraviolet B (UVB) radiation from sunlight. In the epidermis and
dermis, UVB rays react with 7-dehydrocholesterol in the plasma membrane of the skin
cell to form vitamin D3 (10,11). Once vitamin D3 is formed, it travels into the
extracellular space where vitamin D binding protein (DBP) transports it into the dermal
capillary bed. Vitamin D3 is then transported to the liver where it is hydroxylated to
25(OH)D or calcidiol (11). Although biologically inactive, this is the major circulating
form of vitamin D and is used as a determinant of vitamin D adequacy (8,11). Calcidiol
is then converted to 1,25-dihydroxyvitamin D [1,25(OH)2D] or calcitriol, the biologically
active form of vitamin D. This conversion takes place under the influence of
1α-hydroxylase in the proximal renal tubule of the kidney and is tightly regulated by several
factors including serum phosphorous and parathyroid hormone (PTH) levels (9,11).
Once this conversion takes place, calcitrol acts on various organs of the body including
the intestine, bone, kidney, and parathyroid glands (10).
The biosynthesis of ergocalciferol is similar to that of cholecalciferol. Ergosterol,
a form of vitamin D present in plants and a precursor to ergocalciferol, undergoes the
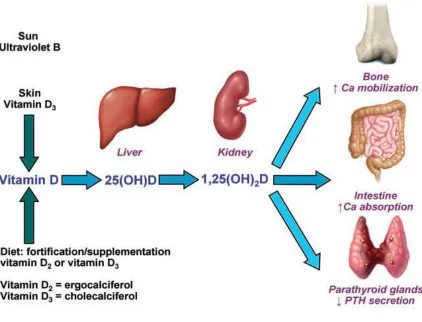
same hydroxylation reactions in the liver and kidney (8,11). Vitamin D metabolism is
[image:20.612.110.532.185.507.2]described in Figure 1.
Figure 1: Vitamin D Metabolism (8)
Cholecalciferol is formed after the absorption of UVB radiation in the skin or after
ingestion of dietary vitamin D. In the liver, cholecalciferol is hydroxylated on carbon 25
to form 25(OH)D or calcidiol, the biologically inactive form of vitamin D. In the
kidneys, the biologically active form of vitamin D, calcitriol, is formed after another
Sources of Vitamin D
Vitamin D is obtained through cutaneous synthesis after exposure to sunlight,
through diet, and through dietary supplements. Cutaneous synthesis of vitamin D3 occurs
after exposure to ultraviolet radiation in wavelengths between 290 and 315 nm (9).
Twenty minutes of sun exposure in this wavelength range during the summer months can
produce the equivalent of up to 20,000 International Units (IU) of vitamin D3 (3,8).
Few dietary sources naturally contain vitamin D (3). Vitamin D2 is produced
through the irradiation of yeast and is found in some plant foods (8). This form is used to
fortify certain foods such as cereal, milk, and orange juice (3). Vitamin D3 is
manufactured through the irradiation of 7-dehydrocholesterol from lanolin and is found
in animal sources such as oily fish, egg yolk, and liver (3,8). Both forms are used in
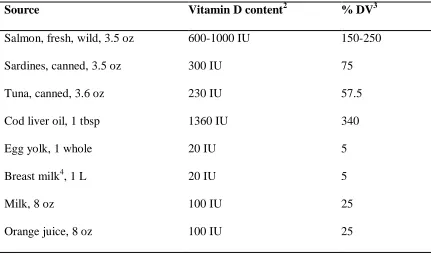
prescription and over-the-counter supplements (8). Selected sources of vitamin D2 and
[image:21.612.109.540.457.711.2]vitamin D3 are found in Table 1.
Table 1: Selected Sources of Vitamin D2 and Vitamin D31 (3,12)
Source Vitamin D content2 % DV3
Salmon, fresh, wild, 3.5 oz 600-1000 IU 150-250
Sardines, canned, 3.5 oz 300 IU 75
Tuna, canned, 3.6 oz 230 IU 57.5
Cod liver oil, 1 tbsp 1360 IU 340
Egg yolk, 1 whole 20 IU 5
Breast milk4, 1 L 20 IU 5
Milk, 8 oz 100 IU 25
Cheeses, 3 oz 100 IU 25
Margarine, 3.5 oz 430 IU 107.5
Ergocalciferol, 1 capsule 50,000 IU 12,500
Calcitriol [Rocaltrol], 1 capsule 0.25 or 0.5 mcg 2.5 or 5
Multivitamin 400 IU 100
Cholecalciferol, 1 tablet 400, 800, or 1000 IU 100, 200, or 250
1
IU = International Unit
2
Primarily vitamin D3, except egg yolk (D2 or D3)
3
DV = Daily Value
4
In vitamin D sufficient lactating women
Determination of Vitamin D Status
Although 1,25(OH)2D is the biologically active form of vitamin D, it is not used
to determine vitamin D status due to its short half-life and low circulating levels.
Circulating levels of 25(OH)D are a thousand fold more than 1,25(OH)2D and its half-life
is approximately 2 to 3 weeks (8,13,14). Therefore, measurement of 25(OH)D will
represent a steady concentration of vitamin D produced from both the diet and UVB
exposure up to several months (11).
There are several assay methodologies used to measure 25(OH)D in the serum.
The most commonly used assays include the DiaSorin radioimmunoassay (RIA), the
Nichols Advantage competitive binding protein assay, and the Immunodiagnostic
Systems RIA (15). Recently, the Centers for Disease Control and Prevention (CDC)
discontinued their use of the DiaSorin RIA, which identifies both 25-hydroxyvitamin D2
will independently measure 25-hydroxyvitamin D2 and 25-hydroxyvitamin D3 was
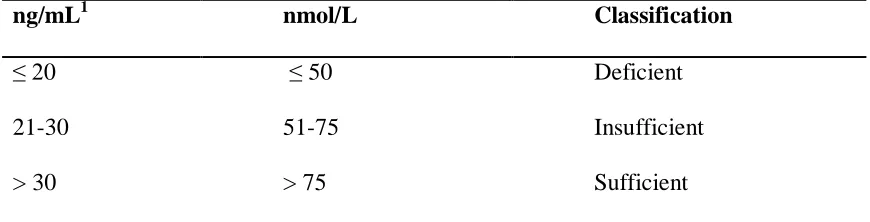
adapted starting with NHANES 2007-2008 (16). Classification of vitamin D status by
[image:23.612.107.542.183.294.2]serum 25(OH)D concentration is given in Table 2.
Table 2: Classification of Vitamin D Status by Serum 25-Hydroxyvitamin D (13)
ng/mL1 nmol/L Classification
≤ 20 ≤50 Deficient
21-30 51-75 Insufficient
> 30 > 75 Sufficient
1
Multiply by 2.496 to convert ng/mL to nmol/L
Factors Influencing Vitamin D Status
Solar Zenith Angle
The amount of UVB radiation absorbed through human skin is influenced by a
number of factors including the solar zenith angle (SZA) (17). The SZA, established by
time of day, season, and latitude, influences the intensity of UVB radiation (9). Oblique
SZAs increase the path of UVB radiation through the ozone layer allowing increased
ozone absorption of UVB photons (18). As a result, fewer UVB photons strike the skin
leading to inefficient conversion of 7-dehydrocholesterol to vitamin D3 (9,17,18). It has
been reported that very little vitamin D3 synthesis occurs at latitudes above 37° during the
winter months because the number of UVB photons striking the earth and skin is
extremely decreased. However, latitudes closer to the equator provide more opportunity
Pollution
Pollution can also lower the biosynthesis of vitamin D3 by decreasing the number
of UVB photons available for absorption through the skin (19,20). This is particularly
common in highly urbanized areas with low-level air pollution (17) and in areas where
fossil fuel and biomass combustion occurs (9,21). For example, a study conducted in the
rainforests of Brazil revealed UVB radiation reductions up to 81% due to smoke from
biomass burning (21).
Clothing
Clothing may interfere with UVB exposure and decrease the photosynthesis of
vitamin D3 in the skin (9). Fabric quality such as fiber, color, and presence of dyes
influence the transmission of UVB through clothing. In a comparative study, Davis et al
(22) measured UVB transmission through 28 different types of fabric. As expected,
results indicated that lightweight fibers such as cotton and linen allowed more UVB
transmission than heavier fibers such as wool and polyester. Certain dress styles also
have the ability to impede photosynthesis of vitamin D3 in the skin. Several studies have
suggested that women who wear veils or clothing that covers the entire body (usually for
religious purposes) exhibit low serum concentrations of 25(OH)D (23,24).
Sunscreen
Sunscreen agents impede UVB-7-dehydrocholesterol interactions by absorbing
UVB radiation before it enters the skin (9,18). Sunscreens with a sun protection factor
(SPF) up to 15 have the ability to reduce cutaneous synthesis of vitamin D3 by greater
than 98% (25). The application of sunscreen also prevents sun burning, wrinkles, and
exposure, and other sun protective measures are highly encouraged despite the potential
of these practices to decrease vitamin D3 synthesis in the skin (26).
Melanin
Melanin is a natural substance produced by melanocytes in the skin through the
action of α-melanocyte-stimulating hormone in response to ultraviolet radiation (9,26). It
is often referred to as “natural sunscreen” because of its tendency to compete with
7-dehydrocholesterol for UVB photons (11,18,27). Individuals will exhibit varying
pigmentation depending on the type of melanin and size and shape of melanosomes
(pigment granules) in the skin. Individuals with large melanosomes have higher
concentrations of melanin and darkly pigmented skin while those with small
melanosomes have lower concentrations of melanin and lightly pigmented skin (26).
Persons with lower concentrations of melanin require less UVB exposure to generate the
same amount of vitamin D3 compared to their dark-skinned counterparts (28). Therefore,
variations in serum 25(OH)D concentrations among different ethnicities may partly be
explained by differences in skin color (23).
Age
The cutaneous production of vitamin D3 declines with age due to decreased
concentrations of 7-dehydrocholesterol in the skin (9,23). MacLaughlin et al (29)
confirmed this age-related decrease in the ability of human skin to synthesize vitamin D3
in a comparative study. Skin samples obtained from individuals aged 8 to 92 years were
exposed to ultraviolet radiation and after which levels of vitamin D3 were determined.
The authors of this study found a significant decline in the ability of skin obtained from
obtained from the 8- and 18-year-old subjects. The findings of this study, however, are
limited in their extrapolation since the skin samples were obtained from Caucasian
subjects only. Low serum 25(OH)D concentrations among older adults is common
regardless of season (30) and can be further exacerbated by confined living conditions
and decreased dietary intake (1,23).
Adiposity
Vitamin D obtained through cutaneous synthesis after exposure to sunlight,
through diet, and through dietary supplements can be stored by adipocytes for later use,
such as in the winter when little cutaneous synthesis occurs (18,31). A high level of
adiposity, however, appears to be inversely related to vitamin D status (9). Wortsman et
al (32) demonstrated this inverse relationship in a comparative study; obese individuals
(body mass index [BMI] ≥ 30 kg/m2
) were found to have lower vitamin D3
concentrations compared to normal weight control subjects (BMI ≤ 25 kg/m2
).
Therefore, the authors of this study concluded that obesity increases the risk of vitamin D
deficiency.
Several mechanisms for suboptimal levels of vitamin D in obesity have been
proposed. Obesity has been associated with diminished bioavailability of vitamin D due
to the sequestration of vitamin D in larger amounts of adipose tissue (3,9). It has also
been suggested that obese individuals avoid UVB exposure, which is necessary for
cutaneous synthesis of vitamin D (32). This is most likely due to a sedentary lifestyle
(12). Lastly, it has been proposed that 1,25(OH)2D, the biologically active form of
vitamin D, is synthesized at a higher rate and therefore has a negative feedback control on
Medication Use
Medication use has the ability to interfere with the catabolism and bioavailability
of vitamin D. It has been suggested that certain medications such as glucocorticoids,
antiretroviral therapy, and antirejection drugs have the capacity to increase catabolism of
25(OH)D and 1,25(OH)2D to calcitroic acid, an inactive metabolite of vitamin D (3).
Anticonvulsant therapy may also play a role in the development of vitamin D deficiency
by similar mechanisms (3); however, there is conflicting evidence confirming this
association (34,35). Bile-acid binding medications such as cholestyramine and
colestipol, often used in the treatment of hypercholesterolemia, have the capacity to
impair vitamin D absorption (3,9).
Recently, a study by Lee et al (36) demonstrated the impact of medication use on
vitamin D status in subjects aged 55 to 88 years. Results indicated the use of oral
anti-diabetics, calcium-channel blockers, and angiotensin-converting enzyme (ACE)
inhibitors lowered the serum 25(OH)D concentration of medication users by 7.4 nmol/L
(p = 0.04), 7.7 nmol/L (p = 0.01), and 7.6 nmol/L (p = 0.01), respectively. The results of
this study demonstrate the ability of common medications to influence vitamin D status
in older adults. This, compounded with the use of multiple medications in older adults,
may warrant vitamin D supplementation in individuals with chronic disease.
Malabsorption
Following cutaneous synthesis or oral consumption, vitamin D is incorporated
into bile salt micelles and absorbed into the proximal small intestine (9). Vitamin D is a
fat-soluble vitamin and therefore, intestinal absorption of this vitamin may be impaired in
(11,37–39). Vitamin D insufficiency has been observed in post-gastrectomy, celiac
disease, inflammatory bowel syndromes such as Crohn’s disease and ulcerative colitis,
pancreatic insufficiency, bariatric surgery (39), Whipple’s disease, and cystic fibrosis
(11). In addition, because vitamin D is implicated in skeletal health, malabsorption can
lead to bone disease such as osteoporosis and osteomalacia (39).
Prevalence of Vitamin D Deficiency
Vitamin D deficiency is often underreported (1). Results of NHANES 2001-2004
found approximately 30% of the study population to be insufficient or deficient in
vitamin D. In this study of over 20,000 U.S. individuals, vitamin D insufficiency was
defined as a serum 25(OH)D concentration between 25 and 75 nmol/L and vitamin D
deficiency was defined as a serum 25(OH)D concentration less than 20 to 25 nmol/L
(40). Furthermore, data from several NHANES cycles indicate serum 25(OH)D levels
are decreasing on the population level. The 1988-1994 cycle (n = 18,883) showed a
mean serum 25(OH)D level of 75 nmol/L followed by a mean level of 60 nmol/L in the
2001-2004 cycle (n = 13,369) (7). The most recent data from the 2005-2006 cycle (n =
4995) show a mean serum 25(OH)D level of 49.8 nmol/L (6).
Levels of 25(OH)D present in the serum vary depending upon ethnicity, age,
health status, and various lifestyle factors. Forrest et al (6) analyzed data from NHANES
2005-2006 and found 82.1% (95% CI = 76.5-86.5) of African American adults to have
serum 25(OH)D levels below 20 mg/mL. Hispanic adults followed with a prevalence
rate of 62.9% (95% CI = 53.2-71.7). Other factors associated with a high prevalence rate
of vitamin D deficiency in this study population included obesity, low high density
Biological Functions of Vitamin D
The main biological function of vitamin D is to maintain serum levels of calcium
in the body (11). Once 1,25(OH)2D, the biologically active vitamin D metabolite, binds
to the nuclear vitamin D receptor (VDR), intestinal absorption of both calcium and
phosphorous is triggered. In a vitamin D deficient state, intestinal absorption of dietary
calcium is reduced up to 15%, which is inadequate for proper bone metabolism and
neuromuscular function. As the circulating level of ionized calcium declines, the
parathyroid glands begin to produce and release PTH (1). PTH then functions in
normalizing the circulating levels of calcium by increasing the amount reabsorbed in the
renal tubules, mobilizing calcium from the bone, and stimulating renal production of
1,25(OH)2D (1,41).
Vitamin D also plays a role in bone metabolism by indirectly influencing
osteoclast (cells that resorb bone) maturation. During times of low intestinal calcium
absorption, both calcium and phosphorous are pulled from the bone by the interaction of
1,25(OH)2D with its VDR in the osteoblast (cells that form bone). 1,25(OH)2D enhances
the expression of receptor activator of nuclear factor-κB ligand (RANKL) on the cell
surface of the osteoblast (11,42,43). RANKL binds to its receptor, receptor activator of
nuclear factor-κB (RANK), on the cell surface of the immature osteoclast thereby
initiating osteoclastogenesis (osteoclast maturation). The mature osteoclasts release
hydrochloric acid and collagenases to dissolve bone mineral and matrix (1,11). As a
result, calcium and phosphorous are pulled from the bone and deposited into the
Definition of Optimal Vitamin D Status for Skeletal Health
Currently, there is no consensus on the classification of vitamin D status by serum
25(OH)D concentration (3,13,44). Vitamin D deficiency is defined by most experts as a
25(OH)D level less than 10 to 20 ng/mL (25 to 50 nmol/L) (3,8,9,12,13,45). As
discussed previously, low serum 25(OH)D levels can impair calcium metabolism and
cause an increase in PTH. Excessive release of PTH due to hypocalcemia (otherwise
known as secondary hyperparathyroidism) coupled with the release of calcium from bone
after osteoclast maturation will promote increases in skeletal resorption and eventually,
bone loss (41). Because serum 25(OH)D levels are inversely related to PTH levels, some
researchers define the level of vitamin D needed for optimal skeletal health as the level of
25(OH)D that maximally suppresses PTH (1,41). Several studies propose optimal
vitamin D status as serum 25(OH)D between 75 and 80 nmol/L (44,46–48).
SELECTED METHODS OF DIETARY ASSESSMENT
Food Frequency Questionnaire
The FFQ is a method of dietary assessment that attempts to estimate usual intake
(49). It is based on grouping foods into categories and uses the frequency of
consumption of listed foods as an index of diet pattern. The frequency of consumption of
the listed foods will vary depending on whether the FFQ is collecting information on
short- or long-term intake. Examples of common frequency of consumption terminology
include “times per day,” “times per week,” and “times per month” (50). In addition, the
FFQ may also attempt to collect information regarding portion size, such as the
The FFQ was originally devised to serve as a self-administered method of dietary
assessment. A limited number of food items were included to test a single hypothesis or
diet-disease relationship (49). More recently, longer variations of the FFQ have emerged
and are commonly used in large epidemiological studies to test several hypotheses
(49,51,52). In addition, it is not uncommon for the FFQ to be administered by a trained
interviewer (49).
There are several advantages associated with the use of FFQs to assess dietary
intake. First, the FFQ often serves as an inexpensive method of dietary assessment,
especially when self-administered. (Interviewer-administered FFQs are more costly due
to interviewer training expenses.) Costs are further reduced if the data collected is
scanned directly into a computer thereby eliminating the need for manual data entry.
Second, because FFQs collect intake information for the preceding year, they are more
representative of usual intake than a short diet record or 24-HR. This reduces the chance
of misclassifying subjects into categories of nutritional status and ultimately increases the
accuracy of information concerning diet-disease relationships (49). Finally, if
self-administered, the risk of interviewer or measurement bias is decreased (52).
The FFQ is considered to be the dominant nutrition assessment tool, especially in
large epidemiological studies (53). However, it is not without limitations. Even a very
short, nonquantitative, self-administered FFQ requires a certain degree of literacy. Very
short FFQs that list a limited number of foods will only be able to address one or two
very specific hypotheses. Listing specific foods therefore makes the FFQ a very
culturally specific nutrition assessment tool. Limiting the number of foods will also
collects information for the preceding year, it is subject to variations in seasonality and
recall. Finally, self-administered FFQs are at best semiquantitative because fixed
definitions of portion size (such as small, medium, and large) are subject to individual
interpretation (49).
24-Hour Recall
The 24-HR is a method of dietary assessment that requires respondents to
describe in detail their food and beverage intake for the preceding 24 hours (50). If
correctly administered, this method can provide accurate, quantitative information
concerning recent nutrient intake. Correct administration of the 24-HR includes the use
of food models, containers, and measuring devices to assess quantity. A trained dietitian
should perform the interview, which typically lasts 30 to 60 minutes (49). Subjects are
asked to recall the last food item eaten during the last 24 hours and work backwards (54).
Compared to the FFQ, the 24-HR requires short-term memory (49) and less time
and effort from the participant (50). It has also been suggested that memory of recent
intake is more precise and portions are estimated with greater accuracy with the 24-HR
(55). This method of dietary assessment is also applicable to most age groups and
literacy levels (50). Furthermore, the training effect is eliminated because the 24-HR is
obtained only once from an unprepared participant (56).
One of the 24-HR’s greatest disadvantages is its limited ability to represent usual
intake (56). However, it has been suggested that variability in usual intake can be
captured by repeated administration of the 24-HR (57). The 24-HR is considerably more
expensive than the FFQ. Because the intake of vitamins and minerals will vary from day
has been suggested that the 24-HR can provide an estimate of the average nutrient intake
of a group (56).
Conclusions
Estimating vitamin D status proves difficult due to the many factors influencing
vitamin D status. This is particularly true regarding data derived from the U.S. and other
nations where the majority of the population’s vitamin D pool is cutaneously synthesized
upon exposure to sunlight. Therefore, investigators attempting to estimate serum
25(OH)D status should consider information regarding sun protective measures and
supplement use, if available. In the U.S., NHANES collects information regarding sun
protective measures in the Dermatology Questionnaire and information regarding
supplement use in the Dietary Supplements and Prescription Medication Questionnaire.
However, to date, there is a lack of comprehensive population-based studies that
investigate modifiable determinants, such as sun protective measures, dietary behaviors,
and physical activity, in relation to serum vitamin D status. Therefore, the objective of
this study was to evaluate the associations between serum vitamin D status and distinct
demographic, dietary, and lifestyle characteristics of adults, to see if other behaviors as
compared to vitamin D supplementation and vitamin D intake as determined by a 24-HR,
are better able to predict vitamin D status in the U.S. using a large, nationally
representative survey, the National Health and Nutrition Examination Survey
CHAPTER III
METHODOLOGY
NHANES Survey Design
NHANES, an annual representative survey of the U.S. civilian
non-institutionalized population aged 2 years and older, was conducted by the National Center
for Health Statistics (NCHS) of the CDC. The sample is selected using a complex,
stratified, multistage, probability cluster sampling design. NHANES is unique in that it
combines interviews, physical examinations, and laboratory tests. Survey participants are
interviewed in their homes and are invited to a mobile examination center (MEC) to
undergo physical examinations, blood and urine sample collection, and additional
computer assisted interviews. The interview portion of the survey consists of
demographic, socioeconomic, dietary, and health-related questions while the examination
and laboratory portions include medical, dental, and physiological measurements.
Informed consent is obtained from each participant for the interview and examination
components (58).
NHANES has historically oversampled certain subgroups including low-income
individuals, adolescents, individuals 60 years or older, African Americans, and Mexican
Americans in order to conduct more accurate analyses of these groups. Since the U.S.
population has been experiencing a dramatic growth in the number of older people,
question. Detailed descriptions of NHANES survey designs and methodologies have
been described elsewhere (59).
NHANES 2005-2006 Study Sample
NHANES 2005-2006 was conducted between January 2005 and December 2006.
Examination data in the northern part of the U.S. was collected between May 1st and
October 31st and examination data in the southern part of the U.S. was collected in
between November 1st and April 30th. The study sample included 12,862 civilian,
non-institutionalized individuals aged 2 months and older. Among this sample, 6351 were
male, 6509 were female, and 9950 were both interviewed and MEC examined.
Description of Demographic Study Variables
For this study, data from NHANES 2005-2006 demographic, dietary,
examination, laboratory, and questionnaire files were used. The demographic file
provides family-level and individual-level information. All survey participants who have
a household interview record have a demographic file record. The demographic file
record also includes the language used in the household and examination interviews,
information about household reference person, proxy respondent codes, and demographic
variables about each survey participant. For the purposes of this study, demographic
variables included age, gender, race/ethnicity, education level, pregnancy status, and six
month time period in which each participant was surveyed and examined.
Gender, age, race/ethnicity, education level, and time of examination were
considered as determinants of vitamin D status as these variables are known to affect
serum 25(OH)D concentrations (9,17,18,25). Age was calculated using the survey
NHANES guidelines (20-29; 30-39; 40-49; 50-59). Race/ethnicity and education level
were based on responses to the Demographic Questionnaire. In the analysis, education
level was classified into five groups: 1 = < 25 years of age; 2 = less than high school; 3 =
high school; 4 = some college; 5 = college graduate. Six-month time period was based
on when each survey participant was examined. In the analysis, a value of ‘1’ indicated
November 1st through April 30th (fall/winter) and a value of ‘2’ indicated May 1st through
October 31st (spring/summer).
Description of Dietary Study Variables
The dietary file provides data collected from participants on their dietary intake,
which includes foods, beverages, and dietary supplements. For the purposes of this
study, the Dietary Supplements and Prescription Medication Questionnaire and total
nutrient intakes as determined by dietary interviews (24-HRs) were used to estimate
dietary intake of vitamin D. Although NHANES administers a FFQ, dietary data from
this assessment method was not included in the analysis because portion size information
is not collected and because the NHANES FFQ is not intended to derive estimate of
absolute intake for either nutrients or foods (60). Vitamin D supplement use was
determined based on ingredient information reported by participants in the Dietary
Supplements and Prescription Medication Questionnaire. In the analysis, dietary vitamin
D from supplementation was classified into tertiles of intake: 1 = ≤ 200 IU; 2 = 201-400
IU; 3 = > 400 IU. Dietary vitamin D from diet was classified into quartiles of intake: 1 =
Description of Lifestyle Study Variables
The questionnaire file provides data collected from participants on various
health-related topics. Data is collected in a MEC via personal interview with a trained
interviewer and via computerized interviews. For the purposes of this study, the
Dermatology Questionnaire and the Physical Activity and Physical Fitness Questionnaire
were used to determine participant sun protective measures and level of activity,
respectively. In the current study, variables obtained from these questionnaires plus the
variable for BMI were considered as “lifestyle variables.” Below is a list of variables
obtained from the dermatology file and included in the analysis.
1. DEQ034A: “When you go outside on a very sunny day, for more than one hour,
how often do you stay in the shade?”
2. DEQ034B: “When you go outside on a very sunny day, for more than one hour,
how often do you wear a hat that shades your face, ears, and neck?”
3. DEQ034C: “When you go outside on a very sunny day, for more than one hour,
how often do you wear a long sleeved shirt?”
4. DEQ034D: “When you go outside on a very sunny day, for more than one hour,
how often do you use sunscreen?”
5. DEQ038G/DEQ038Q: “How many times in the past year have you had a
sunburn?”
Variables indicating participant use of sun protective measures on a very sunny
day [shade (DEQ034A); hat that shades the face, ears, and neck, (DEQ034B); long
sleeved shirt (DEQ034C)] were combined in the analysis. Possible answers in the survey
estimates, responses were collapsed into three frequency categories: regularly (always
and most of the time), occasionally (sometimes), and rarely to never (rarely or never).
Participants were also categorized based on their use of sunscreen (DEQ034D). In the
analysis, this variable was classified into three groups: 1 = regular user; 2 = occasional
user; 3 = scant user to non-user. Also included in the analysis were variables indicating
incidence and frequency of sunburns (DEQ038G/DEQ038Q). Participants were
classified into three groups based on their response: 1 = 0 sunburns; 2 = 1-2 sunburns; 3 =
≥ 3 sunburns. Data for BMI was the only variable obtained from the examination file and
was calculated as weight in kilograms divided by height in meters squared. In the
analysis, this variable was categorized as underweight to normal (≤ 24.9 kg/m2
),
overweight (25.0-29.9 kg/m2), and obese (≥ 30.0 kg/m2).
Biochemical Measurements
Data for serum 25(OH)D was obtained from the laboratory file. Blood samples
were collected by venipuncture from participants in the MECs according to standard
protocols. Detailed specimen collection and processing methods have been described
elsewhere (61). Serum 25(OH)D concentrations were analyzed using DiaSorin RIA,
which identifies both 25-hydroxyvitamin D2 and 25-hydroxyvitamin D3 as total serum
25(OH)D (16).
Current Study Sample
The current study sample included data from NHANES 2005-2006 and initially
consisted of 12,862 participants. Only those survey participants who were aged 20-59
were eligible to answer the Dermatology Questionnaire and for this reason, participants
8432). A further number of participants were excluded due to missing values for vitamin
D concentration, demographic, dietary, and lifestyle variables, or if pregnant at the time
of examination (n = 440). After applying the above exclusion criteria, the final sample
consisted of 2340participants representing approximately 144 million U.S.
non-institutionalized civilians aged 2 years and older. A detailed derivation of the current
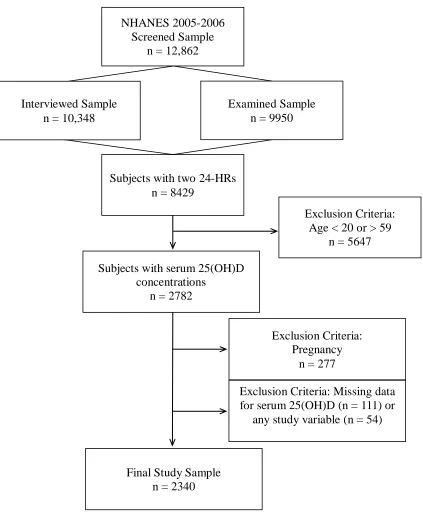
Figure 2: Derivation of Study Sample
The final study sample consisted of 2340 participants (weighted sample = 144,129,696).
Participants were excluded due to missing values for vitamin D concentration,
demographic, dietary, and lifestyle variables, or if pregnant at the time of examination. Examined Sample
n = 9950 NHANES 2005-2006
Screened Sample n = 12,862
Subjects with two 24-HRs n = 8429
Subjects with serum 25(OH)D concentrations
n = 2782
Final Study Sample n = 2340
Exclusion Criteria: Pregnancy
n = 277
Exclusion Criteria: Missing data for serum 25(OH)D (n = 111) or
any study variable (n = 54) Interviewed Sample
n = 10,348
Exclusion Criteria: Age < 20 or > 59
Statistical Analysis
Statistical analysis was performed using Statistical Analysis Software (SAS) to
account for the complex survey design of NHANES. The survey analysis procedures
accounted for stratum, cluster, and observation weight in variance estimation. Sampling
errors were estimated using the Taylor series (linearization) method. Data were sorted by
SDMVSTRA (stratum) and SDMVPSU (primary sampling units). Detailed guidelines on
the sample weighting and the proper variance estimation procedures are outlined in the
NHANES Analytic and Reporting Guidelines (59).
Using cutoff values proposed by Holick et al (1,13) and Bischoff-Ferrari et al
(62), serum 25(OH)D was divided into three categories: 1 = ≤ 50 nmol/L (deficient); 2 =
51-75 nmol/L (insufficient); 3 = > 75 nmol/L (sufficient). Chi-squared tests were used to
identify associations between demographic, dietary, and lifestyle characteristics among
categories of vitamin D status.
Logistic regression was used to evaluate the odds ratio (OR) and 95% CI for
vitamin D deficiency and vitamin D insufficiency. Data were adjusted with energy and
fat intake which were included in the analysis as continuous variables. All other
variables were categorized as described above. Statistical significance was set at α < 0.05
CHAPTER IV
RESULTS
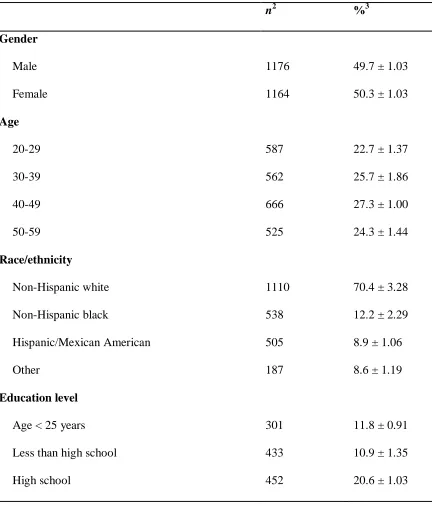
Sample Characteristics
After applying exclusion criteria such as pregnancy and missing data for any
study variable, the final sample consisted of 2340 participants who had dietary interview
and serum 25(OH)D data. Of those, 49.7% (n = 1176) were male and 50.3% (n = 1164)
were female. Participants were fairly distributed across age groups: 20-29 (22.7%, n =
587); 30-39 (25.7%, n = 562); 40-49 (27.3%, n = 666); 50-59 (24.3%, n = 525). The
majority of the study sample was non-Hispanic white (70.4%, n = 1110), followed by
non-Hispanic black (12.2%, n = 538), Hispanic/Mexican American (8.9%, n = 505), and
‘other’ (8.6%, n = 187). The ‘other’ category included non-Hispanics from racial groups
not already categorized. The largest percent of the population (56.5%, n = 1255) was
sampled in the northern part of the U.S. during the spring/summer. Participants were
fairly distributed across categories of BMI: ≤ 24.9 kg/m2
(33.8%, n = 707); 25.0-29.9
kg/m2 (32.2%, n = 776); ≥ 30.0 kg/m2 (34.0%, n = 857). The majority of participants
reported regular use of sun protective measures (38.5%, n = 970), scant to non-use of
sunscreen (49.1%, n = 1382), and no sunburns during the last year (52.4%, n = 1434).
Approximately 38.3% (n = 780) of the study sample reported vitamin D supplement use
during the 30 days prior to the survey. The majority of the population (75.4%, n = 1846)
Daily vitamin D intake from diet was fairly distributed across quartiles: ≤ 72 IU (21.5%,
n = 599); 73-125 IU (24.8%, n = 553); 126-193 IU (24.9%, n = 590); > 193 IU (28.7%, n
= 598). Unweighted values and weighted percentages of selected variables are presented
[image:43.612.109.541.208.714.2]in Table 3.
Table 3: Characteristics of the Study Sample1
n2 %3
Gender
Male 1176 49.7 ± 1.03
Female 1164 50.3 ± 1.03
Age
20-29 587 22.7 ± 1.37
30-39 562 25.7 ± 1.86
40-49 666 27.3 ± 1.00
50-59 525 24.3 ± 1.44
Race/ethnicity
Non-Hispanic white 1110 70.4 ± 3.28
Non-Hispanic black 538 12.2 ± 2.29
Hispanic/Mexican American 505 8.9 ± 1.06
Other 187 8.6 ± 1.19
Education level
Age < 25 years 301 11.8 ± 0.91
Less than high school 433 10.9 ± 1.35
Some college 657 29.8 ± 1.07
College graduate 497 26.9 ± 2.30
Time of examination4
Fall/winter 1085 43.5 ± 7.16
Spring/summer 1255 56.5 ± 7.16
BMI5
Underweight to normal 707 33.8 ± 1.94
Overweight 776 32.2 ± 1.47
Obese 857 34.0 ± 2.46
Physical activity
No activity 769 27.2 ± 2.03
Moderate to vigorous 1338 63.8 ± 2.39
Vigorous 233 9.0 ± 1.11
Sunscreen user
Regular user 499 27.6 ± 1.35
Occasional user 459 23.2 ± 1.10
Scant user to non-user 1382 49.1 ± 1.62
Use of sun protective measures6
Regularly 970 38.5 ± 1.32
Occasionally 856 37.8 ± 0.94
Rarely to never 514 23.7 ± 0.82
Frequency of sunburn during last year
1-2 725 37.9 ± 2.02
≥ 3 181 9.8 ± 0.93
Vitamin D supplement use7
Yes 780 38.3 ± 1.60
No 1560 61.7 ± 1.60
Vitamin D intake from supplementation (IU/day)
≤ 200 1846 75.4 ± 1.52
201-400 416 19.8 ± 1.22
> 400 78 4.8 ± 0.74
Vitamin D intake from food sources (IU/day)8
≤ 72 599 21.5 ± 1.50
73-125 553 24.8 ± 1.32
126-193 590 24.9 ± 1.18
> 193 598 28.7 ± 1.15
Serum vitamin D concentration (nmol/L)
≤ 50 1175 38.4 ± 3.25
51-75 839 41.7 ± 2.01
> 75 326 19.9 ± 2.39
1
Study sample = 2340 (weighted sample = 144,129,686)
2
Unweighted values
3
Weighted percentages ± standard error (SE)
4
Data collected during November 1-April 30 (fall/winter) and May 1-October 31
5Underweight to normal (≤ 24.9 kg/m2
), overweight (25.0-29.9 kg/m2), and obese (≥ 30.0
kg/m2)
6
Data collected on the use of shade and/or use of hat that shades face, ears, and neck
and/or use of long sleeved shirt when participant is outside ≥ 1 hour on a very sunny day
7
Participants who took supplements during the past 30 days prior to the survey
8
Data represents average dietary vitamin D intake as determined by 2 dietary interviews
(24-HRs)
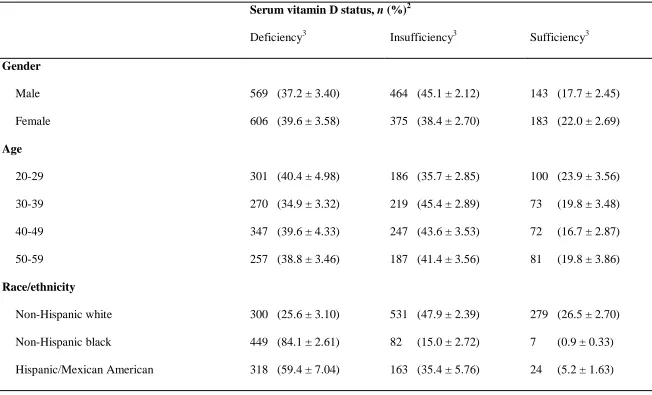
Distribution of Vitamin D Deficiency in the Study Sample
In this study, 80.1% of the population had either deficient (≤ 50 nmol/L) or
insufficient (51-75 nmol/L) concentrations of serum 25(OH)D. The prevalence of
vitamin D deficiency, insufficiency, and sufficiency according to characteristics of the
study sample are presented in Table 4. Prevalence rates of deficiency were highest
among non-Hispanic black adults (84.1%, n = 449) followed by Hispanic/Mexican
American adults (59.4%, n = 318). Non-Hispanic white adults ranked last with a
prevalence of vitamin D deficiency of 25.6% (n = 300). Based on serum vitamin D
status, the prevalence of vitamin D deficiency and insufficiency was fairly distributed
among men and women. Participants aged 20-29 years had the highest prevalence of
vitamin D deficiency (40.4%, n = 301) and sufficiency (23.9%, n = 100) when vitamin D
deficient and sufficient persons were stratified by age. Participants who reported highest
education level completed as ‘less than high school’ ranked first with a prevalence of
vitamin D deficiency of 52.5% (n = 260). The prevalence of vitamin D deficiency was
higher among participants who were examined during the fall and winter months (51.1%,
(28.6%, n = 496). Vitamin D deficiency increased with BMI. In underweight and
normal weight persons, the prevalence of vitamin D deficiency was 29.3% (n = 274),
while overweight persons had a prevalence of 34.7% (n = 360), and obese persons had a
prevalence of 50.9% (n = 541). Vitamin D deficiency was also highest among
participants who reported physical inactivity (52.3%, n = 462). Scant to non-users of
sunscreen, participants that reported regular use of sun protective measures, and
participants that reported no sunburns in the past year had the highest prevalence of
vitamin D deficiency. The prevalence of vitamin D deficiency was lower among
participants who reported vitamin D supplement use within 30 days prior to the survey
than those who reported no vitamin D supplement use. Participants who were in the
lowest tertile of vitamin D intake from supplementation (≤ 200 IU/day) and the lowest
quartile of vitamin D intake from diet (≤ 72 IU/day) had the highest prevalence of
32
Table 4: Prevalence of Vitamin D Deficiency in the Study Sample1
Serum vitamin D status, n (%)2
Deficiency3 Insufficiency3 Sufficiency3
Gender
Male 569 (37.2 ± 3.40) 464 (45.1 ± 2.12) 143 (17.7 ± 2.45)
Female 606 (39.6 ± 3.58) 375 (38.4 ± 2.70) 183 (22.0 ± 2.69)
Age
20-29 301 (40.4 ± 4.98) 186 (35.7 ± 2.85) 100 (23.9 ± 3.56)
30-39 270 (34.9 ± 3.32) 219 (45.4 ± 2.89) 73 (19.8 ± 3.48)
40-49 347 (39.6 ± 4.33) 247 (43.6 ± 3.53) 72 (16.7 ± 2.87)
50-59 257 (38.8 ± 3.46) 187 (41.4 ± 3.56) 81 (19.8 ± 3.86)
Race/ethnicity
Non-Hispanic white 300 (25.6 ± 3.10) 531 (47.9 ± 2.39) 279 (26.5 ± 2.70)
Non-Hispanic black 449 (84.1 ± 2.61) 82 (15.0 ± 2.72) 7 (0.9 ± 0.33)
33 Other 108 (56.8 ± 3.80) 63 (35.8 ± 3.06) 16 (7.4 ± 2.03)
Education level
Age < 25 years old 153 (41.2 ± 6.40) 95 (36.0 ± 3.13) 53 (22.8 ± 5.08)
Less than high school 260 (52.5 ± 5.79) 147 (37.9 ± 4.24) 26 (9.6 ± 3.37)
High school 232 (41.4 ± 3.97) 159 (41.0 ± 3.76) 61 (17.6 ± 2.61)
Some college 334 (38.1 ± 3.91) 221 (38.2 ± 3.04) 102 (23.7 ± 3.62)
College graduate 196 (29.4 ± 2.39) 217 (50.3 ± 2.03) 84 (20.3 ± 1.71)
Time of examination4
Fall/winter 679 (51.1 ± 4.80) 322 (35.8 ± 2.65) 84 (13.1 ± 1.50)
Spring/summer 496 (28.6 ± 2.69) 517 (46.3 ± 3.42) 242 (25.1 ± 2.63)
BMI5
Underweight to normal 274 (29.3 ± 3.57) 263 (38.9 ± 2.01) 170 (31.8 ± 3.32)
Overweight 360 (34.7 ± 3.53) 315 (46.4 ± 2.93) 101 (18.8 ± 3.43)
Obese 541 (50.9 ± 4.57) 261 (40.1 ± 4.08) 55 (9.0 ± 2.34)
34 No activity 462 (52.3 ± 4.08) 240 (34.5 ± 2.95) 67 (13.1 ± 2.10)
Moderate to vigorous 602 (32.3 ± 3.01) 509 (45.1 ± 2.27) 227 (22.6 ± 2.83)
Vigorous 111 (39.4 ± 5.31) 90 (39.9 ± 4.10) 32 (20.7 ± 4.22)
Sunscreen user
Regular user 185 (28.7 ± 0.71) 210 (47.3 ± 1.07) 104 (24.0 ± 0.97)
Occasional user 174 (29.7 ± 0.88) 199 (47.1 ± 0.75) 86 (23.2 ± 0.50)
Scant user to non-user 816 (47.9 ± 2.27) 430 (36.1 ± 1.36) 136 (16.0 ± 1.53)
Use of sun protective measures6
Regularly 576 (48.4 ± 3.93) 316 (40.1 ± 2.99) 78 (11.5 ± 2.07)
Occasionally 409 (35.3 ± 3.10) 308 (43.2 ± 2.37) 139 (21.5 ± 2.87)
Rarely to never 190 (27.0 ± 3.75) 215 (42.0 ± 2.77) 109 (30.9 ± 3.33)
Frequency of sunburn during last year
0 875 (49.9 ± 3.82) 429 (35.5 ± 2.90) 130 (14.7 ± 1.65)
1-2 254 (27.7 ± 3.48) 317 (46.7 ± 2.55) 154 (25.6 ± 3.42)
35
Vitamin D supplement use7
Yes 291 (28.4 ± 0.92) 336 (46.9 ± 1.41) 153 (24.8 ± 1.23)
No 884 (44.6 ± 2.55) 503 (38.6 ± 1.33) 173 (16.8 ± 1.55)
Vitamin D intake from supplements (IU/day)
≤ 200 1002 (42.2 ± 3.67) 617 (39.5 ± 2.26) 227 (18.3 ± 2.40)
201-400 148 (27.8 ± 3.58) 187 (47.8 ± 3.57) 81 (24.4 ± 3.33)
> 400 25 (22.1 ± 4.98) 35 (52.6 ± 8.63) 18 (25.3 ± 6.77)
Vitamin D intake from food sources (IU/day)8
≤ 72 370 (52.4 ± 4.19) 178 (35.3 ± 3.51) 51 (12.3 ± 2.19)
73-125 290 (42.1 ± 4.43) 176 (34.6 ± 2.82) 87 (23.3 ± 3.64)
126-193 288 (34.4 ± 3.54) 220 (46.1 ± 2.64) 82 (19.5 ± 3.06)
> 193 227 (28.2 ± 3.35) 265 (48.9 ± 2.66) 106 (22.8 ± 3.18)
1
Study sample = 2340 (weighted sample = 144,129,686)
2
Unweighted values, n, and weighted percentages ± SE in parentheses
3
Deficient = 25(OH)D ≤ 50 nmol/L; insufficient = 51 ≤ 25(OH)D ≤ 75 nmol/L; sufficient = 25(OH)D > 75 nmol/L
4
36
5Underweight to normal (≤ 24.9 kg/m2
), overweight (25.0-29.9 kg/m2), and obese (≥ 30.0 kg/m2)
6
Data collected on the use of shade and/or use of hat that shades face, ears, and neck and/or use of long sleeved shirt when participant
is outside ≥ 1 hour on a very sunny day
7
Participants who took supplements during the past 30 days prior to the survey
8
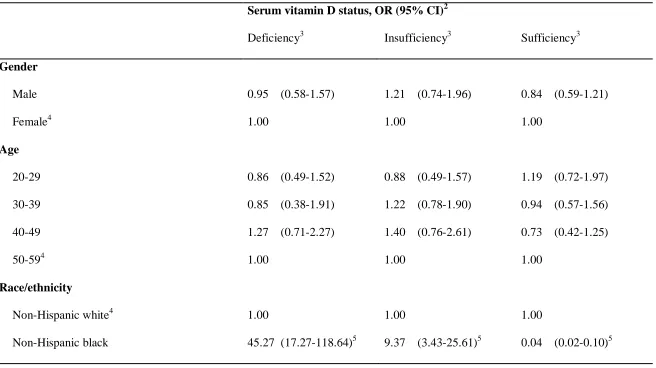
Likelihood of Vitamin D Deficiency
The likelihood of vitamin D deficiency according to determinants of vitamin D
status is presented in Table 5. When stratified by race/ethnicity, non-Hispanic black
adults were the most likely to be vitamin D deficient (OR = 45.27, 95% CI =
17.27-118.64) and vitamin D insufficient (OR = 9.37, 95% CI = 3.43-25.61). Adults classified
as ‘other’ and Hispanic/Mexican American adults were 6 times more likely to be vitamin
D deficient (OR = 6.29, 95% CI = 2.72-14.57 [other]; OR = 6.17, 95% CI = 2.78-13.70
[Hispanic/Mexican American]) than non-Hispanic white adults. The likelihood of vitamin
D deficiency in participants who were examined during the fall and winter months was
significantly higher (OR = 2.81, 95% CI = 1.07-7.43) relative to persons examined during
the spring and summer months. The odds of vitamin D deficiency and vitamin D
insufficiency increased as BMI increased. Overweight persons were significantly more
likely to be deficient (OR = 2.11, 95% CI = 1.20-3.71) and insufficient (OR = 1.84, 95%
CI = 1.25-2.70) in vitamin D than underweight to normal weight persons. Similarly,
obese persons were 7 times more likely to be deficient (OR = 7.43, 95% CI = 4.33-12.77)
and 4 times more likely to be insufficient (OR = 4.33, 95% CI = 2.36-7.94) in vitamin D
than adults with an underweight or normal BMI. In this study, inactive adults were more
likely to be vitamin D deficient than moderately to vigorously active adults. Regular and
occasional use of sun protective measures (shade and/or hat that shades face, ears, and
neck and/or long sleeved shirt) significantly increased the likelihood of vitamin D
deficiency and insufficiency. The odds of vitamin D deficiency increased as the number
of reported sunburns decreased. Compared to adults who reported ≥ 3 sunburns in the past
deficient (OR = 1.68, 95% CI = 1.01-2.81) and adults that reported 0 sunburns were
almost 3 times more likely to be vitamin D deficient (OR = 2.73, 95% CI = 1.50-4.96).
The odds of vitamin D deficiency were highest among adults who were in the lowest
tertile of vitamin D intake from supplementation (OR = 1.75, 95% CI = 1.05-2.89) and the
39
Table 5: Multivariate Odds Ratio and 95% Confidence Interval for Vitamin D Deficiency According to Characteristics of the
Study Sample1
Serum vitamin D status, OR (95% CI)2
Deficiency3 Insufficiency3 Sufficiency3
Gender
Male 0.95 (0.58-1.57) 1.21 (0.74-1.96) 0.84 (0.59-1.21)
Female4 1.00 1.00 1.00
Age
20-29 0.86 (0.49-1.52) 0.88 (0.49-1.57) 1.19 (0.72-1.97)
30-39 0.85 (0.38-1.91) 1.22 (0.78-1.90) 0.94 (0.57-1.56)
40-49 1.27 (0.71-2.27) 1.40 (0.76-2.61) 0.73 (0.42-1.25)
50-594 1.00 1.00 1.00
Race/ethnicity
Non-Hispanic white4 1.00 1.00 1.00
40 Hispanic/Mexican American 6.17 (2.78-13.70)5 3.19 (1.98-5.14)5 0.24 (0.14-0.42)5
Other 6.29 (2.72-14.57)5 2.91 (1.13-7.52)5 0.24 (0.10-0.58)5
Education level
Age < 25 years old 1.10 (0.38-3.24) 0.88 (0.45-1.75) 1.05 (0.49-2.24)
Less than high school 0.69 (0.28-1.73) 0.74 (0.31-1.76) 1.37 (0.58-3.25)
High school 0.96 (0.54-1.71) 0.75 (0.47-1.22) 1.25 (0.78-1.98)
Some college 0.70 (0.38-1.28) 0.53 (0.33-0.86)5 1.76 (1.14-2.71)5
College graduate4 1.00 1.00 1.00
Time of examination6
Fall/winter 2.81 (1.07-7.43)5 1.36 (0.86-2.14) 0.56 (0.31-1.01)
Spring/summer4 1.00 1.00 1.00
BMI7
Underweight to normal4 1.00 1.00 1.00
Overweight 2.11 (1.20-3.71)5 1.84 (1.25-2.70)5 0.55 (0.38-0.80)5
41
Physical activity
No activity 1.63 (1.03-2.58)5 1.18 (0.77-1.81) 0.74 (0.50-1.08)
Moderate to vigorous4 1.00 1.00 1.00
Vigorous 1.30 (0.76-2.14) 0.93 (0.55-1.57) 0.91 (0.54-1.54)
Sunscreen user
Regular user 0.61 (0.36-1.02) 1.01 (0.59-1.75) 1.18 (0.75-1.87)
Occasional user 0.79 (0.46-1.35) 0.83 (0.57-1.21) 1.25 (0.96-1.64)
Scant user to non-user4 1.00 1.00 1.00
Use of sun protective measures8
Regularly 5.30 (3.17-8.85)5 2.37 (1.57-3.57)5 0.35 (0.24-0.50)5
Occasionally 2.97 (2.14-4.13)5 1.67 (1.26-2.22)5 0.52 (0.41-0.66)5
Rarely to never4 1.00 1.00 1.00
Frequency of sunburn during last year
0 2.73 (1.50-4.96)5 0.85 (0.53-1.36) 0.86 (0.57-1.30)
42 ≥ 34
1.00 1.00 1.00
Vitamin D intake from supplementation (IU/day)9
≤ 200 1.75 (1.05-2.89)5 1.25 (0.93-1.67) 0.70 (0.51-0.97)5
201-4004 1.00 1.00 1.00
> 400 0.45 (0.10-2.10) 1.23 (0.47-3.22) 0.93 (0.40-2.14)
Vitamin D intake from food sources (IU/day)10
≤ 72 2.34 (1.44-3.81)5 1.56 (1.12-2.18)5 0.60 (0.44-0.80)5
73-125 1.02 (0.55-1.90) 0.63 (0.42-0.94)5 1.40 (0.98-2.01)
126-193 1.07 (0.61-1.87) 0.99 (0.71-1.38) 1.01 (0.71-1.44)
> 1934 1.00 1.00 1.00
1
Study sample = 2340 (weighted sample = 144,129,686)
2
All values represent OR and 95% CI in parentheses
3
Deficient = 25(OH)D ≤ 50 nmol/L; insufficient = 51 ≤ 25(OH)D ≤ 75 nmol/L; sufficient = 25(OH)D > 75 nmol/L
4
Referent category
5
Significantly different from the referent category
6
43
7
Underweight to normal (≤ 24.9 kg/m2), overweight (25.0-29.9 kg/m2), and obese (≥ 30.0 kg/m2)
8
Data collected on the use of shade and/or use of hat that shades face, ears, and neck and/or use of long sleeved shirt when participant
is outside ≥ 1 hour on a very sunny day
9
Participants who took supplements during the past 30 days prior to the survey
10
CHAPTER V
DISCUSSION AND CONCLUSIONS
To our knowledge, this is one of the most comprehensive studies that investigates
the associations between serum vitamin D status and distinct demographic, dietary, and
lifestyle characteristics of adults, to see if other behaviors as compared to vitamin D
supplementation and vitamin D intake as determined by a 24-HR, are better able to
predict vitamin D status in the U.S. using a large, nationally representative survey. The
overall prevalence rate of suboptimal serum vitamin D concentration was 80.1%.
Vitamin D deficiency was fairly distributed among males and females, higher in younger
adults, adults with an obese BMI, inactive adults, and in adults without a college degree.
In general, these results were expected and are similar to results that other investigators
have found (6,40,63,64). In our adjusted models, the highest odds of vitamin D
deficiency were for non-Hispanic black adults, adults with an obese BMI, adults who
were regular users of sun protective measures, adults who reported no sunburns during
the past year, and adults who fell into the lowest quartile of vitamin D intake from food
sources.
Several studies have reported a high prevalence rate of vitamin D deficiency
among non-Hispanic blacks (6,40,63–67). A high prevalence rate of deficiency among
this subgroup persists even though different cutoff values have been used to define