ScholarWorks @ Georgia State University
ScholarWorks @ Georgia State University
Nutrition Theses Department of Nutrition
Summer 6-8-2012
Suboptimal Nutrient Intake in HIV-Infected Youth and
Suboptimal Nutrient Intake in HIV-Infected Youth and
Associations with Serum Lipid Profiles and HIV-Related Factors
Associations with Serum Lipid Profiles and HIV-Related Factors
Lindsey A. Stricker
Georgia State University
Follow this and additional works at: https://scholarworks.gsu.edu/nutrition_theses
Recommended Citation Recommended Citation
Stricker, Lindsey A., "Suboptimal Nutrient Intake in HIV-Infected Youth and Associations with Serum Lipid Profiles and HIV-Related Factors." Thesis, Georgia State University, 2012.
https://scholarworks.gsu.edu/nutrition_theses/38
This Thesis is brought to you for free and open access by the Department of Nutrition at ScholarWorks @ Georgia State University. It has been accepted for inclusion in Nutrition Theses by an authorized administrator of
This thesis, SUBOPTIMAL NUTRIENT INTAKE IN HIV-INFECTED YOUTH AND ASSOCIATIONS WITH SERUM LIPID PROFILES AND HIV-RELATED FACTORS, by Lindsey A. Stricker was prepared under the direction of the Master’s Thesis Advisory Committee. It is accepted by the committee members in partial fulfillment of the
requirements for the degree Master of Science in the Byrdine F. Lewis School of Nursing & Health Professions, Georgia State University.
The Master’s Thesis Advisory Committee, as representatives of the faculty, certify that this thesis has met all standards of excellence and scholarship as determined by the faculty.
_____________________ Murugi Ndirangu, PhD
Committee Chair
__________________ Anita Nucci, PhD, MPH, RD
Committee Member
______________________ Allison C. Ross, MD
Committee Member
In presenting this thesis as a partial fulfillment of the requirements for the advanced degree from Georgia State University, I agree that the library of Georgia State University shall make it available for inspection and circulation in accordance with its regulations governing materials of this type. I agree that permission to quote, to copy from, or to publish this thesis may be granted by the professor under whose direction it was written, by the Byrdine F. Lewis School of Nursing & Health Professions director of graduate studies and research, or by me. Such quoting, copying, or publishing must be solely for scholarly purposes and will not involve potential financial gain. It is understood that any copying from or publication of this thesis, which involves potential financial gain will not be allowed without my written permission.
All theses deposited in the Georgia State University library must be used in accordance with the stipulations prescribed by the author in the preceding statement. The author of this thesis is:
Lindsey A. Stricker 2970 Skyland Dr. NE
Atlanta, GA 30341
The director of this thesis is:
Murugi Ndirangu Division of Nutrition
Byrdine F. Lewis School of Nursing & Health Professions Georgia State University
Lindsey A. Stricker
EDUCATION:
GEORGIA STATE UNIVERSITY
M.S. HEALTH SCIENCE 2012
UNIVERSITY OF GEORGIA
B.B.A. INTERNATIONAL BUSINESS, FINANCE 2004
PROFESSIONAL EXPERIENCE:
GRADY MEMORIAL HOSPITAL, PIEDMONT HOSPITAL, DAVITA DIALYSIS, SENIOR CONNECTIONS, ETHICA LONG-TERM CARE, DEKALB MEDICAL CENTER FOR OUTPATIENT DIABETES EDUCATION, GEORGIA STATE UNIVERSITY COUNSELING CENTER, EMORY UNIVERSITY’S METABOLIC CAMP, WIC, NATURALLY OCCURRING RETIREMENT COMMUNITY, CHICK-FIL-A, INC.
DIETETIC INTERN 2010-2012
GEORGIA STATE UNIVERSITY STUDENT RECREATION CENTER
NUTRITION EDUCATOR GRADUATE ASSISTANT 2011-2012
EMORY UNIVERSITY HOSPITAL
NUTRITION RESEARCH ASSISTANT 2011-2012
DREW CHARTER SCHOOL
COOKING INSTRUCTOR 2010
RBC BANK
SENIOR RELATIONSHIP BANKER 2008-2010
WACHOVIA BANK
LICENSED FINANCIAL SPECIALIST 2005-2008
WELLS FARGO
AMERICAN DIETETIC ASSOCIATION, STUDENT MEMBER 2010-2012
GREATER ATLANTA DIETETIC ASSOCIATION,
NATIONAL NUTRITION MONTH COMMITTEE MEMBER 2011-2012
PRESENTATIONS AND PUBLICATIONS:
THE 14TH INTERNATIONAL WORKSHOP ON CO-MORBIDITIES AND
ADVERSE DRUG REACTIONS IN HIVPOSTER PRESENTATION 2012
ABSTRACT TO BE PUBLISHED IN ANTIVIRAL THERAPY SUPPLEMENT:
LA Stricker, M Ndurangu, A Nucci, TR Ziegler, V Tangpricha, GA McComsey, JK Frediani, E Millson, L Seaton, AC Ross. Habitual Nutrient Intake in HIV-Infected Youth
and Associations with HIV-Related Factors. 2012
GEORGIA ACADEMY OF NUTRITION AND DIETETICS
Background:Few studies have evaluated habitual nutrient intake among HIV-infected youth in the United States, even though diet may influence immune function and thus HIV-related outcomes. This study sought to determine micro- and macronutrient intake in HIV-infected youth, and investigate the relationships among nutrient intake,
demographics, lipid profiles, and HIV-related factors.
Methods: HIV-infected subjects and healthy controls 1-25 years old were prospectively enrolled.Demographics, clinical and laboratory data (including fasting lipids) were collected. Food and nutrient intake was assessed via 24-hr dietary recalls performed one-on-one with a trained investigator every 3 months for one year. Nutrient intake was determined from averaged food recall data using NDS-R software and directed by research nutritionists. Nutrient intake was compared to Dietary Reference Intakes (DRI) and Acceptable Macronutrient Distribution Ranges (AMDR). Analysis utilized non-parametric and non-parametric tests and Pearson correlations to evaluate associations.
micronutrients compared to HIV- controls. HIV+ youth consumed higher than
By
Lindsey A. Stricker
A Thesis Submitted to the Graduate Faculty of Georgia State University in Partial Fulfillment of the Requirements for the Degree of
MASTER OF SCIENCE IN HEALTH SCIENCES
BYRDINE F. LEWIS SCHOOL OF NURSING & HEALTH PROFESSIONS DIVISION OF NUTRITION
GEORGIA STATE UNIVERSITY
ii
ACKNOWLEDGEMENTS
I would like to acknowledge and thank the following people:
Benjamin Stricker: For his incredible patience and understanding. He is my hero and #1 supporter and I could not have made it through this process without him.
Dr. Murugi Ndirangu: For encouraging me to take on such an incredible project, and providing guidance along its course.
Dr. Allison Ross: For her knowledge, mentoring, and support throughout this study, and above all, for allowing me to use her data to develop my thesis.
Dr. Anita Nucci: For her guidance through the intricate thesis process.
iii
TABLE OF CONTENTS
List of Tables.………iv
List of Figures………v
Abbreviations……… vi
CHAPTER I. INTRODUCTION.………...1
II. REVIEW OF THE LITERATURE………...6
III. METHODS AND PROCEDURES………..………...19
IV. RESULTS………...28
V. DISCUSSION AND CONCLUSION……….46
References………...59
iv
LIST OF TABLES
Table 1: Subject Characteristics………..29
Table 2: Energy Intake………31
Table 3: Mean % DRI (RDA or AI) ± SD………..32
Table 4: DRIs of Nutrients Analyzed……….34
Table 5: Dietary Median Intake for the HIV+ and Control Groups ………..35
Table 6: Frequencies of Subjects with Suboptimal Nutrient Intake………...36
Table 7: Fasting Lipid Levels Compared to Healthy Standards……….42
Table 8: Prevalence of Dyslipidemia………..43
Table 9: Mean Lipid Profiles in Fasting State………43
Table 10: Differences in Mean Serum Lipids Between HIV-infected on ART vs. Not on ART………43
Table 11: HIV+ Correlations Between Nutrient Intake and Lipid Profiles…………...44
v
LIST OF FIGURES
Figure 1: HIV+ Subjects Currently On ART Medications ………..29
Figure 2: HIV+ Subjects that are ART-experienced………30
Figure 3: Perinatally Infected Subjects………30
Figure 4: HIV+ Micronutrient Intake Deficiencies: Differences Between Groups in
Mean % DRI intake.………...……….37
Figure 5: Differences Between Groups in Macronutrient Distribution………...38
vi
ABBREVIATIONS
ACTSI Atlanta Clinical & Translational Science Institute
AHA American Heart Association
AI Adequate Intake
AIDS Acquired Immunodeficiency Syndrome
AMDR Acceptable Macronutrient Distribution Range
AND Academy of Nutrition and Dietetics
ART Antiretroviral Therapy/Treatment
BMI Body Mass Index
CD4 Cells that are targeted by the HIV virus
CDC Centers for Disease Control and Prevention
CIN Clinical Interaction Network
CRP C-Reactive Protein
CVD Cardiovascular Disease
DRI Dietary Reference Intake
EAR Estimated Average Requirements
FFQ Food Frequency Questionnaire
FMD Flow Mediated Dilation
HAART Highly Active Antiretroviral Therapy
HDL-C Serum High-Density Lipoprotein Cholesterol
HIV Human Immunodeficiency Virus
vii
HIV- HIV-negative controls
IDP Infectious Disease Program
IMT Intima-Media Thickness
IOM Institute of Medicine
LDL-C Serum Low-Density Lipoprotein Cholesterol
NDS-R Nutrition Data System for Research Software
PI Protease Inhibitors
RDA Recommended Dietary Allowance
REACH Reaching for Excellence in Adolescent Care and Health
REE Resting Energy Expenditure
TC Total Serum Cholesterol
TG Serum Triglycerides
UL Tolerable Upper Intake Level
1 CHAPTER I
INTRODUCTION
According to the Centers for Disease Control and Prevention (CDC),1
approximately 1.2 million people, aged 13 and older, were living with human
immunodeficiency virus (HIV) infection in the U.S. at the end of 2008. Almost 43,000
new diagnoses of HIV infection in the U.S. were made in 2009. An estimated 8,460 of
those diagnoses were children and youths between the ages of 0 and 24 years.1 Among all
age groups, seven and a half percent of the HIV diagnoses in the U.S. in 2009 occurred in
Georgia. The only states with a greater percentage of overall HIV diagnoses were
Florida, New York and Texas.2 New cases of HIV-infection continue to be a problem in
the U.S. and even more so in Georgia.
There are a number of nutritional issues affecting HIV-infected individuals.
Nutritional issues range depending on medications and disease status. Furthermore, with
developments in medications, long-term nutritional implications have become a bigger
concern for those infected with HIV. In addition to long-term metabolic abnormalities,
more immediate nutrient deficiencies can also impact the disease status of those living
with HIV. Fortunately, vigilant dietary intake by these individuals may limit such issues.
Prior to the introduction of highly active antiretroviral therapy (HAART), wasting
syndrome and growth impairment were some of the major nutritional implications in
children with HIV.3,4 Since the introduction of HAART, children and adults infected
with HIV are living longer,5,6 and there is less concern about wasting and growth
Excellence in Adolescent Care and Health (REACH) study,7 a prospective, observational
cohort study following adolescents’ progression of HIV infection, were either overweight
or obese. Furthermore, they found the obesity prevalence among HIV-infected
adolescents was higher in the southern region of the United States.
With a decrease in wasting, and increase in survival times and obesity, the
concern has shifted toward long-term health problems and chronic diseases associated
with HIV infection and HAART medications.6 Metabolic abnormalities, including
dyslipidemia, and the risk of cardiovascular disease (CVD) are of growing concern in the
HIV infected population.8 Studies8,9 have shown the effectiveness of dietary intervention
on decreasing lipid levels in this population; thus, the first step for improving
hypercholesterolemia and hypertriglyceridemia in patients with HIV should be
consultation with a dietitian.10 Barrios et al.11 found that HIV infected individuals that
complied with a low-fat diet, had significantly lower lipid levels, especially when taking
protease inhibitors (PI). For the general population, the American Heart Association
(AHA) recommends total fat intake to be between 25 and 35% of total calories, saturated
fat to be less than 7% of total calories, trans fats to be less than 1% of total calories,
cholesterol to be less than 300mg per day, and to consume 14g of fiber per 1000 calories
consumed per day, to reduce the risk of CVD.12 CVD is the number one cause of death,
amongst the general population, in the United States. Due to the increased CVD risk
factors in HIV-infected patients, these recommendations may need a stricter following by
the HIV-population. Fat, saturated fat, trans fats, cholesterol and fiber intake are all
Alternatively, malnourishment is still a concern among some HIV-infected
children and adolescents, especially those taking PI.13 Present treatment guidelines
include PI as part of the antiretroviral therapy (ART) regimen for children and adults.14
Children on PI have been shown to have significantly lower body mass index (BMI) and
z scores for weight for age and height for age.13 Regardless of medication, a higher rate
of protein oxidation has been seen in HIV-infected children due to the “inability to
down-regulate protein catabolism” in this population.15 Similarly, HIV infected adults have
been shown to have an increased resting energy expenditure (REE) compared to healthy
people;16 however, data on REE in children is not as clear.6 Johann-Liang and colleagues
did not find evidence for an increased REE in children ages 1 to 13 years.3 On the other
hand, Banerjee and colleagues did find that children on HAART had higher REE than
those not on HAART, and that weight Z-score was significantly negatively associated
with REE.5
Furthermore, studies show that nutritional deficiencies, including selenium,
vitamin A, calcium, vitamin D, zinc, and glutathione, are not uncommon among children
with HIV,17-19 even with the introduction of HAART.13 Several studies on adults
infected with HIV have found micronutrient deficiencies were associated with decreased
immune status, disease progression to AIDS, and increased mortality.20-27 Assessment of
nutritional status can be accomplished using Dietary Reference Intakes (DRIs),28-29 which
are the nutrient reference values derived from years of scientific research that include
four reference values: Recommended Dietary Allowance (RDA), Adequate Intake (AI),
Tolerable Upper Intake Level (UL), and Estimated Average Requirements (EAR). The
nutrient requirements of nearly all (97-98 percent) healthy individuals.” For some
nutrients, there is not enough research to establish an RDA, therefore those nutrients have
an AI, which is considered an adequate amount of intake of the nutrient for healthy
individuals. Unfortunately, in those infected with HIV, the RDA may not meet their
needs, as research30 has suggested that there is a greater utilization of nutrients, possibly
due to increased oxidative stress.
Several studies5,31 have shown that nutrition counseling and support improved the
health of children and adults with HIV, emphasizing the importance of dietary intake
among the HIV-infected population. Given the aforementioned nutritional implications
affecting HIV-infected individuals and that dietary intake is an important environmental
factor contributing to the health of those infected with HIV,6,32 it is important to
understand the current dietary intake of this population. HIV-infected children and
adolescents are at an even higher nutritional risk due to growth and development
demands,33 and few studies have thoroughly described the micro- and macro-nutrient
intake of this population. Micronutrients play an important role in immune function, and
studies show that lower micronutrient intakes are associated with mortality and the
progression of HIV,16 as assessed by biomarkers such as viral load and CD4+ cell
count.23 CD4 are immune cells that are targeted and inactivated by the HIV-virus, and
thus decrease in HIV-infected individuals.16 However, research shows micronutrient
supplements have also had adverse effects on individuals infected with HIV. Therefore,
The World Health Organization16 (WHO) suggests that an adequate diet is the best
method for meeting micronutrient needs in HIV-infected individuals. Thus, determining
will provide valuable information for patient care, as will assessing associations between
intake and HIV-related factors. Furthermore, given the increased risk factors of CVD in
the HIV-infected population, the question remains, do HIV-infected children and youth
follow a heart healthy diet, and does the dietary intake of unhealthy fats and limited fiber
affect nutritional markers of CVD, such as lipid levels, in this population? Therefore, the
objectives of this thesis research are (1) to determine the micro- and macronutrient
intakes of HIV-infected children and youths, (2) to compare the nutrient intakes to the
DRI and to the healthy controls, (3) to determine if nutrient intake is associated with
HIV-related values (CD4+ counts, viral loads),(4) to compare nutrient intake to the
American Heart Association’s recommendations for a heart healthy diet, and (5) to assess
the associations between dietary intake of nutrients (fat, saturated fat, trans fat,
6 CHAPTER II
REVIEW OF LITERATURE
Micronutrient Needs in HIV-Infected Individuals
Micronutrients are important for maintaining the body’s functions and immune
system, and deficiencies have been associated with disease advancement and mortality in
HIV-infected individuals.20-27A U.S. study21 following HIV-infected men over an 8-year
period, found that increased intake of thiamin, riboflavin, niacin, and vitamin B-6 were
associated with longer survival. A 3.5 year study22 following 125 HIV-infected,
drug-using men and women revealed plasma vitamin A, B-12, zinc and selenium deficiencies
were significantly associated with mortality. However, after controlling for CD4+ cell
counts less than 200/mm3, only selenium deficiency was significantly associated with
increased mortality. Vitamin B-6 and E did not show any association with mortality. In
a study of 400 HIV-infected Kenyan women,23 inadequate serum beta-carotene was
significantly associated with the immune response and HIV progression biomarkers such
as viral load, CD4+ cell count and C-reactive protein (CRP). Increased CRP and viral
loads were the strongest predictors of inadequate serum beta-carotene. However, the
direction of the association was not established. Fortunately, Baum and colleagues24
conducted a longer, 18-month study on 90 HIV-infected men to determine nutritional and
immune status over time and better understand causality. A significant drop in CD4+ cell
count occurred after serum vitamin A and B-12 became deficient. Additionally, they
found that when serum vitamin A, B-12 and zinc reached sufficient levels, CD4+ cell
multicenter AIDS Cohort Study that followed 310 men semiannually for over 10 years,
Tang and colleagues25 found that vitamin A was not associated with progression to AIDS,
nor was vitamin A or E associated with a decline in CD4+ cell count to less than
200/mm3. However, when vitamin E levels were studied in quartiles, “median AIDS free
time” in the highest quartile of vitamin E intake was 1.5 years greater than in the lower
quartiles and the adjusted risk of progression to AIDS was 34% lower in the highest
quartile of intake compared to the lowest quartile. In an additional study26 following the
same cohort of men, deficiency in serum B-12 preceded disease progression to AIDS
after adjusting for CD4+ cell count. Median time to first AIDS diagnosis was extended 4
years in those with adequate B-12 concentrations compared to those who were B-12
deficient, and there was an 87% increased risk of progression to AIDS in the serum B-12
deficient group. No association was found between B-6 and folate concentrations and
progression to AIDS. Further analysis 27 of dietary intake from the AIDS Cohort Study
revealed decreased risk of progression to AIDS with the highest intake levels of vitamins
C, thiamin, and niacin. Alternatively, increased zinc intake was associated with an
increased progression to AIDS. The highest and lowest intakes of vitamin A were
associated with a higher progression to AIDS.
Likewise, micronutrient deficiencies are common in individuals infected by HIV.
Studies20 have shown both insufficient dietary intake and inadequate serum levels of
some micronutrients in this population. For instance, Baum and colleagues 24, found
HIV-infected men were more likely to have serum deficiencies in vitamin B-6, B-12, A,
E and zinc than the non-infected control group. In addition, sufficient dietary intake of
inadequate serum concentrations of those micronutrients, suggesting that HIV-infected
people have increased needs above the RDA for certain micronutrients.30,34
In summary, several studies have demonstrated an association between poorer
health outcomes and micronutrient deficiencies in HIV-infected adults. Inferior
outcomes were associated with both serum micronutrient deficiencies and dietary intake
deficiencies. Research reveals an association between decreased immune status and
inadequate vitamin A, B-12, and zinc; increased mortality and inadequate selenium,
thiamin, niacin, riboflavin and B-6; and progression to AIDS and inadequate vitamins C,
E, thiamin, niacin and B-12. Some researchers35 believe that part of the contributory role
of these vitamins and minerals to the slowing of HIV progression are related to their
antioxidant effects and ability to reduce oxidative stress. Oxidative stress is considered
as an important factor in the pathogenesis of the HIV disease. Overall, research suggests
that sufficient micronutrient status may contribute to improved immune status and
survival.
Macronutrient Needs in HIV-Infected Individuals
The World Health Organization16 suggests asymptomatic HIV-infected
individuals increase calorie intake by 10% and those fighting infection increase calorie
intake by 20-30% because of increased energy expenditure. Furthermore, HIV-infected
children losing weight need to increase their calorie intake by 50-100%. However,
recommendations on the macronutrient composition for HIV-infected individuals are the
same as the recommendations for non-infected persons, without a greater need for
protein.4,16,31,36 The Institute of Medicine (IOM)37 recommends an Acceptable
65% of energy from carbohydrates, and 20 to 35% of energy from fat, in adults. The
AMDR for children and youths between the ages of 4 and 18 is between 25 and 35% of
energy from fat and between 10 and 30% of energy from protein. Carbohydrate
recommendations are the same for children and youths. With the advent of ART and the
increased risk of CVD in these patients, some researchers have suggested a decreased fat
intake.33 Miller and colleagues38 suggest that HIV-infected children with any “metabolic
dysfunction” keep fat intake at less than 30% of calories and saturated fat at less than
10% of calories. The Academy of Nutrition and Dietetics (AND) also emphasizes a diet
with less than 7% of calories from saturated fat, less than 1% of calories from trans fatty
acids, and less than 200 mg of cholesterol each day for HIV-infected individuals with
hyperlipidemia.36
Macronutrient needs vary in individuals infected with HIV and may also vary
based on disease complications. Energy needs are increased for the HIV-infected
individual, and are even greater with infection or if there has been weight loss. The
recommendation on the macronutrient breakdown of protein, carbohydrate and fat does
not differ for the HIV-infected individual; however, research has suggested limiting fat
intake and the AND has suggested limiting trans fat, saturated fat and cholesterol intake
in HIV-infected individuals with hyperlipidemia
Micronutrient Deficiencies and Needs of HIV-Infected Youths
Increased micronutrient needs may explain malnourishment and nutritional
deficiencies among HIV-infected children. Studies19,30 have shown that HIV infection
may cause micronutrient deficiencies in children. Steenkamp and colleagues19 showed
were vitamin A, vitamin D, zinc, and glutathione, which are all important in immune
regulation. In this study of children not receiving HAART, they found that children with
abnormally low levels of zinc and vitamin A had significantly lower CD4+ cell counts
and higher viral loads. They did not find any correlations between deficient nutrient
intake and growth impairment. Furthermore, Stephensen et al.30 concluded from the
REACH study, that vitamin C and vitamin E intake in HIV-infected youths must be
increased due to the greater utilization of these vitamins as a result of increased oxidative
stress with HIV-infection. Plasma ascorbate levels were marginally lower in subjects
with HIV, but intake of vitamin C was sufficient, suggesting “chronic immune
activation” lowers plasma ascorbate levels. The positive association found between
vitamin E intake and plasma alpha-tocopherol in HIV-negative subjects was not seen in
HIV-positive subjects, suggesting an increased need for vitamin E among youths with
HIV. Therefore, these studies19,30 have concluded that nutrition support along with
nutrient-dense foods and supplements are critical for the treatment of children with HIV.
Earlier studies4, 18 show conflicting results on micronutrient deficiencies.
Henderson and colleagues4 saw no differences in serum plasma micronutrients between
HIV-infected and non-HIV infected individuals, but suggested that there still may be an
increased need for micronutrients in HIV-infected children. Furthermore, they found no
greater micronutrient deficiencies in HIV infected children with growth retardation.
Fawzi18 suggests that overall, deficiencies of biochemical micronutrients are more
common among children infected with HIV than those uninfected.
Similar to adults infected with HIV, HIV-infected children also face micronutrient
limited on children, so far it reveals deficiencies in vitamins A, D, C, E and zinc.
Deficiencies in vitamins A and zinc have been associated with poorer immune status.
Furthermore, the chronic disease status of HIV-infected youths may result in increased
nutrients needs beyond the recommended intakes.
Current Studies Assessing Nutrient Intake of HIV-Infected Youths
While several studies have described the intake of HIV infected adults,21,39,40 few
have thoroughly described the nutritional intake of youths with HIV in the United States.
Of those that have studied dietary intake in children, very few3 have found a decreased
energy or macronutrient intake in HIV-infected children and adolescents;4,6,13,32 however,
deficient micronutrient intakes were uncovered.
Henderson and colleagues4 assessed dietary intake through 24-hour recalls in 38
children ages 2 to 11 years old. The study only described the intake of energy, protein,
zinc, selenium and vitamin A. Energy intake of the HIV infected children was
approximately 100% of the RDA, and protein intake was over 200% of the RDA. Only
zinc intake was low at less than 65% of the RDA. Zinc deficiency is related to changes
in immune function, which is a concern for this population. They found no significant
difference in intakes between HIV-positive and HIV-negative groups.
In one of the oldest studies41 looking at dietary intake of HIV-infected children,
Zuin and associates used 3-day food diaries to assess intakes of 33 HIV-infected children
compared to 16 HIV-negative children. The analysis only considered energy, protein,
calcium, phosphorus and iron intake. All HIV infected children had protein intake
greater than the RDA. There were no significant differences in energy and nutrient
those patients that were “symptomatic” had slightly decreased energy and nutrient
intakes, and they were also more at risk for acute complications, which led to an even
greater reduction of energy and protein intake.
In one of the REACH studies42, which spanned the U.S., the Block Food
Frequency Questionnaire (FFQ) was administered to 264 HIV-infected and 127
non-infected youths between the ages of 12 and 18 years of age. Energy, vitamin A, C, E,
iron, and zinc intake were assessed. No significant differences in nutrient intakes were
found between HIV-positive and HIV-negative youths. When compared to the Estimated
Average Requirements (EAR), 13-38% of the study population had inadequate intakes of
vitamins A, E and zinc. Moreover, there were no significant differences in intakes when
comparing patients by CD4+ cell counts. Another REACH study7 assessed “diet quality”
using a modified Healthy Eating Index (HEI), which assessed total fat, saturated fat,
cholesterol, sodium, and the 5 Food Guide Pyramid food groups. Poorer-quality diets
were seen in HIV-positive youths that had higher intakes of fat, saturated fat and
cholesterol compared to the non-infected controls.
In an HIV-infected cohort (n=126) aged 3-20 years old, Sharma et al.32 collected
an average of 5, 24-hour recalls per subject between 1995 and 2004. They found that the
dietary intake of the HIV infected children were similar to healthy children, and calorie
intake was 161% of estimated energy requirements (EER) in males and 140% of EER in
females. Fat, protein and carbohydrate intake were all within the AMDR. Though,
saturated fat intake was high at 12.6% and 12.7% of kilocalories for males and females,
respectively. Protein intake at the beginning of the study was 400% of the RDA, but
In a group of HIV-infected 4-17 year olds from Brazil, Tremeschin and
colleagues13 used an adapted semi-quantitative FFQ to assess dietary intake. They found
no difference in macronutrient and energy intakes between the positive and
HIV-negative groups, but they did see excessive dietary fat intake (38.5% of kilocalories)
amongst both groups. The authors concluded that the diet of this population must be
monitored due to the high lipid consumption and the risk of CVD in this group.
Few studies have thoroughly assessed micro- and macro-nutrient intakes of
youths with HIV. Deficient intakes were found for vitamins A, E and zinc, but none
were seen for the macronutrients. In contrast, excess intake of protein, fat, saturated fat
and cholesterol among HIV-infected youths was common.
HIV, Dyslipidemia, and Cardiovascular Disease Risk
Several studies38,43 emphasize a growing concern for an increased risk of CVD
due to lipid abnormalities, lipodystrophy, and vascular structural changes in children
infected with HIV. Lipid abnormalities, or dyslipidemia, among HIV-infected
individuals include one or more of the following: increased fasting total cholesterol (TC)
greater than 200mg/dl, serum triglycerides (TG) greater than 140mg/dl, or low-density
lipoprotein (LDL-C) greater than 130mg/dl, or decreased high-density lipoprotein
(HDL-C) less than 40mg/dl.13,38,43,44 These characteristics of high blood cholesterol are more
specifically called hyperlipidemia because the levels are elevated. Lipodystrophy is
loosely defined as fat redistribution in which there is an accumulation of visceral fat
around the stomach and back of the neck, and a wasting of fat in the extremities and
face.38 Changes in the vascular structure, or damage to the arterial walls, have been
brachial artery flow mediated dilation, a measure of arterial function, in those infected
with HIV.43 Chronic infection and inflammation in HIV-infected individuals seems to
increase atherosclerotic processes, which creates critical risk factors for CVD.
In a study10 looking at the effect of ART drugs on lipid changes, it was found that
10% of children on ART might require hyperlipidemia intervention due to the increased
risk of inflammation from HIV infection. In a cohort of 94 children ages 1 through 18
that had taken PI for at least 2 years, 62% had dyslipidemia.44 Miller and colleagues38
believe that an alteration in diet can positively affect HIV patients with “metabolic
dysfunction.” They suggested that well-balanced diets, high in fiber, micronutrients and
antioxidants might offset nutrient deficiencies. Furthermore, they advise these patients to
keep dietary fat at <30% of kilocalories and saturated fat at <10% of kilocalories.
In Brazil, Tremeschin and colleagues,13 studied 4 groups of 4-17 year olds that
were either HIV-positive on nucleoside or non-nucleoside reverse transcriptase inhibitors
(NRTI, NNRTI), PI for more than 2 months, PI for less than 2 months, or were healthy
HIV-negative children. They found no statistical differences in hyperlipidemia between
any of the groups, suggesting that the HAART regimen alone does not increase
dyslipidemia. On the other hand, they found that triglycerides were higher in those
taking PI. Both groups had excessive dietary lipid intake, which along with the increased
concern for CVD risk in children with HIV, suggests that the diet in this population needs
to be monitored.
Common carotid intima-media thickness (IMT), or the arterial wall thickness of
those arteries that supply the head and neck with blood, is a marker for atherosclerosis in
for CVD, in HIV-infected youths to determine their risk for CVD. Several risk factors
for CVD were studied in 83 HIV-infected children in London.43 Triglyceride, non-HDL
cholesterol, and apoB levels were all significantly higher in HIV-infected children when
compared to the control group. HDL cholesterol levels were significantly lower in the
HIV group. Furthermore, they found that children treated with ART had higher total
cholesterol than children not treated with ART. This study also looked at vasculature in
the groups and determined that the average of the right and left common carotid artery’s
IMT was significantly higher in the HIV infected children compared to the non-infected.
Those children on PI had significantly higher IMT than those not treated with PI.
Moreover, flow mediated dilation (FMD) of the brachial artery was lower in HIV
infected children compared to controls; meaning that the HIV infected children had
increased arterial stiffness. PI patients had significantly lower FMD than non-PI patients.
The authors concluded that vascular changes are occurring at young ages in the HIV
infected population, supporting the concern for the increased risk of atherosclerosis and
CVD among these patients. A study by Vigano and colleagues45 in young adults and
adolescents with HIV supported these results. They found that the common carotid IMT
was higher, after controlling for confounders, in the HIV-infected group than in the
controls that were matched for age, gender and BMI. IMT was higher among those
patients on ART.
Shah et al.40 looked at the role of diet in dyslipidemia in 51 HIV-infected adults
using 3-day food records to assess macronutrient intake. Despite, the population being
adults, this study is worth noting due to the correlations made between diet and lipid
increased total cholesterol, triglycerides, and non-HDL cholesterol. Trans fats were
positively correlated with triglyceride levels. Moreover, soluble fiber intake, which was
low, was negatively correlated with total cholesterol, triglycerides, and non-HDL
cholesterol. They did not find any associations between lipid levels and omega-3 fatty
acids, cholesterol, and saturated fat intake. Of the 51 subjects, all with exposure to PI
therapy, 50% had either high or very high triglycerides, 50% had either borderline-high
total cholesterol or high total cholesterol, and 86% of men and 68% of women had LDL
> 130 mg/dL.
Studies have also assessed the acute myocardial infarction (AMI) rates among
HIV-infected adults to determine outcomes of CVD risk factors. Triant and colleagues46
looked at 3,851 HIV-infected patients and 1,044,589 non-HIV patients at Boston
hospitals between 1996 and 2004. The amount of AMI events was two times greater in
the infected patients compared to the controls. This study also found that the
HIV-patients had significantly higher rates of hypertension, diabetes and dyslipidemia.
Unfortunately, there are insufficient studies to determine the adverse outcomes of the
markers of CVD risk in children.38
Several studies have revealed that HIV-infected individuals have many increased
risk factors for atherosclerosis and CVD. Dyslipidemia, increased arterial stiffness,
thickening of the arteries, and increased AMI events have commonly been seen in HIV
research. Research has also suggested that a well-balanced diet with proper micro- and
Literature Review Summary
Research has revealed a number of nutritional issues affecting HIV-infected
individuals. Micronutrients play an important role in immune function, and studies show
that lower micronutrient intakes and serum levels are associated with disease
advancement and mortality in HIV-infected individuals. While energy needs are
increased for the HIV-infected individual, there is not a need for a different macronutrient
composition of protein, carbohydrate or fat. However, research has suggested limiting fat
intake, trans fat, saturated fat and cholesterol intake in HIV-infected individuals with
hyperlipidemia. Hyperlipidemia is common among HIV-infected individuals and several
studies have revealed many increased risk factors for atherosclerosis and CVD.
Dyslipidemia, increased arterial stiffness, thickening of the arteries, and increased AMI
events were more commonly seen in HIV-infected individuals than in those not infected.
Children with HIV also face micronutrient deficiencies that compromise immune and
nutritional status, and research suggests that the chronic disease status of HIV-infected
youth may result in increased nutrients needs beyond the recommended intakes.
Unfortunately, few studies have thoroughly assessed micro- and macro-nutrient intakes
of youth with HIV. The few studies that have assessed intakes, found energy and
macronutrient deficiencies were uncommon. In contrast, excess intake of protein, fat,
saturated fat and cholesterol was common among HIV-infected youths.
Research suggests that sufficient micronutrient status may contribute to improved
immune status and survival and that a well-balanced diet with the proper macronutrient
intake may help improve CVD risk factors in the HIV-population. Additionally, The
meeting micronutrient needs in HIV-infected individuals as opposed to taking
supplements. Therefore, determining deficiencies in micronutrient intake among children
and adolescents infected with HIV will provide valuable information regarding the
nutrition counseling that may be needed to provide these youths with healthier and longer
lives. Furthermore, given the research showing HIV-infected individual’s increased risk
factors of CVD, it is important to know whether HIV-infected children and youths follow
a heart healthy diet, and if the intake of nutrients such as fats and fiber influence
nutritional markers of CVD, such as lipid levels. Only one study was found which
19
CHAPTER III
METHODS AND PROCEDURES
Participants
HIV-Infected
200 documented HIV-infected children, adolescents and young adults (ages 1-25)
enrolled in the Infectious Disease Program (IDP) at the Ponce de Leon HIV Clinic of the
Grady Health System in Atlanta, Georgia were recruited for the original study titled,
“Vitamin D and cardiovascular biomarkers in HIV-infected children and young adults”.
Inclusion criteria
All individuals, 1-25 years of age, with documented HIV-1 infection (positive
HIV-1 antibody test, confirmed by western blot), who obtain their medical care at the
IDP (Ponce Center) were eligible for the study.
Exclusion criteria
Patients who had scheduled “sick visit” appointments, or were found to be acutely
ill during their regular visits, were not eligible at that visit, and were re-evaluated at their
next routine or follow-up visit for enrollment in the study. “Acutely ill” was defined as
having an oral or axillary temperature >100.4°F, significant upper or lower respiratory
tract symptoms, acute otitis media, pharyngitis, or other notable signs or symptoms
consistent with acute illness or opportunistic infection that would likely interfere with
inflammatory marker measurements. Once resolution of signs and symptoms had been
shown for at least one month, the patient was again eligible for the study. Stable or
noted in the data collection forms for accurate data analysis. Children under 1 year of age
were ineligible due to an immature immune system and inability to interpret
inflammatory marker levels at this age.
Recruitment of HIV-infected subjects
Subjects were recruited in several ways, including (1) recruitment mailing; (2)
phone call prior to scheduled appointment; (3) approached by study staff during routine
medical appointment; and (4) case manager/physician referrals. A flyer was mailed to all
potentially eligible patients at the IDP at one time with a general description of the study
and a copy of the informed consent. These patients had regular appointments scheduled
at the IDP within the upcoming 3 months (as soon as within 1 week or as long as 3
months from the time of the flyer mailing). Study staff also called patients a few days
before their scheduled appointments to tell them about the study and ask them to arrive at
their appointments after at least 8 hours of fasting if interested in learning more about the
study for potential participation. Patients/families were approached during their routine
visits by study staff, and if interested and eligible, were consented and enrolled into the
study. Case managers and patient physicians were also made aware of the study by a
general flyer, and told patients about the study. If patients were interested, they were
referred to the study staff. In all cases, subjects were given ample time to review the
consent forms and ask questions.
Controls
A small median age-matched control group (n=50) with similar proportions of
sex and race was recruited and enrolled for comparison to the HIV-infected group. The
HIV-related laboratory and clinical information were not collected. Controls were
recruited from the clinic, as either uninfected patients who received their regular health
care at the clinic, or were uninfected siblings or relatives of the HIV-infected patients, or
from physician referrals.
Inclusion criteria
Healthy uninfected children and young adults, 1-25 years of age, were included.
Exclusion criteria
Individuals with current or recent infectious or inflammatory illness, known
chronic disease, hypertension, or receiving any prescription medication known to affect
inflammatory or endothelial activation markers were excluded. Individuals were
excluded if they were at high-risk of having or acquiring HIV by either (1) engaging in
sexual activity with a known HIV partner currently or previously without no intercurrent
negative HIV test, (2) sharing needles for drug injection currently or previously without
no intercurrent negative HIV test; (3) have had another sexually transmitted disease
without acquiring HIV testing; or (4) the investigator or subject feels that he/she may be
infected and has not had a negative HIV test. Subjects 13 years of age or older were
screened for HIV before enrollment with the OraQuick Advance Rapid HIV test.
Recruitment of controls
Healthy volunteers were recruited in several ways, including (1) case
manager/physician referrals of uninfected patients who receive their routine medical care
at the IDP or of relatives of the HIV-infected patients seen at the IDP; (2) uninfected
patients seen at the IDP for their routine medical care and/or their guardians were
and/or guardians were told during their regular appointments and in the recruitment
mailing that we are looking for uninfected healthy volunteers so they can refer their
healthy friends or relatives. Volunteers were given copies of the informed consent forms
and verbal information about the study. Interested volunteers returned to the clinic for a
scheduled research visit. In all cases, volunteers were given ample time to review the
consent forms and ask questions.
All Participants
Consent and confidentiality
Study staff fully explained all assessments to the patient and/or legal caregiver,
and asked for their written consent to participate. All parents or legal guardians and
subjects ≥18 years of age provided written informed consent to participate in the study,
and those subjects 17 years of age signed the written consent along with their parent or
legal guardian. Subjects ages 6-10 years gave verbal assent and those 11-16 years gave
written assent. Details about the study, including its benefits and potential risks were
explained to the patients or their parent/guardian.
All information regarding the patient remained confidential to the extent allowed
by law. Unique numeric subject numbers were used for data entry.
Compensation
Subjects received $50 after completion of all study procedures to compensate for
time and transportation costs (with the exception of the follow-up 24-hour food
consumption recalls). If a subject had to return to the clinic for a separate fasting blood
Data Collection
Data collection began May of 2010 and was completed in January of 2012.
Clinical measurements collected include weight, height, standardized waist and hip
measurements (based on procedure recommendations from the Metabolic Study Group of
the AIDS Clinical Trials Group), alcohol intake, smoking habits, physical activity level,
family history of CVD, CD4 counts, HIV-1 RNA (viral load) and fasting lipoprotein
profile (total cholesterol, LDL cholesterol, HDL cholesterol, and triglycerides).
Information was also collected on medication use, demographics, and medical conditions.
Extensive medical chart evaluations were conducted to collect detailed information on
past and current medical diagnoses, ART use and history (including calculation of
cumulative exposure to each class of antiretrovirals), CD4 cell count nadir, current ART
and non-ART medication use, HIV stage based on CDC classification system, calculation
of HIV duration in months, and methods of HIV acquisition (vertical or behavioral).
Relevant medical information on the control group was collected through interview.
Laboratory Assessments
Subjects fasted for ≥8 hours prior to blood sampling. Plasma was extracted and
stored at -80° C until analysis without prior thawing.
Future measurements
Extra plasma was obtained and stored for measurements of additional
micronutrient levels and inflammatory/endothelial activation markers for future, related
studies. Stored samples were labeled with subject number only. Subject study numbers
Dietary intake
Each subject or guardian completed an age-appropriate, semi-quantitative, Block
Food Frequency Questionnaire (FFQ), and a total of four, 24-hour food consumption
recalls. One, 24-hour recall was obtained for each season of the year, for each subject, to
total four recalls per subject. Food intake over the last 24 hours was reported by the
subject and amounts were entered into Nutrition Data System for Research (NDS-R),
available through the Clinical Interaction Network (CIN) of the Atlanta Clinical &
Translational Science Institute (ACTSI), which is a dietary analysis program designed for
the collection and analysis of 24-hour dietary recalls. NDS-R provided a detailed analysis
of macro- and micro-nutrient intake in units per day. The 24-hour food consumption
recalls were either obtained by telephone or on subsequent routine visits to the clinic, by
trained investigators.
Research Design
The design of the current study was cross-sectional and exploratory, intending to
fully describe the nutrient intake of HIV-infected youth. The study protocol was
approved by Emory University’s Institutional Review Board (IRB FWA# 00005792;
registration #s 569 & 570). This study analyzed the aforementioned data that was
previously collected for the original study that examined vitamin D’s role in
cardiovascular health among 200 HIV-infected patients and 50 controls, ages 1-25. The
original study specifically looked at inflammatory cytokines and endothelial activation
markers, and the Block FFQ was used to assess vitamin D status.
The current study assessed nutrient intakes, using the 24-hour recalls that were
recommendations by the American Heart Association for the prevention of CVD. The
study used the same sample population as the original study including all subjects that
completed at least two, 24-hour recalls. Subjects with less than two, 24-hour recalls
collected were excluded. Also excluded were 24-hour recalls that were obvious outliers
and the subjects were suspected of over- or under-reporting dietary intake for that
specific recall (less than 500 kilocalories or greater than 5000 kilocalories in one 24-hour
period). The recalls included in analysis were collected every 3 months for one year to
capture seasonal changes in dietary intake, as well as day-to-day variation in diet. The
micro- and macronutrient intakes of the 24-hour recalls were compared to the DRIs and
AMDR given the age of the child or adolescent on the day of intake. DRI varies
depending on age and gender. Percent of DRI was then determined based on the youth’s
IOM life stage group (age and gender) on the date of intake. The percent of DRI for each
intake date was then averaged for each individual subject. The average micro- and
macronutrient intake and percent DRI was the basis for all dietary analysis of this study.
The IOM recommends using at least two, 24-hour recalls on nonconsecutive days to
assess usual intake.47
Intake of all micro- and macronutrients were assessed to see if the participants
were meeting the RDA, AI, or AMDR for each individual nutrient. The IOM47
recommends comparing micronutrient intake to the Estimated Average Requirement
(EAR) for the general population. However, the World Health Organization recommends
that children and adults with HIV meet at least the Recommended Dietary Allowance
(RDA);16 therefore, intake of micronutrients were compared to the RDA. For those
composition of macronutrient intake was compared to the AMDR.
The study population was separated into two groups: HIV-infected youth (HIV+)
and HIV-negative controls (HIV-) with similar demographics. Calorie, BMI,
waist-to-hip ratios, lipid profiles, and macro- and micronutrient intake were compared between the
groups. Nutrient intake was also compared between race and gender. Furthermore, fat,
fiber, trans fatty acids, saturated fatty acids, and cholesterol intake was compared to the
recommendations of the American Heart Association. Fasting lipid levels, including total
cholesterol, LDL-cholesterol, HDL-cholesterol and triglycerides, were individually
compared between groups and against standards of 200mg/dL, 130mg/dL, 40mg/dL, and
140mg/dL, respectively. Associations between nutrient intake and BMI, CD4+ counts,
viral loads, and lipid profiles were analyzed.
Statistical analysis
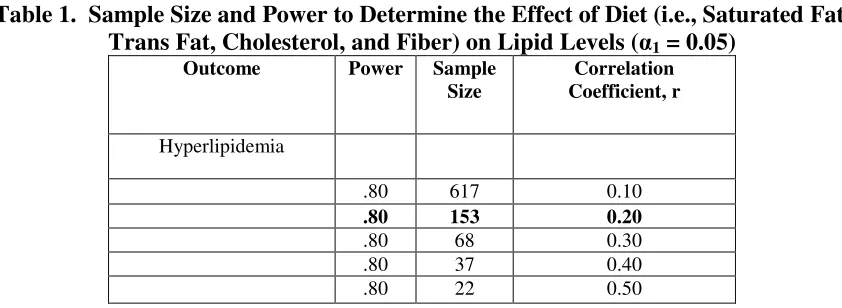
Sample Size and Power Considerations: Table 1 provides power calculations for
correlation.48 Approximately 153 HIV-infected children provides 80% statistical power to
[image:41.612.113.534.486.640.2]a correlation coefficient of 0.20.
Table 1. Sample Size and Power to Determine the Effect of Diet (i.e., Saturated Fat, Trans Fat, Cholesterol, and Fiber) on Lipid Levels (α1 = 0.05)
Outcome Power Sample Size
Correlation Coefficient, r
Hyperlipidemia
.80 617 0.10
.80 153 0.20
.80 68 0.30
.80 37 0.40
.80 22 0.50
Descriptive statistics, such as mean ± SD, were used to describe micronutrient and
groups. Frequencies tables were used to describe gender, race, ART use, and deficient
nutrient intakes. All variables were checked for normality. If variables were not
normally distributed, log transformations were performed and normality was again
assessed. If the variables were not normally distributed after log transformations,
non-parametric tests were used for analysis. The subject’s average intake was compared to
the DRI using one-sample t-tests, comparing the % DRI of the deficient micronutrient
intakes to a test value of 1.0 or 100% DRI. For between-group comparisons of nutrients,
BMI, age, waist measurements, and lipids, normally distributed variables were compared
using independent t-tests, and non-normally distributed variables were compared using
Mann-Whitney U tests. Lipid levels (total cholesterol, LDL, HDL, and triglycerides)
were compared to healthy standards using one-sample t-tests. One-way ANOVA and
Bonferroni post-hoc comparisons were used to determine differences between race in
nutrient intakes. Pearson’s correlation coefficient (parametric) or Kendall’s Tau
(non-parametric) looked at the associations between nutrient intake and age, BMI, lipid levels
and HIV-related factors. Additional regression analysis was not performed on
correlations, as only weak associations were found. A P value < 0.05 was considered
28
CHAPTER IV
RESULTS
A total of 674 24-hour recalls were analyzed. 558 recalls were analyzed for the
HIV+ group and 113 recalls were analyzed for the control group. The HIV+ group had 75
subjects with 4 recalls (43% of subjects), 58 subjects with 3 recalls (33% of subjects),
and 42 subjects with 2 recalls (24% of subjects). On average, there were 3.2 recalls per
subject in the HIV+ group. The control group had 7 subjects with 4 recalls (16% of
subjects), 13 subjects with 3 recalls (30% of subjects), 23 subjects with 2 recalls (53% of
subjects). On average there were 2.6 recalls per subject in the control group.
Study Population
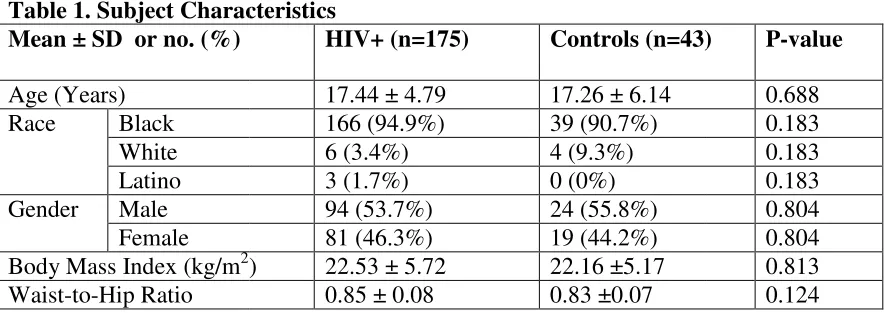
Upon excluding all subjects with less than two 24-hour recalls, 175 HIV-infected
subjects and 43 healthy controls were included in the analysis. Subject characteristics are
summarized in Table 1. Antiretroviral (ART) medication use is summarized in Figures 1
and 2, and perinatal infection frequencies are given in Figure 3.
Age was not normally distributed and could not be log transformed.
Mann-Whitney U test showed that there was no significant difference between groups for age
(P=0.688). The range of age for HIV-infected was 1.46 to 24.41 years. The age range
for the controls was 5.5 years to 26.39 years.
Chi-squared tests were used to determine if there was a significant difference
between groups for race and gender, as these are categorical variables. There was no
significant difference in race (P=0.183) or gender (P=0.804) between the HIV+ group
BMI was not normally distributed. Upon log transformation, BMI was normally
distributed and an independent t
mean BMI between groups (P=0.716).
Waist-to-hip ratios were normally distributed and independent t
[image:44.612.104.546.212.369.2]difference between the groups (P=0.124).
Table 1. Subject Characteristics Mean ± SD or no. (%)
Age (Years)
Race Black
White Latino Gender Male
Female Body Mass Index (kg/m2) Waist-to-Hip Ratio
Figure 1.
BMI was not normally distributed. Upon log transformation, BMI was normally
distributed and an independent t-test showed that there was no significant difference
mean BMI between groups (P=0.716).
hip ratios were normally distributed and independent t-tests revealed no
difference between the groups (P=0.124).
Subject Characteristics
HIV+ (n=175) Controls (n=43)
17.44 ± 4.79 17.26 ± 6.14
166 (94.9%) 39 (90.7%)
6 (3.4%) 4 (9.3%)
3 (1.7%) 0 (0%)
94 (53.7%) 24 (55.8%)
81 (46.3%) 19 (44.2%)
) 22.53 ± 5.72 22.16 ±5.17
0.85 ± 0.08 0.83 ±0.07
BMI was not normally distributed. Upon log transformation, BMI was normally
test showed that there was no significant difference in
tests revealed no
Controls (n=43) P-value
Figure 2.
Dietary Intake of HIV-infected Subjects and Controls
Energy intake is summarized in Table 2. Total calorie (energy) intake from the
four 24-hour recalls, over the course of the study, was averaged for each subject. Energy
intake was normally distributed; therefore, an independent t-test was used to calculate
any difference in means between the HIV+ and HIV- group. There was no significant
[image:46.612.102.549.247.297.2]difference between groups in mean energy intake.
Table 2. Energy Intake
Mean ± SD HIV+ HIV- P-value
Energy (kcal) 1953.9 ± 610.87 1990 ± 540.8 0.723
Median Energy 1859 kcal 1997 kcal
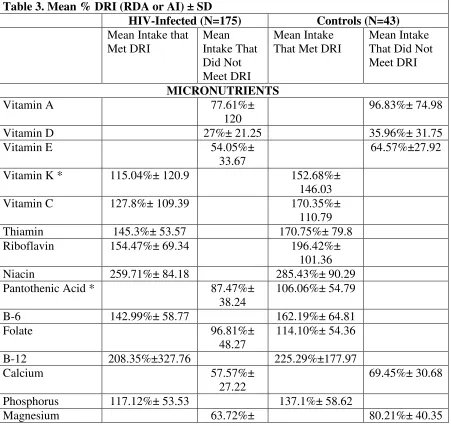
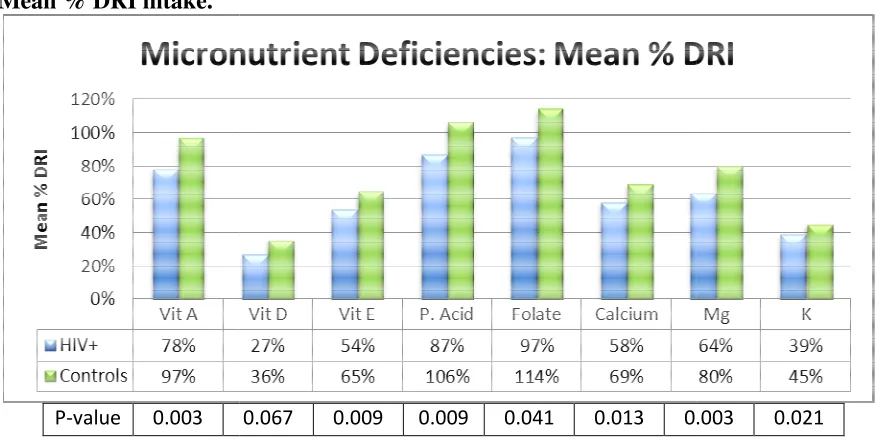
Micronutrient intake
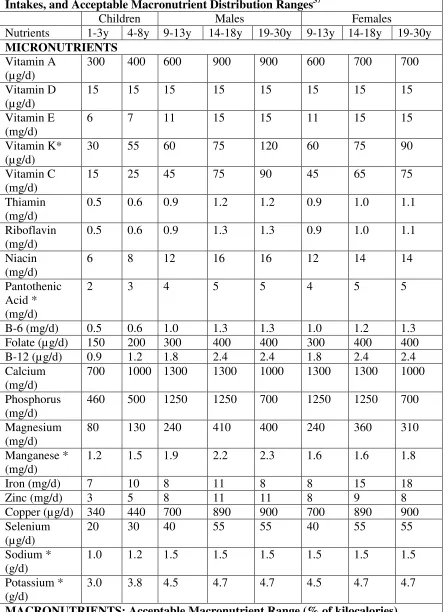
A summary of the mean percent of DRI intake for the nutrients analyzed is
presented in Table 3. For the nutrients analyzed, the DRIs recommended by the IOM are
given in Table 4 for a reference. For the HIV-infected group, mean micronutrient intake
was less than 100% of the DRI for vitamin A (77.61% ± 120), vitamin D (27% ± 21.25),
vitamin E (54.05% ± 33.67), pantothenic acid (87.47%± 38.24), folate (96.81%± 48.27),
calcium (57.57% ± 27.22), magnesium (63.72% ± 30.4), and potassium (39.49% ±
14.09). Mean intake of sodium (236.27% ± 83.08) was greater than the recommended
DRI. For the HIV+ subjects, all variables were significantly different than the 100% DRI
with P-values <0.001.
For the controls, micronutrient intake was less than 100% of the DRI for vitamin
A (96.83%± 74.98), vitamin D (35.96% ± 31.75), vitamin E (64.57% ±27.92), calcium
(69.45% ± 30.68), magnesium (80.21%± 40.35), and potassium (44.95% ± 12.70), and
consumed suboptimally were significantly different than the 100% DRI with
P-values<0.001. Median nutrient intake can be found in Table 4.
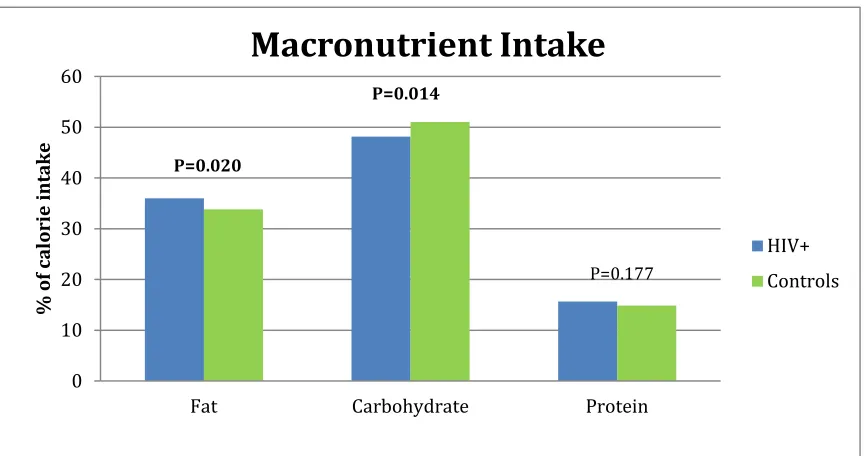
Macronutrient Intake
Mean percent calories from carbohydrate, fat, and protein fell within the
acceptable macronutrient distribution range (AMDR) for the control group. Mean
percent calories from carbohydrate and protein fell within the AMDR for the HIV+
group. Mean fat intake significantly exceeded the AMDR for HIV-infected subjects
[image:47.612.97.548.294.720.2](36.02% ± 5.67, P=0.018) only. See Figure 4.
Table 3. Mean % DRI (RDA or AI) ± SD
HIV-Infected (N=175) Controls (N=43)
Mean Intake that Met DRI Mean Intake That Did Not Meet DRI Mean Intake That Met DRI
Mean Intake That Did Not Meet DRI
MICRONUTRIENTS
Vitamin A 77.61%±
120
96.83%± 74.98
Vitamin D 27%± 21.25 35.96%± 31.75
Vitamin E 54.05%±
33.67
64.57%±27.92
Vitamin K * 115.04%± 120.9 152.68%±
146.03
Vitamin C 127.8%± 109.39 170.35%±
110.79
Thiamin 145.3%± 53.57 170.75%± 79.8
Riboflavin 154.47%± 69.34 196.42%±
101.36
Niacin 259.71%± 84.18 285.43%± 90.29
Pantothenic Acid * 87.47%±
38.24
106.06%± 54.79
B-6 142.99%± 58.77 162.19%± 64.81
Folate 96.81%±
48.27
114.10%± 54.36
B-12 208.35%±327.76 225.29%±177.97
Calcium 57.57%±
27.22
69.45%± 30.68
Phosphorus 117.12%± 53.53 137.1%± 58.62
30.4
Manganese * 114.84%± 53.57 132.97%± 48.87
Iron 126.63%± 69.72 131.21%± 66.78
Zinc 108.33%± 46.89 111.72%± 41.63
Copper 133.67%± 174 151.89%± 95.56
Selenium 206.61%± 77.5 228.41%± 85.83
Sodium * 236.27%±
83.08
247.15%± 74.3
Potassium * 39.49%±
14.09 44.95%± 12.70 MACRONUTRIENTS Intake Within AMDR Intake Exceeds AMDR Intake Within AMDR Intake Exceeds AMDR Mean % kcal from
FAT
36.02%± 5.67
33.8%± 5.07
Mean % kcal from CHO
48.16%± 7.02 51.03%± 5.57
Mean % kcal from PRO
15.65%± 3.55 14.87%± 2.6
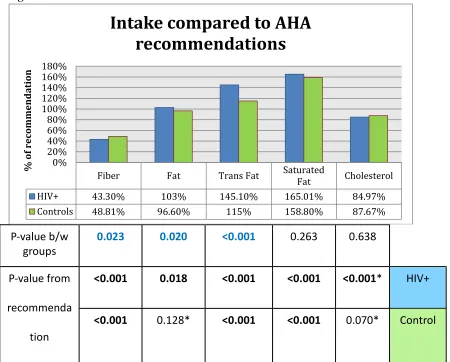
AMERICAN HEART ASSOCIATIONS RECOMMENDATIONS
Met Did not
meet
Met Did not meet
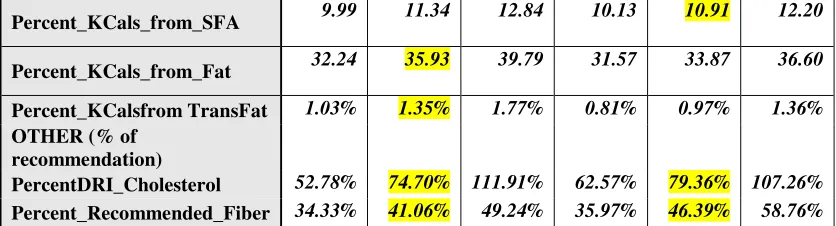
Mean % kcal from saturated fat (% of 7% recommendation) 11.55% ± 2.3 (165.01%± 32.8 ) 11.12%± 2.18(158.8%± 31.1)
Mean % kcal from TRANS- fat (% of 1% recommendation) 1.45%± 0.55 (145.10%) 1.15%± 0.57 (115%)
Cholesterol (% of 300mg)
84.97%± 45.03 87.67%± 43.56
Fiber (% of recommended intake (14g/1000kcal)) 43.3% ± 13.7 48.81%± 15.67
Table 4. DRIs of Nutrients Analyzed: Recommended Dietary Allowances, Adequate Intakes, and Acceptable Macronutrient Distribution Ranges37
Children Males Females
Nutrients 1-3y 4-8y 9-13y 14-18y 19-30y 9-13y 14-18y 19-30y MICRONUTRIENTS
Vitamin A (µg/d)
300 400 600 900 900 600 700 700
Vitamin D (µg/d)
15 15 15 15 15 15 15 15
Vitamin E (mg/d)
6 7 11 15 15 11 15 15
Vitamin K* (µg/d)
30 55 60 75 120 60 75 90
Vitamin C (mg/d)
15 25 45 75 90 45 65 75
Thiamin (mg/d)
0.5 0.6 0.9 1.2 1.2 0.9 1.0 1.1
Riboflavin (mg/d)
0.5 0.6 0.9 1.3 1.3 0.9 1.0 1.1
Niacin (mg/d)
6 8 12 16 16 12 14 14
Pantothenic Acid * (mg/d)
2 3 4 5 5 4 5 5
B-6 (mg/d) 0.5 0.6 1.0 1.3 1.3 1.0 1.2 1.3
Folate (µg/d) 150 200 300 400 400 300 400 400
B-12 (µg/d) 0.9 1.2 1.8 2.4 2.4 1.8 2.4 2.4
Calcium (mg/d)
700 1000 1300 1300 1000 1300 1300 1000
Phosphorus (mg/d)
460 500 1250 1250 700 1250 1250 700
Magnesium (mg/d)
80 130 240 410 400 240 360 310
Manganese * (mg/d)
1.2 1.5 1.9 2.2 2.3 1.6 1.6 1.8
Iron (mg/d) 7 10 8 11 8 8 15 18
Zinc (mg/d) 3 5 8 11 11 8 9 8
Copper (µg/d) 340 440 700 890 900 700 890 900
Selenium (µg/d)
20 30 40 55 55 40 55 55
Sodium * (g/d)
1.0 1.2 1.5 1.5 1.5 1.5 1.5 1.5
Potassium * (g/d)
3.0 3.8 4.5 4.7 4.7 4.5 4.7 4.7
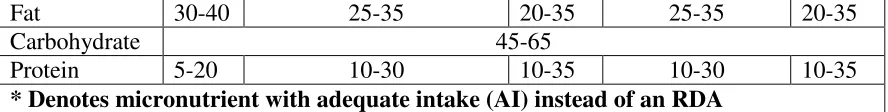
Fat 30-40 25-35 20-35 25-35 20-35
Carbohydrate 45-65
Protein 5-20 10-30 10-35 10-30 10-35
[image:50.612.103.547.73.129.2]* Denotes micronutrient with adequate intake (AI) instead of an RDA
Table 5. Dietary Median Intake for the HIV+ and Control Groups
HIV+ Controls Percentiles Percentiles 25 Median 75 25 Median 75 MICRONUTRIENTS (% DRI)
PercentDRI_A 37.41% 58.61% 81.43% 54.07% 77.22% 110.99%
PercentDRI_D 12.41% 21.44% 36.36% 16.69% 27.46% 46.98%
PercentDRI_E 33.40% 45.00% 65.19% 43.21% 63.15% 78.32%
PercentDRI_K 48.59% 74.61% 129.76% 62.09% 96.47% 148.06%
PercentDRI_C 53.58% 97.50% 182.03% 93.01% 136.27% 211.44%
PercentDRI_Thiamin 107.69
%
139.33% 179.13% 118.77% 151.64% 198.23%
PercentDRI_Riboflavin 112.21% 138.08% 179.73% 122.88% 154.99% 230.33%
PercentDRI_Niacin 200.73
%
252.31% 314.30% 232.28% 272.68% 339.92%
PercentDRI_Pantothenic Acid
62.20% 79.59% 103.09% 72.55% 95.16% 111.00%
PercentDRI_B6 105.08
%
130.00% 173.48% 116.81% 154.29% 190.04%
PercentDRI_Folate 66.88% 88.33% 114.61% 71.98% 103.34% 138.04%
PercentDRI_B12 97.93% 155.46% 213.56% 129.72% 174.83% 296.38%
PercentDRI_Calcium 40.15% 53.44% 67.88% 52.79% 57.58% 73.84%
PercentDRI_Phosphorus 80.86% 107.88% 143.16% 89.51% 119.82% 167.97%
PercentDRI_Magnesium 43.05% 55.81% 73.34% 48.00% 68.81% 102.31%
PercentDRI_Manganese 80.07% 104.96% 130.88% 89.45% 124.25% 166.39%
PercentDRI_Iron 72.87% 115.70% 162.75% 68.96% 124.14% 164.18%
PercentDRI_Zinc 75.93% 100.49% 129.35% 77.93% 102.80% 137.48%
PercentDRI_Copper 82.56% 107.89% 140.83% 98.16% 133.67% 177.16%
PercentDRI_Selenium 149.26% 199.33% 251.20% 163.85% 222.59% 276.05%
PercentAI_Sodium 178.12
%
219.26% 285.18% 196.06% 239.12% 282.98%
PercentDRI_Potassium 29.62% 37.11% 47.14% 35.66% 45.66% 54.03%
MACRONUTRIENTS (% of kcals)
Percent_KCal_from_CHO 43.51 48.09 53.56 47.72 51.98 53.85