Copyright © 2004, American Society for Microbiology. All Rights Reserved.
Use of DNA Microarrays for Rapid Genotyping of TEM
Beta-Lactamases That Confer Resistance
Verena Grimm,
1Satoshi Ezaki,
1Milorad Susa,
2Cornelius Knabbe,
2Rolf. D. Schmid,
1and Till T. Bachmann
1*
Institute of Technical Biochemistry, University of Stuttgart,1and Department of Clinical Chemistry
and Laboratory Medicine, Robert Bosch Hospital,2Stuttgart, Germany
Received 14 January 2004/Returned for modification 15 March 2004/Accepted 5 May 2004
Standard clinical procedures for pathogen resistance identification are laborious and usually require 2 days of cultivation before the resistance can be determined unequivocally. In contrast, clinicians and patients face increasing threats from antibiotic-resistant pathogenic bacteria in terms of their frequencies and levels of resistance. A major class of microbial resistance stems from the occurrence of beta-lactamases, which, if mutated, can cause the severe extended-spectrum beta-lactamase (ESBL) or inhibitor-resistant TEM (IRT) phenotype, which cause resistance to extended-spectrum cephalosporins, monobactams, and beta-lactamase inhibitors. We describe an oligonucleotide microarray for identification of the single nucleotide polymorphisms (SNPs) of 96% of the TEM beta-lactamase variants described to date which are related to the ESBL and/or IRT
phenotype. The target DNA, originating fromEscherichia coli,Enterobacter cloacae, andKlebsiella pneumoniae
cells isolated from clinical samples, was amplified and fluorescently labeled by PCR with consensus primers in the presence of cyanine 5-labeled nucleotides. The total assay, including PCR, hybridization, and image analysis, could be performed in 3.5 h. The microarray results were validated by standard clinical procedures. The microarray outperformed the standard procedures in terms of assay time and the depth of information provided. In conclusion, this array offers an attractive option for the identification and epidemiologic moni-toring of TEM beta-lactamases in the routine clinical diagnostic laboratory.
Among the most important types of resistance to be de-tected is that due to the extended-spectrum beta-lactamases (ESBLs). ESBLs belong to a group of plasmid-mediated serine beta-lactamases (i.e., TEM, SHV, and OXA) and are found in many different species of the familyEnterobacteriaceae:
Pseu-domonas aeruginosa, Haemophilus influenzae, andNeisseria
gonorrhoeae(5). The TEM ESBL subtypes are derived from
one parental sequence (TEM-1) and differ by only a few amino acid substitutions (for the amino acid sequences of the TEM extended-spectrum and inhibitor-resistant beta-lactamases, see http://www.lahey.org/Studies/temtable.asp). They evolve to have a broader spectrum of antibiotic resistance. Derivatives of the classical TEM and SHV enzymes also show an inhibitor-resistant TEM (IRT) phenotype, which confers resistance to beta-lactamase inhibitors, such as clavulanic acid. Conven-tional methods for resistance detection rely on phenotypic identification based on bacterial growth inhibition in disk dif-fusion or dilution tests, which are cost-effective but which usu-ally require 2 days (14). However, most clinical therapeutic failures associated with ESBL infections are due to serious problems with interpretation of the results of dilution and disk diffusion tests (10, 11). In order to improve the accuracies of screening tests, it is indispensable to perform additional con-firmatory susceptibility tests by testing the activities of multi-ple antibiotics in combination with beta-lactamase inhibitors against the isolates, which requires an additional day of labo-ratory work (16). As the determination of antibiotic
suscepti-bility is crucial for a positive outcome of antimicrobial therapy and significantly influences subsequent procedures and actions, such as the isolation of patients to prevent the spread of ESBLs, a faster and more accurate detection method is desir-able.
Genotypic analysis of putative ESBL-producing strains can be a promising alternative for the second, confirmatory step of ESBL detection. Unambiguous identification of the TEM vari-ant, as determined by genotyping, will define for most of the ESBL isolates a specific substrate pattern, which can be con-sidered for determination of the appropriate antibiotic treat-ment. Additionally, the genotyping of resistance can be used for the reliable surveillance of multiresistant bacteria in wards or hospitals. A number of molecular biology-based methods for determination of ESBL resistance have already been developed (7). Biotinylated oligonucleotide probes (19) or ra-diolabeled primers (3) were used to discriminate between a limited number of ESBL variants. PCR-restriction fragment length polymorphism analysis (2) and PCR–single-strand con-formational polymorphism analysis (14) have also been used to identify some of the relevant point mutations. The major draw-back of all these assays is that they distinguish between just a few variants due to their limited multiplexing capabilities. A promising genotyping method with a high multiplexing power is provided by the DNA microarray technology. Diagnostic DNA microarrays have been described, for example, for resis-tance genotyping of mycobacteria (20) and N. gonorrhoeae
isolates (4); but the genotyping of TEM beta-lactamases, which requires the parallel detection of more than 40 single nucleo-tide polymorphism (SNP) sites, has not yet been described.
In the present study an oligonucleotide microarray for the identification of SNPs was constructed. The microarray allows
* Corresponding author. Mailing address: Institute of Technical Biochemistry, University of Stuttgart, Allmandring 31, Stuttgart, Ger-many. Phone: 49 (0) 711 685 3197. Fax: 49 (0) 711 685 3196. E-mail: itbtba@po.uni-stuttgart.de.
3766
on May 15, 2020 by guest
http://jcm.asm.org/
Downloaded from
on May 15, 2020 by guest
http://jcm.asm.org/
Downloaded from
on May 15, 2020 by guest
http://jcm.asm.org/
the discrimination of 102 of the 106 published TEM beta-lac-tamase sequences. By using a single consensus primer pair, all variants of the blaTEM gene could be amplified and simulta-neously analyzed for their representative SNP positions within 3.5 h.
MATERIALS AND METHODS
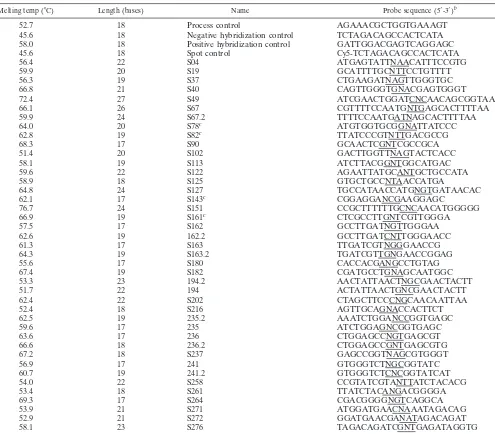
Probe design.Oligonucleotide probes of various lengths (17 to 27 bases) (Table 1) were designed to detect SNPs (ESBL or IRT, or both; Table 2) at 41 positions. The probes were designed with the SNP at the central base within the probe sequence for maximum perfect match (PM)-mismatch (MM) discrimina-tion during hybridizadiscrimina-tion. A set of four probes with identical sequences except for the nucleotide at the central base, which was A, T, G, or C, was designed for the detection of each SNP. The SNP-specific probes (SNP probes) are named after the position of the amino acid substitution within the TEM sequence, which means that, for example, S161 defines the polymorphism at position 161 in the
TEM amino acid sequence. There were two polymorphism sites within one triplet for substitutions at seven amino acid positions. Two sets of four probes each were designed for the detection of the two SNPs in each amino acid (e.g., S162 and 162.2).
[image:2.603.47.542.79.513.2]Oligonucleotide array fabrication.Oligonucleotide arrays were constructed with 168 oligonucleotide capture probes. The oligonucleotides were purchased from Invitrogen (Karlsruhe, Germany) and were desalted purity grade. The capture and control probe sequences are given in Table 1; probes equipped with a 15-thymidine spacer are indicated. Each SNP probe was spotted on the mi-croarray in triplicate. The array layout is shown in Fig. 1a. The probes were dissolved in spotting buffer (160 mM Na2SO4, 130 mM Na2HPO4) to a final concentration of 20M and spotted with a MicroGrid II microarraying robot by using MicroSpot 2500 pins (BioRobotics, Cambridge, United Kingdom) on ep-oxy-coated glass slides (Elipsa AG, Berlin, Germany). For covalent immobiliza-tion, the oligonucleotide array was incubated at 120°C for 30 min in a drying compartment (Memmert, Schwabach, Germany). For blocking, the slides were rinsed for 5 min in 0.1% (vol/vol) Triton X-100 in double-distilled H2O (ddH2O), TABLE 1. Oligonucleotide probe sequences used in the TEM-specific microarraya
Melting temp (°C) Length (bases) Name Probe sequence (5⬘-3⬘)b
52.7 18 Process control AGAAACGCTGGTGAAAGT
45.6 18 Negative hybridization control TCTAGACAGCCACTCATA
58.0 18 Positive hybridization control GATTGGACGAGTCAGGAGC
45.6 18 Spot control Cy5-TCTAGACAGCCACTCATA
56.4 22 S04 ATGAGTATTNAACATTTCCGTG
59.9 20 S19 GCATTTTGCNTTCCTGTTTT
56.3 19 S37 CTGAAGATNAGTTGGGTGC
66.8 21 S40 CAGTTGGGTGNACGAGTGGGT
72.4 27 S49 ATCGAACTGGATCNCAACAGCGGTAAG
66.1 26 S67 CGTTTTCCAATGNTGAGCACTTTTAA
59.9 24 S67.2 TTTTCCAATGATNAGCACTTTTAA
64.0 20 S78c ATGTGGTGCGGNATTATCCC
62.8 19 S82c TTATCCCGTNTTGACGCCG
68.3 17 S90 GCAACTCGNTCGCCGCA
51.4 20 S102 GACTTGGTTNAGTACTCACC
58.1 19 S113 ATCTTACGGNTGGCATGAC
59.6 22 S122 AGAATTATGCANTGCTGCCATA
58.9 18 S125 GTGCTGCCNTAACCATGA
64.8 24 S127 TGCCATAACCATGNGTGATAACAC
62.1 17 S143c CGGAGGANCGAAGGAGC
76.7 24 S151 CCGCTTTTTTGCNCAACATGGGGG
66.9 19 S161c CTCGCCTTGNTCGTTGGGA
57.5 17 S162 GCCTTGATNGTTGGGAA
62.6 19 162.2 GCCTTGATCNTTGGGAACC
61.3 17 S163 TTGATCGTNGGGAACCG
64.3 19 S163.2 TGATCGTTGNGAACCGGAG
55.6 17 S180 CACCACGANGCCTGTAG
67.4 19 S182 CGATGCCTGNAGCAATGGC
53.3 23 194.2 AACTATTAACTNGCGAACTACTT
51.7 22 194 ACTATTAACTGNCGAACTACTT
62.4 22 S202 CTAGCTTCCCNGCAACAATTAA
52.4 18 S216 AGTTGCAGNACCACTTCT
62.5 19 235.2 AAATCTGGANCCGGTGAGC
59.6 17 235 ATCTGGAGNCGGTGAGC
63.6 17 236 CTGGAGCCNGTGAGCGT
66.6 18 236.2 CTGGAGCCGNTGAGCGTG
67.2 18 S237 GAGCCGGTNAGCGTGGGT
56.9 17 241 GTGGGTCTNGCGGTATC
60.7 19 241.2 GTGGGTCTCNCGGTATCAT
54.0 22 S258 CCGTATCGTANTTATCTACACG
53.4 18 S261 TTATCTACANGACGGGGA
69.3 17 S264 CGACGGGGNGTCAGGCA
53.9 21 S271 ATGGATGAACNAAATAGACAG
52.9 21 S272 GGATGAACGANATAGACAGAT
58.1 23 S276 TAGACAGATCGNTGAGATAGGTG
aFour probes specific for each SNP position were used. The probes are named for the position in the amino acid sequence ofblaTEM. The four probes had A, G,
C, or T at the central base position (designated N in the probe sequence). The probe length (between 17 and 27 bases) and the melting temperatures (calculated for probes with a central base of G; DNA concentration, 50 nM; salt concentration, 50 mM) (6) are also provided.
bThe triplet with the amino acid substitution is underlined. cProbes with a 15-thymidine spacer.
VOL. 42, 2004 TEM BETA-LACTAMASE GENOTYPING WITH DNA MICROARRAYS 3767
on May 15, 2020 by guest
http://jcm.asm.org/
4 min in 0.5l of concentrated HCl per ml of ddH2O, and 10 min in a 100 mM KCl solution with constant stirring. Subsequently, the slides were incubated with the spotted side up in blocking solution (25% [vol/vol] ethylene glycol, 0.5l of concentrated HCl per ml of ddH2O) at 50°C in a heating compartment (OV5; Biometra, Go¨ttingen, Germany). To clean the slides, the slides were rinsed in ddH2O for 1 min and then dried under a flow of nitrogen. The spot size was estimated to be 150m, and the spot-to-spot distance was estimated to be 320
m. The processed slides were stored dry for a maximum of 20 days at room temperature in the dark until further use.
Controls.Several controls were included on the array: a spotting control (5⬘-cyanine 5 [Cy5]-TTTTTTTTTTTTTTCTAGACAGCCACTCATA-3⬘); a positive hybridization control (5⬘-TTTTTTTTTTTTTGATTGGACGAGTCAG GAGC-3⬘) complementary to a labeled oligonucleotide target (5⬘-Cy5-GCTC CTGACTCGTCCAATC-3⬘), which was spiked during hybridization; and a neg-ative hybridization control (5⬘-TTTTTTTTTTTTTTCTAGACAGCCACTCAT A-3⬘). All these control sequences are unrelated to sequences found in bacterial species. The sequence of the process control (5⬘-AGAAACGCTGGTGAAAG T-3⬘) corresponded to a sequence conserved within theblaTEMgene family. The spotting controls were set at the corner positions of each subgrid which was spotted with a different pin. The positive and negative hybridization controls appeared alternately at the side borders of each subgrid. The process controls were spotted in two lines bordering the central SNP probe sets of each subgrid (Fig. 1a).
Bacterial strains.Clinical samples were taken during the daily routine at the Robert Bosch Hospital (Stuttgart, Germany) and were processed by standard procedures. Bacterial strain identification and phenotypic antibiotic resistance determination were performed by standard procedures of the NCCLS (16). As
reference samples, Escherichia coliDH5␣ (Clontech, Heidelberg, Germany) transformed with plasmid pUC19 (New England Biolabs, Frankfurt, Germany) and European Antibiotic Resistance Surveillance System reference strain UA 1528 (provided by W. Witte, Robert Koch Institute, Wernigerode Branch, Wernigerode, Germany) were used. Before microarray analysis, the bacterial strains were inoculated on Mueller-Hinton agar plates at 37°C overnight. One loop of bacterial cells was dissolved in 250l of buffer P1 (Qiagen, Hilden, Germany), and the plasmid DNA was extracted by the protocol provided with a QIAprep Spin Miniprep kit (Qiagen).
Amplification, labeling, and purification ofblaTEMtarget DNA.The target DNA used for hybridization on the oligonucleotide arrays was synthesized by PCR. The primers used to amplify theblaTEMgene (with an expected amplicon length of 861 bp) were forward primer temforw (5⬘-ATGAGTATTCAACATT TCCG-3⬘) and reverse primer temrev (5⬘-TTAATCAGTGAGGCACCTAT-3⬘). For PCR amplification and labeling, 1.0 to 75.0 ng of plasmid DNA was supple-mented with 0.4M (each) forward and reverse primers, PCR buffer (2.5 mM magnesium acetate, 50 mM KCl, 10 mM Tris-HCl [pH 8.3]) containing 50M (each) dATP, dGTP, and dTTP; 30M dCTP; 20M Cy5-dCTP (Amersham Biosciences, Freiburg, Germany); and 10 U ofTaqDNA polymerase (Eppendorf AG, Hamburg, Germany) in a total volume of 100l. The amplification was performed in a Mastercycler gradient (Eppendorf AG, Hamburg, Germany). An initial denaturation step (94°C for 1 min) was followed by 30 cycles (with each cycle consisting of 94°C for 30 s, 55°C for 30 s, and 72°C for 1 min) and a final extension step at 72°C for 4 min. The PCR product was purified with the Qiaquick Spin PCR purification kit (Qiagen), according to the protocol of the manufacturer. The DNA was eluted in 30l of ddH2O. The rate of incorpora-tion of Cy5-dCTP, expressed as number of nucleotides/number of incorporated FIG. 1. (a) Layout of SNP capture probes on the TEM microarray. All SNP capture probes were spotted in triplicate. The SNP position is indicated above each triplicate. The nucleotide at the central base in the probe sequence is indicated on the left side of each row as A, G, C, or T neg. hyb. and pos. hyb. controls, negative and positive hybridization controls, respectively. (b) Fluorescence image of a hybridization experiment with 400 ng ofblaTEM-1target DNA (NT/F⫽83) for 3 h in an HS 400 hybridization station. The signal intensity is shown in false color. Blue
corresponds to the lowest signal intensity, and red to white depict the highest signal intensities (as output by ImaGene software [version 3.0]). (c) The results for SNP capture probe set S04 are enlarged for clarification.
on May 15, 2020 by guest
http://jcm.asm.org/
[image:3.603.101.483.70.401.2]fluorescent dyes (NT/F), was determined by measurement of the optical density (ND-1000 spectrophotometer; NanoDrop Technologies, Rockland, Maine).
Fragmentation.The amplified and labeled target DNA was diluted to a con-centration of 30 ng/l in reaction buffer (40 mM Tris-HCl [pH 8], 10 mM MgSO4, 1 mM CaCl2) and fragmented with DNase I (11.5 mU/l; Promega, Mannheim, Germany) at room temperature for 5 min to fragment sizes of about 15 to 150 bp in order to increase the efficiency of hybridization. The reaction was stopped by the addition of 3 mM EGTA and incubation at 65°C for 10 min. Fragment sizes were estimated by lab-on-a-chip electrophoresis (Bioanalyzer 2100 and DNA 1000 LabChip kit; Agilent, Bo¨blingen, Germany) and incubation at 65°C for 10 min.
Hybridization.Various amounts of fragmented target DNA (25 to 400 ng) to which control DNA ([Cy5-GCTCCTGACTCGTCCAATC]; 0.05 pmol) was added were hybridized under a coverslip (18 by 18 mm; Knittel Gla¨ser, Braun-schweig, Germany) in 30l of 6⫻SSPE (1⫻SSPE is 0.18 M NaCl, 10 mM NaH2PO4, and 1 mM EDTA [pH 7.7]) and incubated in hybridization chambers (Corning, Corning, N.Y.) and in a hybridization oven (OV5; Biometra) for 3 h at 45°C. After hybridization the slides were washed with 2⫻SSC (1⫻is 0.15 M NaCl plus 0.015 M sodium citrate)–0.1% sodium dodecyl sulfate (SDS), then 2⫻
SSC, and finally 0.2⫻SSC, each time for 10 min at room temperature with agitation in a glass container. The slides were then dried with N2. In the evalu-ation experiments the hybridizevalu-ations were carried out with an HS 400 hybrid-ization station (Tecan, Crailsheim, Germany) with an initial wash step with 6⫻
SSPE at 45°C for 30 s, followed by probe injection (400 ng of target DNA and 0.05 pmol of control DNA in 65l 6 x SSPE) and hybridization under medium agitation intensity at 45°C for 3 h. The slides were then washed at room tem-perature two times: for 2 min in 2⫻SSC–0.1% SDS and for 1.5 min in 0.2⫻SSC. The slides were dried with N2for 2 min.
Data acquisition and processing.After the hybridization reaction the data from the oligonucleotide arrays were extracted by acquisition of the fluorescence signals with a 418 array scanner (Affymetrix, Santa Clara, Calif.) at laser power and gain settings of 100%. Image processing and calculation of the signal inten-sities were performed with ImaGene software (version 3.0; Biodiscovery Inc., Los Angeles, Calif.). For calculation of the individual net signal intensities, the local background was subtracted from the raw spot intensity. To calculate the mean net signal intensity of one oligonucleotide probe on narrays,ntimes three replicates of one spot were used, herein referred to as the “signal intensity” (I). For each oligonucleotide set related to one SNP, the oligonucleotide probe with the highest signal intensity was considered to have a potential PM. The remain-ing three oligonucleotide probes with lower signal intensities were considered to have MMs. For comparison of interarray variation, mean intensity ratios were calculated by determining the ratio of the MM or PM signal intensity to the PM signal intensity within one SNP probe set and calculating the mean betweenn times three probe sets, herein referred to as the “relative intensity” (RI) of one oligonucleotide probe (RIMM⫽IMM/IPMand RIPM⫽IPM/IPM). Accordingly, all RIPMs had values of 1 and all RIMMs had values less than 1.
RESULTS
In the present study, an oligonucleotide microarray was de-veloped for the genotyping of TEM beta-lactamases from bac-teria isolated from real clinical samples. The probes used for the array design cover 99% of the amino acid substitution po-sitions published to date (http://www.lahey.org/studies/temtable .asp), except for those at the end positions of amino acids 2, 3, and 285 of the TEM beta-lactamase (Table 1). The plasmid DNA isolated from clinical samples was amplified and labeled with Cy5 during PCR with primers whose sequences flank the
blaTEMgene sequence and, as expected, yielded a 861-bp frag-ment. The NT/F ratio varied from 50 to 150, depending on the quality of the template DNA.
Setting up the system and proof of concept.To set up the
system and to show the feasibility of the method, the array was hybridized with the same amount of target DNA (100 ng) from a sample with TEM-116 that was derived from a laboratory culture ofE. coliK-12 bearing plasmid pUC19. The NT/F ratio for the target DNA was 57, and the target DNA was hybridized for 3 h in Corning hybridization chambers by using standard
coverslips. It was the aim to set a threshold indicating the level at which all PM positions for blaTEM from pUC19 could be considered correctly identified. Furthermore, the reproducibil-ity of the system was determined under standard conditions. The mean SIs and standard deviations for all SNP positions are shown in Fig. 2a. The absolute SIs ranged from 1,500 to 20,000 for the probes with PMs (Fig. 2a). The SNPs at 40 of 41 positions were correctly identified. Since the PM at position S182T showed spotting errors in this slide batch, it was not taken into account. The RIs were calculated to investigate the discriminatory power of the system. More than 99% of the RIMMvalues remained less than 0.4 (Fig. 2b); only S82 showed higher RIMM values, which were up to 0.52. The standard deviations for the mean RIMMranged from 0.01 to 0.12; more than 98% of the RIMM values remained below 10% of the RIPMvalue. Later in the study a PM was considered correctly identified (ID limit) if RIMMdid not exceed 0.7.
Reproducibility of PM and MM discrimination.To
deter-mine if the ratio of IMMto IPMafter hybridization with target DNA from a set of different amplification and labeling reac-tions was reproducible, the array was hybridized with five dif-ferent samples containing blaTEM-1 (400 ng of target DNA) with various NT/F ratios (71 to 180) for 3 h in an automated hybridization station. The net intensities of the same probes hybridized with different target DNA samples varied in some cases by a factor greater than 3 due to the differences in NT/F ratios or the efficiency of fragmentation. Since it should be determined if the ratio of IMMto IPMremains reproducible, RI was calculated. The mean and standard deviation RI values are given in Fig. 3. All 41 positions ofblaTEM-1could be correctly identified in every sample. The mean RIMMvalues varied, but 95% of the values remained below 0.4 and only 4% of the values were higher and were up to 0.6. S161 showed the weak-est discriminatory power, with an RIMMof 0.61. The standard deviations of the mean RIMMvalues varied from 0.01 to 0.21 (n
⫽5), but 79% of the values still remained below 10% of RIPM.
Testing of clinical samples.The performance of the array
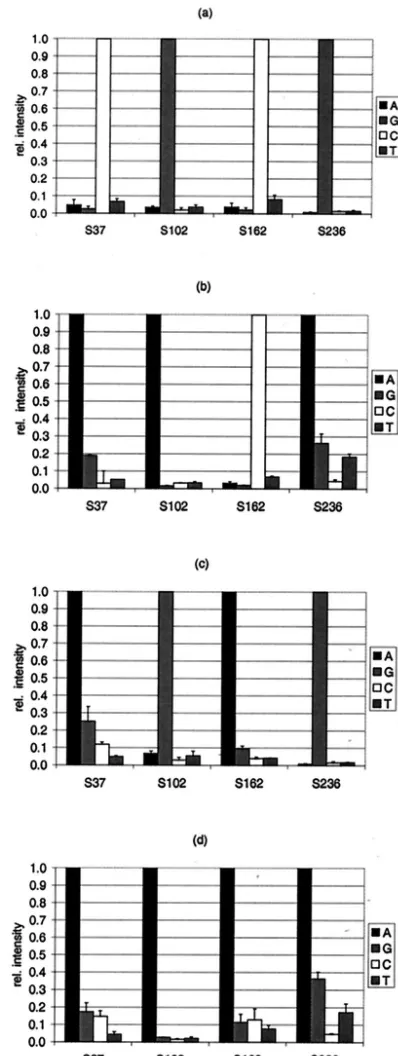
was tested with a set ofblaTEMgene variants originating from clinical samples and one EARSS reference strain as the target DNA. Specifically, the TEM variants investigated were TEM-1, -3, -7, and -8. The results of the identification ofblaTEM-1(n⫽ 5),blaTEM-3(n⫽2),blaTEM-7(n⫽2), andblaTEM-8(n⫽3) are given as RI values in Fig. 4. Only the SNP positions that varied in comparison to the sequence of blaTEM-1 are dis-played. All of these positions were identified without ambigu-ity. PM position S235 could not be identified in blaTEM-3,
blaTEM-7, orblaTEM-8due to a spotting failure, as mentioned above. The values for 91% of the MM positions remained below the RIMMlimit of 0.4 (data not displayed in Fig. 4). The RIMMvalues for only 9% of the MM positions were from 0.4 to 0.69. The standard deviations of the mean RIMM values varied from 0.01 to 0.36, but 92% of the values remained below 10% of RIPM(data not shown). The results were confirmed by standard DNA sequencing of the TEM variants tested (data not shown).
Reduction of assay time.The overall time to perform the
molecular diagnostic assay was 6 h, including 2 h for DNA amplification and labeling, 30 min for purification and frag-mentation, 3 h for hybridization, and 30 min for washing. Since this array should ultimately be applied in clinical settings, tests
VOL. 42, 2004 TEM BETA-LACTAMASE GENOTYPING WITH DNA MICROARRAYS 3769
on May 15, 2020 by guest
http://jcm.asm.org/
were conducted to determine whether the rate-limiting hybrid-ization time could be significantly reduced while keeping the sensitivity sufficient. Therefore, the influence of hybridization times from 1 h to 15 min on the hybridization signals under
coverslips in Corning hybridization chambers was investigated. At 1 h all 41 positions with PMs could be identified. The values for 84% of the MM positions investigated remained below the RIMMlimit of 0.4 (Fig. 5). The values for 14% were between
FIG. 2. (a) Mean signal intensities for each SNP position and corresponding probe (A, G, C, and T refer to the base at the central position) from a hybridization experiment with 100 ng ofblaTEMfrom pUC19 (NT/F⫽57) (n⫽3). (b) Number of probe MMs depending on the MM/PM
ratio from the experiment for which the results are shown in panel a.
on May 15, 2020 by guest
http://jcm.asm.org/
0.5 and 0.6, and S276A showed the weakest discriminatory power, with an RIMMof 0.69. The standard deviations of the RIMMvalues ranged from 0.01 to 0.2, and 91% of the values remained less than 10%. All positions with PMs could be iden-tified at 30 min, with 82% of the RIMMvalues being less than 0.4. In this case the values for 13% of the MM positions in-vestigated were between 0.5 and 0.6 and the values for 5% of the MM positions were up to 0.7; the value for one MM position (276A; RIMM ⫽ 0.86) exceeded the predefined ID limit (standard deviations of mean RIMMvalues, 0.01 to 0.34; 76% of the values were less than 0.1 and 22% were less than 0.3). Finally, at 15 min the values for 21% of the MM positions exceeded the ID limit. For six SNP positions PMs were even misidentified, with RIMM values⬎1 (standard deviations of mean RIMMvalues, 0.01 to 0.58; 66% of the values were less than 0.1 and 32% were less than 0.3). Thus, for hybridization times of 1 h and 30 min, all positions with PMs were correctly identified. At 30 min the value for one position with an MM exceeded the predefined ID limit of 0.7; however, when the correct PM identifications and the reliable identification of all the other positions are considered, this could be neglected. Thus, the hybridization time could be reduced to 30 min and
the total assay time could be reduced to less than 3.5 h and still retain the discriminatory power of the diagnostic array at a sufficient level.
DISCUSSION
ESBL-type beta-lactamases pose a clinical dilemma because their identification is complicated and time-consuming and therapy must often begin before potential resistance can be determined. Tests routinely performed for determination of antibiotic susceptibility require 2 days and can provide only an indication of the possible presence of ESBL-producing bacte-ria. Even automated susceptibility test systems (the VITEK ESBL card and the MicroScan NBPC30 system) give no essential information other than a prediction of the possible presence of an ESBL (17). However, the misinterpretation of results from tests for beta-lactam antibiotic resistance in the case of an ESBL-producing strain is possible. Therefore, a suspected ESBL-positive strain should always be analyzed by confirmatory methods like the double-disk test, test with E-test strips, or the combined disk method (14). The double-disk test is a low-cost method, but the results of the test may vary from
FIG. 3. Relative (rel.) intensities of the signals for all SNP positions in TEM averaged from five independent hybridizations withblaTEM-1target
DNA (n⫽5). The four probe sets are indicated in the legend by the central base (A, G, C, or T). The labeling efficiency (NT/F) of the hybridized sample DNA was 71 to 180; 400 ng of target DNA was applied.
VOL. 42, 2004 TEM BETA-LACTAMASE GENOTYPING WITH DNA MICROARRAYS 3771
on May 15, 2020 by guest
http://jcm.asm.org/
strain to strain, causing interpretive problems. E-test strips are expensive and require a heavier inoculum. The following must be considered for all these methods: (i) different susceptibility spectra, depending on the microorganism, should be analyzed for accurate ESBL detection (11); (ii) prediction of the
pres-ence of an ESBL according to the phenotype is not reliable for strains that have inducible chromosomal beta-lactamases; and (iii) most important, all methods require organism isolation and overnight cultivation before the phenotype can be deter-mined.
Genotyping, in contrast to phenotype-based antibiotic resis-tance tests, fails to identify which gene variant is generating the resistance and if it is a single isolated case or the result of a pandemic spread. Furthermore, genetic diagnostics could pro-vide information about all possible substrate patterns of the TEM variant, facilitating an appropriate treatment choice. De-spite the high costs of genotyping compared to those for phe-notypic resistance identification, the development of molecular biology-based assays is favorable due to the possibility of re-duced numbers of clinical failures and rere-duced costs for pa-tient monitoring. At present, the application of molecular bi-ology-based testing is disadvantageous because of its limited multiplexing capability (7). These tests are based on organism discrimination by use of specific primers (13), restriction en-zyme analysis (2), single-strand conformational polymorphism analysis (15), oligonucleotide probes (19), or intragenic frag-ment probes (3). In particular, the number of TEM or SHV variants that could be differentiated has been quite limited until now. To our knowledge, only Lee et al. (9) have described a DNA microarray that detects different beta-lactamase genes, but as the investigators used long DNA probes produced by gene-specific PCR, discrimination between the multitude of gene variants was technically not possible.
The genotyping microarray for TEM beta-lactamase pre-sented here can discriminate among 102 of the 106 variants whose sequences have been published to date. If a known TEM variant is detected, all possible substrate patterns can be predicted instantly. Under optimal conditions microarray anal-ysis of putative ESBL-producing strains can speed up antibiotic resistance detection from the usual 3 days (2 days for screening and 1 day for confirmation) to 2 days and 3.5 h for most of the isolates. Moreover, for ESBL surveillance under certain con-ditions, it is possible to reduce the response time to 1 day and 3.5 h. The implementation and the per-sample costs of this system will certainly be higher than those for the present cul-tubased methods, but the significantly improved time
re-FIG. 4. Relative (rel.) intensities of the signals for selected SNP positions according to the target DNA applied. The PMs at SNP positions 37, 102, 162, and 236 were identified to determine the origin of the target DNA:blaTEM-1(n⫽5) (a),blaTEM-3(n⫽2) (b),blaTEM-7
(n⫽2) (c), andblaTEM-8(n⫽3) (d). The four probe sets are indicated
[image:7.603.63.262.68.596.2]in the legend by their central base (A, G, C, or T).
FIG. 5. Number of probes with MMs depending on the MM/PM ratio from an hybridization experiment with 75 ng of DNA (NT/F⫽ 75) in Corning hybridization chambers for 1 h, 30 min, and 15 min (n⫽3).
on May 15, 2020 by guest
http://jcm.asm.org/
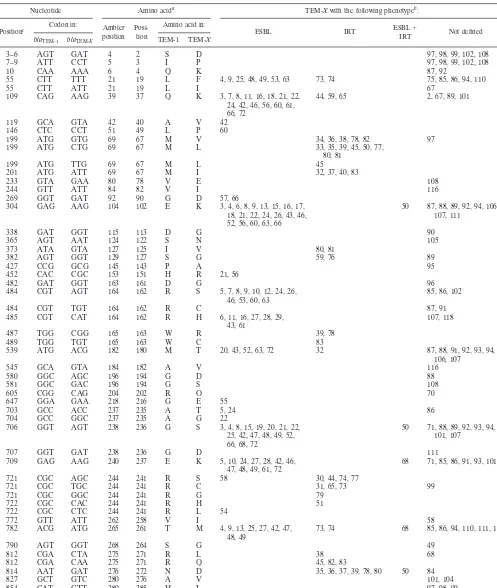
[image:7.603.306.539.547.688.2]TABLE 2. TEM beta-lactamase polymorphism sites and corresponding mutants
Nucleotide Amino acida TEM-Xwith the following phenotypeb:
Positionc Codon in: Ambler
position Posi-tion
Amino acid in:
ESBL IRT ESBLIRT⫹ Not defined
blaTEM-1 blaTEM-X TEM-1 TEM-X
3–6 AGT GAT 4 2 S D 97, 98, 99, 102, 108
7–9 ATT CCT 5 3 I P 97, 98, 99, 102, 108
10 CAA AAA 6 4 Q K 87, 92
55 CTT TTT 21 19 L F 4, 9, 25, 48, 49, 53, 63 73, 74 75, 85, 86, 94, 110
55 CTT ATT 21 19 L I 67
109 CAG AAG 39 37 Q K 3, 7, 8, 11, 16, 18, 21, 22, 24, 42, 46, 56, 60, 61, 66, 72
44, 59, 65 2, 67, 89, 101
119 GCA GTA 42 40 A V 42
146 CTC CCT 51 49 L P 60
199 ATG GTG 69 67 M V 34, 36, 38, 78, 82 97
199 ATG CTG 69 67 M L 33, 35, 39, 45, 50, 77,
80, 81
199 ATG TTG 69 67 M L 45
201 ATG ATT 69 67 M I 32, 37, 40, 83
233 GTA GAA 80 78 V E 108
244 GTT ATT 84 82 V I 116
269 GGT GAT 92 90 G D 57, 66
304 GAG AAG 104 102 E K 3, 4, 6, 8, 9, 13, 15, 16, 17, 18, 21, 22, 24, 26, 43, 46, 52, 56, 60, 63, 66
50 87, 88, 89, 92, 94, 106, 107, 111
338 GAT GGT 115 113 D G 90
365 AGT AAT 124 122 S N 105
373 ATA GTA 127 125 I V 80, 81
382 AGT GGT 129 127 S G 59, 76 89
427 CCG GCG 145 143 P A 95
452 CAC CGC 153 151 H R 21, 56
482 GAT GGT 163 161 D G 96
484 CGT AGT 164 162 R S 5, 7, 8, 9, 10, 12, 24, 26,
46, 53, 60, 63 85, 86, 102
484 CGT TGT 164 162 R C 87, 91
485 CGT CAT 164 162 R H 6, 11, 16, 27, 28, 29,
43, 61 107, 118
487 TGG CGG 165 163 W R 39, 78
489 TGG TGT 165 163 W C 83
539 ATG ACG 182 180 M T 20, 43, 52, 63, 72 32 87, 88, 91, 92, 93, 94,
106, 107
545 GCA GTA 184 182 A V 116
580 GGC AGC 196 194 G D 88
581 GGC GAC 196 194 G S 108
605 CGG CAG 204 202 R O 70
647 GGA GAA 218 216 G E 55
703 GCC ACC 237 235 A T 5, 24 86
704 GCC GGC 237 235 A G 22
706 GGT AGT 238 236 G S 3, 4, 8, 15, 19, 20, 21, 22, 25, 42, 47, 48, 49, 52, 66, 68, 72
50 71, 88, 89, 92, 93, 94, 101, 107
707 GGT GAT 238 236 G D 111
709 GAG AAG 240 237 E K 5, 10, 24, 27, 28, 42, 46,
47, 48, 49, 61, 72 68 71, 85, 86, 91, 93, 101
721 CGC AGC 244 241 R S 58 30, 44, 74, 77
721 CGC TGC 244 241 R C 31, 65, 73 99
721 CGC GGC 244 241 R G 79
722 CGC CAC 244 241 R H 51
722 CGC CTC 244 241 R L 54
772 GTT ATT 262 258 V I 58
782 ACG ATG 265 261 T M 4, 9, 13, 25, 27, 42, 47,
48, 49 73, 74 68 85, 86, 94, 110, 111, 118
790 AGT GGT 268 264 S G 49
812 CGA CTA 275 271 R L 38 68
812 CGA CAA 275 271 R Q 45, 82, 83
814 AAT GAT 276 272 N D 35, 36, 37, 39, 78, 80 50 84
827 GCT GTC 280 276 A V 101, 104
854 CAT CTT 289 285 H L 97, 98, 99
aAmbler position, position of the polymorphism in the amino acid sequence of TEM (http://www.lahey.org/Studies/temtable.asp) according to Ambler et al. (1);
position, position of the polymorphism according to the TEM amino acid sequence. The amino acids at the position in the TEM-1 sequence and the mutated TEM (TEM-X) sequence are also indicated.
bThe numbers in the table body are the TEM types with an amino acid substitution at the indicated position. The ESBL, IRT, and ESBL-IRT phenotypes are as
described by Bradford (5).
cPosition refers to the position of the polymorphism in the nucleotide sequence of thebla
TEMgene (GenBank accession number J01749).
VOL. 42, 2004 TEM BETA-LACTAMASE GENOTYPING WITH DNA MICROARRAYS 3773
on May 15, 2020 by guest
http://jcm.asm.org/
quirements offer a potential health benefit and reduced treat-ment times for patients, thereby reducing monitoring costs.
However, the DNA microarray has, as is the case for all genotyping methods, the challenge of coping with newly emerging types of resistance caused by mutations which are not yet included in the test. The incorporation of new probes in the system described here is nevertheless feasible and can be man-aged in an appropriate time scale. In addition, the need to amplify the target by PCR is still a shortcoming of the system. On the one hand, this prolongs the overall test time, and on the other hand, it makes the applicability of the test limited to amplifiable sequences. In our case, the regions whose se-quences matched the primer sese-quences could not be in-cluded in the genotyping test, resulting in exclusion of the ability to detect of TEM-97, -98, -99, and -102. TEM-108, which also shows point mutations in the primer-specific re-gion, could theoretically be identified by the SNPs at posi-tions 194.2 and 78. The four other TEM variants are seldom described and may be considered exceptional or endemic variants (S. Fanning and coworkers have directly submitted the TEM-97, -98, -99, and -108 sequences to GenBank, which can be found under accession numbers AF397066, AF397067, AF397068, and AF506748, respectively). A further complica-tion may arise if more than one resistance gene is targeted by the microarray test. In this case, multiplex PCR approaches (9, 18) or whole-genome amplification methods like strand dis-placement amplification (8, 9, 12) may be involved. Neverthe-less, the integration of probes for other ESBL-type variants (SHV, OXA, and CTX-M) into the assay described here is under way, and methods to circumvent problems arising from the consensus primer positions are being investigated. If this work is completed, the findings will lead to an effective and fast way to test for the occurrence of ESBL and/or IRT genes in the clinic.
Conclusion. The array for the genotyping of TEM
beta-lactamases described here has been shown to be a reproducible and sensitive means for the identification of various gene vari-ants of ESBL-type beta-lactamases which cannot be identified by simple cultivation-based assays. With an assay time of less than 3.5 h, this method can be considered a rapid method for the detection of ESBL and IRT TEM beta-lactamases and offers to be a valuable tool that can be used to monitor the spread of these resistance genes in the clinical setting.
ACKNOWLEDGMENTS
We thank Wolfgang Witte for helpful discussions and providing reference strains.
This work was financed by the German Federal Ministry of Educa-tion and Research (BMBF) within the GenoMik (Genome Research on Microorganisms) project.
REFERENCES
1. Ambler, R. P., A. F. W. Coulson, J. M. Frere, J. M. Ghuysen, B. Joris, M. Forsman, R. C. Levesque, G. Tiraby, and S. G. Waley.1991. A standard numbering scheme for the class-A beta-lactamases. Biochem. J.276:269–270. 2. Arlet, G., G. Brami, D. Decre, A. Flippo, O. Gaillot, P. H. Lagrange, and A. Philippon.1995. Molecular characterization by PCR-restriction fragment length polymorphism of TEM beta-lactamases. FEMS Microbiol. Lett.134:
203–208.
3. Arlet, G., and A. Philippon.1991. Construction by polymerase chain-reaction and intragenic DNA probes for 3 main types of transferable beta-lactamases (TEM, SHV, Carb). FEMS Microbiol. Lett.82:19–25.
4. Booth, S. A., M. A. Drebot, I. E. Martin, and L. K. Ng.2003. Design of oligonucleotide arrays to detect point mutations: molecular typing of anti-biotic resistant strains of Neisseria gonorrhoeae and hantavirus infected deer mice. Mol. Cell. Probes17:77–84.
5. Bradford, P. A.2001. Extended-spectrum beta-lactamases in the 21st cen-tury: characterization, epidemiology, and detection of this important resis-tance threat. Clin. Microbiol. Rev.14:933–951.
6. Breslauer, K. J., R. Frank, H. Blocker, and L. A. Marky.1986. Predicting DNA duplex stability from the base sequence. Proc. Natl. Acad. Sci. USA
83:3746–3750.
7. Fluit, A. C., M. R. Visser, and F. J. Schmitz.2001. Molecular detection of antimicrobial resistance. Clin. Microbiol. Rev.14:836–871.
8. Hosono, S., A. F. Faruqi, F. B. Dean, Y. Du, Z. Sun, X. Wu, J. Du, S. F. Kingsmore, M. Egholm, and R. S. Lasken.2003. Unbiased whole-genome amplification directly from clinical samples. Genome Res.13:954–964. 9. Lee, Y., C. S. Lee, Y. J. Kim, S. Chun, S. Park, Y. S. Kim, and B. D. Han.
2002. Development of DNA chip for the simultaneous detection of various beta-lactam antibiotic-resistant genes. Mol. Cell14:192–197.
10. Livermore, D. M.1995.-Lactamases in laboratory and clinical resistance. Clin. Microbiol. Rev.8:557–584.
11. Livermore, D. M., and D. F. Brown.2001. Detection of beta-lactamase-mediated resistance. J. Antimicrob. Chemother.48(Suppl. 1):59–64. 12. Lovmar, L., M. Fredriksson, U. Liljedahl, S. Sigurdsson, and A. C. Syvanen.
2003. Quantitative evaluation by minisequencing and microarrays reveals accurate multiplexed SNP genotyping of whole genome amplified DNA. Nucleic Acids Res.31:e129.
13. Mabilat, C., and P. Courvalin.1990. Development of oligotyping for char-acterization and molecular epidemiology of TEM beta-lactamases in mem-bers of the familyEnterobacteriaceae. Antimicrob. Agents Chemother.34:
2210–2216.
14. M’Zali, F. H., A. Chanawong, K. G. Kerr, D. Birkenhead, and P. M. Hawkey.
2000. Detection of extended-spectrum beta-lactamases in members of the family Enterobacteriaceae: comparison of the MAST DD test, the double disc and the Etest ESBL. J. Antimicrob. Chemother.45:881–885. 15. M’Zali, F. H., J. Heritage, D. M. Gascoyne-Binzi, A. M. Snelling, and P. M.
Hawkey.1998. PCR single strand conformational polymorphism can be used to detect the gene encoding SHV-7 extended-spectrum beta-lactamase and to identify different SHV genes within the same strain. J. Antimicrob. Che-mother.41:123–125.
16. NCCLS.2001. Performance standards for antimicrobial susceptibility testing, eleventh informational supplement. M100-S11. NCCLS, Wayne, Pa. 17. Sanders, C. C., A. L. Barry, J. A. Washington, C. Shubert, E. S. Moland,
M. M. Traczewski, C. Knapp, and R. Mulder.1996. Detection of extended-spectrum-beta-lactamase-producing members of the family Enterobacteri-aceaewith the Vitek ESBL test. J. Clin. Microbiol.34:2997–3001. 18. Strommenger, B., C. Kettlitz, G. Werner, and W. Witte.2003. Multiplex PCR
assay for simultaneous detection of nine clinically relevant antibiotic resis-tance genes inStaphylococcus aureus. J. Clin. Microbiol.41:4089–4094. 19. Tham, T. N., C. Mabilat, P. Courvalin, and J. L. Guesdon.1990. Biotinylated
oligonucleotide probes for the detection and the characterization of TEM-type extended broad-spectrum beta-lactamases in Enterobacteriaceae. FEMS Microbiol. Lett.69:109–115.
20. Troesch, A., H. Nguyen, C. G. Miyada, S. Desvarenne, T. R. Gingeras, P. M. Kaplan, P. Cros, and C. Mabilat.1999.Mycobacteriumspecies identification and rifampin resistance testing with high-density DNA probe arrays. J. Clin. Microbiol.37:49–55.
on May 15, 2020 by guest
http://jcm.asm.org/
JOURNAL OFCLINICALMICROBIOLOGY, Oct. 2004, p. 4918 Vol. 42, No. 10
0095-1137/04/$08.00⫹0 DOI: 10.1128/JCM.42.10.4918.2004
ERRATUM
Use of DNA Microarrays for Rapid Genotyping of TEM Beta-Lactamases
That Confer Resistance
Verena Grimm, Satoshi Ezaki, Milorad Susa, Cornelius Knabbe, Rolf D. Schmid, and
Till T. Bachmann
Institute of Technical Biochemistry, University of Stuttgart, and Department of Clinical Chemistry and Laboratory Medicine, Robert Bosch Hospital, Stuttgart, Germany
Volume 42, no. 8, p. 3766–3774, 2004. Page 3772: Lines 6 and 7 should read as follows: “In contrast to genotyping, phenotype-based antibiotic resistance tests fail to identify. . .”